Yi Wang, Wei Zhang (2024). “Pay attention to that aggressive vehicle”: The effect of Aggressive Vehicle Warning Systems on driving behavior and perceived workload. In: Advances in Human Factors of Transportation. AHFE Open Access, vol. 148, pp. 372–381. https://doi.org/10.54941/ahfe1005228
Aggressive driving is a common issue in daily life and brings negative impacts on traffic efficiency and road safety. Advances in connected vehicle technology facilitate vehicle-to-vehicle (V2V) communication and allow drivers to better understand the intentions and behaviors of surrounding vehicles, providing new ideas for addressing the challenges posed by aggressive driving. In a driving simulator experiment, the present study aimed to explore the effect of aggressive vehicle warning systems (AVWSs) on driving behavior and perceived workload during hazard events. AVWSs access vehicles’ driving styles based on their past behaviors and present visual-auditory messages when it perceives the driving style of a nearby vehicle as aggressive. Eighteen drivers participated in the experiment and were randomly assigned to two groups, one with messages from the AVWS (AVWS group) and the other without messages (baseline group). Each driver experienced three types of hazard events caused by surrounding aggressive vehicles: braking, lane-changing, and traffic rules violations at intersections. The results indicated that the AVWS could orient drivers’ attention to the aggressive vehicle in advance, thereby reducing their risk of being involved in collisions in unpredictable intersection events and reducing their response time in emergency braking events. Drivers in the AVWS group also perceived a lower level of mental workload and frustration than those in the baseline group when experiencing hazard events. However, caution should be taken when there are conflicts between the message and the actual situation, such as vehicles with non-aggressive driving styles exhibiting aggressive driving behavior. The findings of this study may provide some implications for the design of driving assistance systems, especially in intelligent vehicles.
Park et al. (2019) pointed out that aggressive driving was closely associated with crash occurrences and a leading factor that put young drivers in danger (Reason et al., 1990). Aggressive driving would deteriorate stable interac- tions with adjacent vehicles, and even disrupt traffic capacity and efficiency (Shinar, 1998; Chen, Wang and Lu, 2023).
Some recent studies have been conducted to classify different driving styles with the hope of enhancing road safety. Researchers collected data through driving simulators or test vehicles and used algorithms such as machine learn- ing, and clustering to classify drivers into different groups (Wang et al., 2017; Mantouka, Barmpounakis and Vlahogianni, 2019; Mohammadnazar, Arvin and Khattak, 2021; Chen, Wang and Lu, 2023). For instance, Mantouka, Barmpounakis and Vlahogianni (2019) collected data via sensors embed- ded in smartphones and developed a two-stage clustering approach to detect aggressive trips based on speeding, mobile usage, acceleration profile, and harsh manoeuvres.
The emerging connected vehicle (CV) technologies offer a promising opportunity to classify driving styles using real-time data. Through vehicle- to-vehicle (V2V) and vehicle-to-infrastructure (V2I) communications, the dynamic wireless exchange of data between vehicles on the roadway and between vehicles and the infrastructure can be realized (Osman, Codjoe and Ishak, 2015; Richard et al., 2015). Mohammadnazar, Arvin and Khat- tak (2021) made use of 27 million basic safety messages generated by CVs to classify drivers into aggressive, normal, and calm groups on highways, commercial streets, and residential streets.
With driving style classification algorithms and real-time driving data, it is possible to detect aggressive vehicles, integrate relevant information into driv- ing assistance systems (DASs), and provide drivers with warnings. Although various DASs have been developed to reduce the number and severity of crashes on the road in the past few years (Meng et al., 2015), such as Forward Collision Warning System, and Lane Changing Warning System, existing DASs mainly focus on the ego-vehicle and detect its potential risks. Drivers may also expect to be aware of the status of nearby vehicles, espe- cially the location of aggressive vehicles that pose collision risks, which can be achieved through an Aggressive Vehicle Warning System (AVWS). However, few studies have explored the possibility of applying AVWSs during driving.
This study aims to investigate the effect of a novel DAS, namely AVWS, on driver behavior and perceived workload. It is predicted that AVWSs will improve drivers’ safety performance compared to no additional informa- tion. Specifically, drivers may be involved in fewer crashes and have shorter response times and more stable speeds (Adell, Várhelyi and Fontana, 2011). By reminding drivers of nearby aggressive vehicles, AVWSs are also expected to reduce drivers’ perceived workload in hazard events (Tanaka et al., 2000). The results of this study may provide some implications for DAS design, especially in the CV environment.
METHOD
Participants and Apparatus A total of 18 participants (14 males, 4 females) took part in the driving simu- lator experiment, whose ages ranged from 21 to 30 years old (Mean = 24.39,
374 Yi and Wei
SD = 2.95). They all held valid driving licenses with a minimum driving expe- rience of one year, with normal or corrected-to-normal vision and normal hearing. None of them reported experiencing simulator sickness.
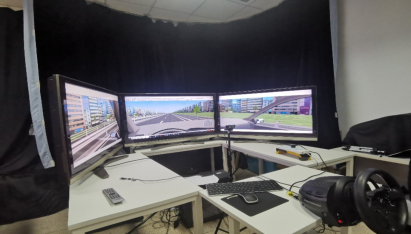
The used simulator consisted of three 45-inch screens (3 × 1920 × 1080 pixels) and one set of Thrustmaster T300RS GT racing force feedback steering wheels and pedals (Figure 1). The driving simulation software UC-win/Road (FORUM8 Co., Ltd) was used to create driving scenarios.
Figure 1: Experimental apparatus.
Experimental Design A between-subject design was used. The participants were randomly assigned to either the baseline group (N = 9) or the AVWS group (N = 9). There was no significant difference between their age, driving experience, and driving mileage (all p > 0.05). Each group consisted of 7 males and 2 females.
Participants in the baseline group received no additional information, whereas participants in the AVWS group received visual and auditory cues when aggressive vehicles were surrounding them. The visual warning was displayed on the head-up display for 6 seconds. Table 1 presents the mean- ing of the visual elements. At the same time as the visual warning appeared, participants would also hear two single beeps of 300 ms (interval: 100 ms) as the auditory warning.
Table 1. Visual elements in the AVWS.
Table available in the original PDF paper.
Elements Meanings
Participant vehicle Aggressive vehicle
Non-aggressive vehicle
The participants were required to perform an 11 km drive on the two-lane city road with a speed limit of 60 km/h. Each participant would encounter four hazard events on the straight road (Park et al., 2019), and one traffic
“Pay Attention to That Aggressive Vehicle” 375
rule violation event at the intersection (E01 ∼E05 in Table 2). In addition, another two events (E06, E07) were added to simulate situations where warn- ings of the AVWS contradicted real events (i.e., false alarm and miss alarm). To avoid anticipatory effects, the sequence of the seven hazard events was rearranged, especially those of the same type. These events occurred every 1 ∼2 minutes. Two types of dependent variables were collected: Driving performance. Driving performance was measured by the number of collisions, the number of changing lanes, the response time (RT), minimum time-to-collision (minTTC), the standard deviation of speed (SD of Speed), and mean depth of brake pedal (from 0 “no pressure” to 1 “full depth”) during the event zone (Li et al., 2020). The event zone started from the time that the aggressive vehicle began to brake, change lanes, or pass through the intersection, and lasted for 15 seconds. MinTTC was a measure of the risk of being involved in an accident.
Perceived workload. The NASA-TLX was used to measure drivers’ per- ceived workload (Hart and Staveland, 1988).
Table 2. Hazard events.
Table available in the original PDF paper.
Events Description AVWS group Baseline group E01 The front vehicle braked suddenly.
E02 The front vehicle’s front vehicle braked suddenly.
E03 The left vehicle changed to the participant lane suddenly.
E04 The left vehicle’s front vehicle changed to the participant lane suddenly.
(Continued)
376 Yi and Wei
Table 2. Continued Events Description AVWS group Baseline group
Table available in the original PDF paper.
E05 The right vehicle violated traffic rules and drove through a red light.
E06 The opposite vehicle went straight at a normal speed (false alarm).
E07 The opposite vehicle turned left at a high speed (miss alarm).
Procedure The participants first signed an informed consent. Subsequently, they famil- iarized themselves with the simulator for ∼10 min during the practice session. Participants in the AVWS group also learned about the AVWS. Once they were clear about the experiment, they could start the formal experimental session, where they should drive along the right lane, follow traffic rules, and ensure their safety. After finishing the driving task, they were required to com- plete the NASA-TLX to evaluate their perceived workload during driving. The experiment lasted for ∼50 min, and each participant was compensated 60 RMB.
Data Analysis The independent t-test (normally distributed) or Mann-Whitney U test (non- normally distributed) was conducted on each dependent variable to compare the driver behavior and perceived workload of the drivers in the two groups. The significance level was set at 0.05.
RESULT
Driving Behavior The number of collisions. 33.33% of participants in the baseline group (3 out of 9) were involved in 3 collisions, while there were no collisions in the AVWS group.
The number of lane-changing. Participants in the AVWS group tended to change lanes more frequently (M = 7.11, SD = 1.05) than in the baseline
“Pay Attention to That Aggressive Vehicle” 377
group (M = 6.00, SD = 2.24), but the difference did not reach the significance level (z = −1.012, p = 0.359).
Braking: E01. The system had a marginally significant effect on minTTC (t (16) = 2.036, p = 0.059). Participants in the AVWS group had smaller minTTC than those in the baseline group (see Table 3). The differences between their RT (t (16) = 0.396, p = 0.697), SD of speed (t (16) = 0.920, p = 0.371), and mean depth of brake pedal (t (16) = 0.881, p = 0.391) did not reach the significance level.
Braking: E02. The system did not have significant effects on the RT, (t (16) = 0.805, p = 0.432), minTTC (t (16) = 0.351, p = 0.730), SD of speed (t (16) = 1.235, p = 0.235) or mean depth of brake pedal (z = 0.927, p = 0.387) of the participants in the AVWS and baseline groups.
Lane changing: E03. Similarly, there were no significant effects of the sys- tem on the RT (z = −0.630, p = 0.574), minTTC (z = 0.044, p = 1), SD of Speed (z = −0.221, p = 0.863) or mean depth of brake pedal (z = −0.664, p = 0.545) of the participants in both groups.
Lane changing: E04. The system did not have significant effects on the RT (t (16) = 1.269, p = 0.227), minTTC (z = 0.044, p = 1), SD of Speed (z = 0.221, p = 0.863), or mean depth of brake pedal (z = −1.018, p = 0.339) of the participants in both groups.
Intersection: E05. The system had a significant effect on minTTC (z = −2.605, p = 0.008). Participants in the AVWS group had a signifi- cantly larger minTTC than those in the baseline group, indicating a lower risk of being involved in collisions. The differences between their RT, SD of speed, and mean depth of brake pedal did not reach the significance level (all p > 0.05).
Table 3. Driving behavior of the participants in the AVWS and baseline groups.
Table available in the original PDF paper.
Event RT (s) minTTC (s) SD of speed Braking depth AVWS Baseline AVWS Baseline AVWS Baseline AVWS Baseline
False alarm: E06. Since no hazard events happened in E06, RT and minTTC could not be calculated. The effect of the system on participants’ SD of Speed (t (16) = −1.815, p = 0.100) and mean depth of brake pedal (t (16) = −1.842, p = 0.096) did not reach the significance level.
Miss alarm: E07. Again, there were no significant effects of the system on the RT (t (16) = 0.941, p = 0.369), minTTC (z = −0.574, p = 0.605), SD of Speed (t (16) = −0.424, p = 0.677), or mean depth of brake pedal (t (16) = 0.462, p = 0.65) of the participants in both groups.
378 Yi and Wei
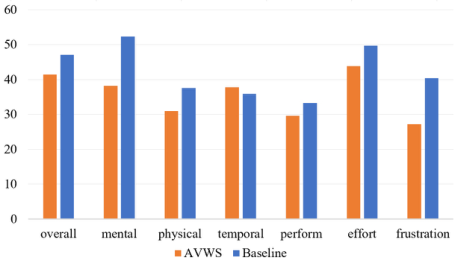
Perceived Workload Participants in the AVWS group perceived lower levels of overall workload than those in the baseline group, especially mental workload, and frustra- tion (Figure 2). However, none of the differences between them reached the significance level (all p > 0.05).
Figure 2: Perceived workload of participants in the AVWS and baseline group.
DISCUSSION
Drivers in the AVWS group perceived lower levels of mental workload and frustration during hazard events than drivers who were not provided with additional information in the baseline group. In unpredictable intersection events (E05), drivers in the AVWS group were also at less risk of being involved in collisions. Specifically, they had a significantly larger minTTC than those in the baseline group, indicating that information on AVWSs in the CV environment had the potential to improve road safety, consistent with Yang et al. (2020). In braking and lane-changing events (E01-E04), drivers’ response time tended to be shorter with the assistance of AVWSs, and the reduction in response time was more pronounced the further the aggressive vehicle’s distance from the ego-vehicle in braking events. How- ever, their minTTC also became smaller, i.e., they appeared to exhibit less cautious driving behavior.
However, caution should be especially taken when the information pro- vided by AVWSs is inconsistent with facts. In the false alarm event (E06), although the aggressive vehicle did not show unsafe driving behavior, drivers in the AVWS group reacted more unsteadily by applying more pressure on the brake pedals and exhibiting greater speed variations. In the miss alarm event (E07), they reacted quickly when a safe vehicle showed aggressive behavior, but they were also at a higher risk of being involved in collisions indicated by smaller minTTC, again indicating a less cautious driving style.
In addition, drivers in the AVWS group tended to change lanes more fre- quently than drivers in the baseline group. One possible explanation is that drivers did not hope to drive in the same lane as aggressive vehicles after knowing their position. It should be noted that frequent and arbitrary lane- changing behavior may cause the ego-vehicle to be identified as an aggressive
“Pay Attention to That Aggressive Vehicle” 379
vehicle and such behavior has negative impacts on the efficiency of traffic flow (Zheng et al., 2013; Ali et al., 2020).
Despite the possible benefits brought by AVWSs, privacy and data secu- rity in the CV environment should be considered carefully. On the one hand, avoid discrimination due to the labels of “aggressive” and “non-aggressive” vehicles. On the other hand, it is crucial to make tradeoffs between critical information to enhance driving safety and new potential attacks (e.g., mali- cious data injections). Privacy-sensitive approaches to the collection, transfer, processing, and storage of data are recommended (Taylor et al., 2018).
Several limitations of the current study should be acknowledged. First, this study included a small sample size and limited driving scenarios. More drivers and driving scenarios were needed when considering the generalizability of the results. Second, more research is required to compare the AVWS with existing DASs, because they may enhance driving safety through different mechanisms.
CONCLUSION
In conclusion, this study investigated the potential benefits of a novel DAS, namely the Aggressive Vehicle Warning System (AVWS), in hazard events. The AVWS offered an effective means of orienting drivers’ attention to aggressive vehicles, therefore decreasing drivers’ risk of being involved in col- lisions in unpredictable intersection events and reducing their response time in emergency braking events. The AVWS was effective in alleviating drivers’ mental workload and frustration during hazard events as well. However, cau- tion should be taken when there are contradictions between the warnings and facts. The findings of this study may provide some implications for the design of driving assistance systems, especially in connected vehicles.
ACKNOWLEDGMENT
This study was supported by the National Natural Science Foundation of China [grant number 72301151, 72192824].
REFERENCES
AAA Foundation (2019) ‘Aggressive Driving’. Available at: https://exchange.aaa.c om/safety/driving-advice/aggressive-driving/ (Accessed: 3 June 2021). Adell, E., Várhelyi, A. and Fontana, M. dalla (2011) ‘The effects of a driver assistance
system for safe speed and safe distance – A real-life field study’, Transportation Research Part C: Emerging Technologies, 19(1), pp. 145–155. Available at: https: //doi.org/10.1016/j.trc.2010.04.006. Ali, Y. et al. (2020) ‘Understanding the discretionary lane-changing behaviour in the connected environment’, Accident Analysis & Prevention, 137, p. 105463. Available at: https://doi.org/10.1016/j.aap.2020.105463. Chen, Y., Wang, K. and Lu, J. J. (2023) ‘Feature selection for driving style and
skill clustering using naturalistic driving data and driving behavior question- naire’, Accident Analysis & Prevention, 185, p. 107022. Available at: https: //doi.org/10.1016/j.aap.2023.107022.
380 Yi and Wei
Hart, S. G. and Staveland, L. E. (1988) ‘Development of NASA-TLX (Task Load Index): Results of Empirical and Theoretical Research’, in Advances in Psychology. Elsevier, pp. 139–183. Available at: https://doi.org/10.1016/S0166- 4115(08)62386-9. Li, S. et al. (2020) ‘Effects of speech-based intervention with positive comments on
reduction of driver’s anger state and perceived workload, and improvement of driving performance’, Applied Ergonomics, 86, p. 103098. Available at: https: //doi.org/10.1016/j.apergo.2020.103098. Mantouka, E. G., Barmpounakis, E. N. and Vlahogianni, E. I. (2019) ‘Identifying driving safety profiles from smartphone data using unsupervised learning’, Safety Science, 119, pp. 84–90. Available at: https://doi.org/10.1016/j.ssci.2019.01.025. Meng, F. et al. (2015) ‘Dynamic Vibrotactile Signals for Forward Collision Avoid-
ance Warning Systems’, Human Factors: The Journal of the Human Factors and Ergonomics Society, 57(2), pp. 329–346. Available at: https://doi.org/10.1177/ 0018720814542651. Mohammadnazar, A., Arvin, R. and Khattak, A. J. (2021) ‘Classifying travelers’ driving style using basic safety messages generated by connected vehicles: Application of unsupervised machine learning’, Transportation Research Part C: Emerging Technologies, 122, p. 102917. Available at: https://doi.org/10.1016/j.trc.2020. 102917. Osman, O. A., Codjoe, J. and Ishak, S. (2015) ‘Impact of Time-to-Collision Infor-
mation on Driving Behavior in Connected Vehicle Environments Using A Driving Simulator Test Bed’, Journal of Traffic and Logistics Engineering, 3(1). Available at: https://doi.org/10.12720/jtle.3.1.18-24. Park, Subin et al. (2019) ‘Understanding impacts of aggressive driving on freeway safety and mobility: A multi-agent driving simulation approach’, Transportation Research Part F: Traffic Psychology and Behaviour, 64, pp. 377–387. Available at: https://doi.org/10.1016/j.trf.2019.05.017. Reason, J. et al. (1990) ‘Errors and violations on the roads: a real distinction?’,
Ergonomics, 33(10–11), pp. 1315–1332. Available at: https://doi.org/10.1080/ 00140139008925335. Richard, C. M. et al. (2015) Multiple Sources of Safety Information from V2V and V2I: Redundancy, Decision Making, and Trust-Safety Message Design Report. No. FHWA-HRT-15-007. United States. Federal Highway Administration. Office of Research, Development, and Technology. Shinar, D. (1998) ‘Aggressive driving: the contribution of the drivers and the situ-
ation’, Transportation Research Part F: Traffic Psychology and Behaviour, 1(2), pp. 137–160. Available at: https://doi.org/10.1016/S1369-8478(99)00002-9. Tanaka, J. et al. (2000) ‘Workload of using a driver assistance system’, in ITSC2000. 2000 IEEE Intelligent Transportation Systems. Proceedings (Cat. No.00TH8493). 2000 IEEE Intelligent Transportation Systems. Proceedings, Dearborn, MI, USA: IEEE, pp. 382–386. Available at: https://doi.org/10.1109/IT SC.2000.881093. Taylor, P. et al. (2018) Internet of Things. London: Royal Academy of Engineering. Wang, W. et al. (2017) ‘Driving Style Classification Using a Semisupervised Sup-
port Vector Machine’, IEEE Transactions on Human-Machine Systems, 47(5), pp. 650–660. Available at: https://doi.org/10.1109/THMS.2017.2736948.
“Pay Attention to That Aggressive Vehicle” 381
Yang, G. et al. (2020) ‘Connected vehicle real-time traveler information messages for freeway speed harmonization under adverse weather conditions: Trajectory level analysis using driving simulator’, Accident Analysis & Prevention, 146, p. 105707. Available at: https://doi.org/10.1016/j.aap.2020.105707. Zheng, Z. et al. (2013) ‘The effects of lane-changing on the immediate follower:
Anticipation, relaxation, and change in driver characteristics’, Transportation Research Part C: Emerging Technologies, 26, pp. 367–379. Available at: https: //doi.org/10.1016/j.trc.2012.10.007.
LISTED IN THE AHFE DIGITAL BOOKSTORE CATALOGUE
Explore the complete digital volume
Advances in Human Factors of Transportation
Read this individual research paper free through the original publisher, or explore the full digital proceedings book.
ISBN 978-1-964867-24-3
Explore this ISBN in the AHFE Bookstore ↗Listed in the July 2026 bookstore catalogue; search by ISBN to confirm current availability · Digital book purchase optional