Weilin Cai, Meiyu Zhou, Yi Wang, Zhengyu Wang (2025). Form Design of Manual Wheelchair Products Based on Evaluation Grid Method and BP Neural Network. In: Ergonomics In Design and Kansai Engineering. AHFE Open Access, vol. 170, pp. 195–205. https://doi.org/10.54941/ahfe1006181
In modern rehabilitation assistive devices, manual wheelchairs are a key tool for improving the quality of life for people with mobility impairments. Their design should consider functionality and safety and deeply explore users' emotional needs to achieve a more humane and attractive product form design. This study is based on the theory of Kansei Engineering, combined with the Evaluation Grid Method (EGM) and Back-propagation Neural Network (BPNN) methods, aiming to establish a mapping relationship model between user emotional needs and the design elements of manual wheelchair product form to explore manual wheelchair product design solutions that meet user emotional needs. Firstly, the manual wheelchair samples were evaluated using the EGM to identify attractiveness factors based on user preferences. Then, the semantic difference (SD) method is used to quantify users' Kansei imagery evaluation of manual wheelchair products. Finally, by constructing a BPNN model, the mapping relationship between the design elements of the manual wheelchair form and the user's Kansei imagery was achieved. Mean square error (MSE) was used as a metric to measure the accuracy of the BPNN model to validate the effectiveness of the BPNN prediction model. This study not only enhances the rationality of the form design of manual wheelchair products but also provides valuable references for product design and manufacturing driven by user attractiveness.
In today’s highly saturated consumer market, wheelchairs are not only important mobility tools for people with limited mobility, but their design also carries emotional and social significance (Mattie et al., 2020). The design of wheelchairs should not only meet basic functional needs but also incorporate emotional design elements such as beautiful shapes to enhance user confidence, reduce social bias, promote social acceptance and respect for wheelchair users, and enable users to better integrate into society (Yang et al., 2021). However, Designers often face challenges in capturing and understanding consumers’ emotional needs; even consumers may not be fully aware of them (Wang et al., 2022; Yang et al., 2023). Kansei Engineering (KE) is a translation technique that transforms users’ perceptions and intentions
into product design specifications (Wang and Zhou, 2020). By obtaining users’ emotional needs and determining key design elements of the product, a mapping relationship model is established between the two to improve the design efficiency of designers. In recent years, the Evaluation Grid Method (EGM) has been successfully applied to KE to capture the attractiveness factors between consumers and product design elements (Wang and Yang, 2023). Wu and Chen (2022) used EGM to extract attraction factors for food design. Ho and Hou (2015) used EGM to determine the attractiveness factors of application icons.
With the development of artificial intelligence (AI) technology, AI techniques such as neural networks, genetic algorithms, grey relational analysis (GRA), and TOPSIS are widely used to construct mapping relationship models between user perception and product design elements (Kang, 2020; Quan et al., 2019; Woo et al., 2022). These technologies demonstrate significant advantages in simulating human thinking due to their high efficiency and speed (Kang, 2020). Quan et al. (2019) proposed using GRA-TOPSIS matching to obtain electric drill products and emotional perception for emotional product evaluation. Based on KE, Woo et al. (2022) introduced BPNN to establish a nonlinear mapping model between the design features of electric toothbrushes and product Kansei imagery. Li et al. (2022) believe that the numerical relationship between product design features and Kansei imagery is not linear and requires multiple methods to address these issues. However, the BPNN method has powerful capabilities for performing efficient classification and regression tasks, is simple and effective, and is suitable for solving nonlinear problems (Li et al., 2022). Therefore, this study aims to explore users’ preferences for the form design elements of manual wheelchair products by combining KE, EGM, and BPNN methods and establish a mapping relationship model between product form and user emotions. Through this method, the study aims to develop a manual wheelchair design solution that can meet the emotional needs of users, provide a scientific basis for product design, and provide valuable references for user-centered product design and manufacturing.
LITERATURE REVIEW
Obtaining Product Attractiveness KE was proposed to solve the problem of transforming Kansei vocabulary into product design parameters (Nagamachi, 1995), which involves transforming human perception, emotional feelings, and psychological imagery into tangible product features (Jiao et al., 2006). KE was first developed in Japan as a consumer-oriented product design technology that combines emotion and engineering (Nagamachi, 2002). “Kansei” is a Japanese term for sensibility, impression, and emotion (Nagamachi, 1995). Through KE technology, researchers can apply users’ emotional needs for products to the product optimization design process and design product solutions that meet people’s emotional needs. Japanese scholar Masato Ujikawa proposed that Miryoku Engineering design attractive products based on consumer preferences (Chen and Lee, 2018; Nagamachi, 2002).
Form Design of Manual Wheelchair Products Based on Evaluation Grid Method 197
Attraction refers to the positive factors that attract consumers to a product, carrying users’ demands for various aspects of the product. The EGM is an effective method proposed by Japanese scholar Junichiro Sanuiand to identify product attractiveness factors (Kelly, 1955). EGM discusses individual similarities and differences through personal interviews and paired comparisons to summarize their personality traits. In the pairing comparison step, people are asked to answer what they like or dislike. Then, based on their answers, use supplementary questions to clarify the meaning or conditions. In this step, the user’s perception of the product in fuzzy information can be logically organized and compiled into a three-layer structure diagram (Lu et al., 2023), including abstract evaluation items, original evaluation items, and concrete evaluation items. EGM has been applied to product form design issues (Wang and Zhou, 2020). Therefore, this study used EGM to analyze the attractiveness factors of existing manual wheelchair products.
Artificial Intelligence Algorithms in Emotional Data Processing In recent years, AI algorithms have been widely applied in user research and sentiment computing, mainly playing an important role in explaining user trust and attitudes (Shin, 2021). Artificial neural networks (ANN), as a type of AI algorithm, have attracted attention for their ability to mimic the human brain’s processing of information, especially in understanding and analyzing complex problems through judgment learning, to solve problems (Tang et al., 2013). Compared with traditional linear methods, ANN algorithms exhibit excellent fault tolerance performance, especially in revealing nonlinear relationships between variables (Liu et al., 2018). Three- layer BPNN, as a commonly used ANN algorithm, is favored for its efficient performance in predicting user perception (Fan et al., 2014). BPNN is a multi- layer feedforward network trained on the error back-propagation algorithm proposed by Rumelhart and McClelland. The model structure of the input, hidden, and output layers simulates the human learning process. It establishes a nonlinear mapping relationship between user emotional needs and product design features (Chen, 2024). Lin et al. (2022) successfully applied BPNN to explore the emotional imagery conveyed by the sound of electric shavers. Xu et al. (2024) combined BPNN and KE to develop a clothing style design model based on user Kansei image cognition. Therefore, this study used BPNN to construct the mapping relationship between the design elements of manual wheelchair form and Kansei imagery. Through this method, we can better understand users’ emotional needs and perceptions towards manual wheelchair products, thereby promoting innovation and optimization in product design.
METHOD
This study combines qualitative and quantitative modeling methods to construct a mapping model between the design elements of the manual wheelchair form and the user’s Kansei imagery. The research process is as follows: Firstly, the user’s attractiveness factors for manual wheelchair
products are obtained through the EGM method, and key emotional adjectives are extracted from them. Based on the results of EGM, combined with the morphological analysis method, the key design elements of manual wheelchair products will be determined. Secondly, a questionnaire was designed using the SD method to collect users’ Kansei evaluation data on manual wheelchair products to establish an evaluation matrix between design elements and Kansei imagery. Then, BPNN will construct a mapping model between the design elements of the manual wheelchair form and Kansei imagery. Finally, the accuracy of the BPNN model is measured by calculating the MSE to verify the feasibility and effectiveness of the BPNN prediction model.
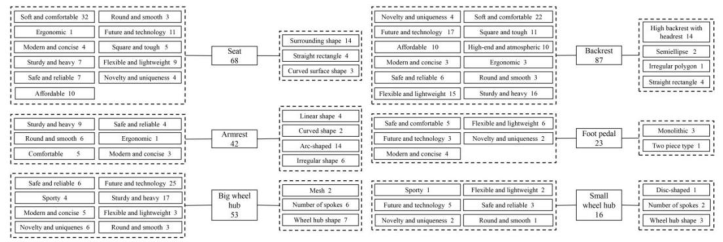
Analysis of Attractiveness Factors Firstly, 234 wheelchair product sample images were collected through various channels such as online shopping platforms, official wheelchair brand websites, and design websites. After screening and removing images with pixel blurring and similar shapes, 20 representative wheelchair product samples were ultimately selected. For the uniformity and comparability of the experiment, the selected representative sample images were decolorized using PS software for easy observation by subsequent subjects. Considering that the EGM interview experiment requires in-depth interviews and takes a long time, it is unsuitable for large-scale investigations (Reynolds and Gutman, 1984). Therefore, this study invited six experts to conduct one-on- one interviews with representative sample images. The interviewees include 3 males and 3 females, aged 24 to 38. Based on the EGM method, 344 upper- level abstract emotional preferences, 289 middle-level original design items with specific attractiveness, and 92 lower-level specific design elements were obtained for wheelchair samples. Finally, using the KJ (Ohiwa et al., 1997) method, similar Kansei factors and design elements were simplified and merged, resulting in 13 upper-level evaluation items, 6 middle-level evaluation items, and 16 lower-level evaluation items. Thus, a complete evaluation grid diagram is established (see Figure 1). Figure 1 shows the correspondence between user emotional preferences and wheelchair design elements, providing a foundation for subsequent model construction.
Figure 1: Evaluation grid of manual wheelchair.
Form Design of Manual Wheelchair Products Based on Evaluation Grid Method 199
Extraction of Kansei Words In this study, based on the EGM method, 13 upper-level evaluation items were extracted from expert interviews, including soft and comfortable (64), future and technology (61), sturdy and heavy (49), safe and reliable (41), flexible and lightweight (35), affordable (20), modern and concise (19), smooth and rounded (16), square and tough (16), novelty and uniqueness (18), high-end and atmospheric (10), ergonomic (5), and sporty (5). Based on the frequency of Kansei adjectives mentioned by experts, six representative Kansei adjectives have been further identified that can reflect users’ core emotional needs for manual wheelchair products: comfortable (K1), technological (K2), sturdy (K3), safe (K4), lightweight (K5), and affordable (K6).
Decomposition of Product Form Elements In this study, based on the EGM method, the mid-level primitive attraction factors were extracted as key components of the manual wheelchair product. To analyze the product design form of manual wheelchairs in-depth, the form analysis method can be used to decompose the wheelchair form elements into the following six main parts: the seat, backrest, armrest, foot petal, big wheel hub, and small wheel hub. Each design element is subdivided into multiple design categories, including 6 design elements and 25 design categories, and encoded (see Table 1).
Table 1: Categories of design elements.
Table available in the original PDF paper.
Elements Categories
1 2 3 4 5 6 7
Seat (X1)
Backrest (X2)
Irregular multilateral type
Armrest (X3)
Irregular type
No armrest
Foot petal (X4)
Big wheel hub (X5)
Small wheel hub (X6)
Semantic Difference Evaluation This study utilized the SD method in KE to design a survey questionnaire. A 7-point Likert scale was used to associate 6 Kansei adjectives with 20 representative samples to evaluate the Kansei imagery of manual wheelchair products. On the scale, 1 point indicates “very inconsistent”, 7 indicates “remarkably consistent”, and the middle is a transitional term. The study invited 42 design graduate students to participate in the SD evaluation, including 21 males (average age of 27.5 years) and 21 females (average age of 26.95 years). The participants’ preferences for various design elements were determined by analyzing the evaluation results, and the final survey results were organized into a Kansei evaluation matrix (see Table 2). The highest value of the comprehensive evaluation (CE) value is 4.496 for sample 3, and the lowest is 3.833 for sample 15. Further analysis revealed that sample 3 has the best combination of shape optimization design categories, namely X12+X23+X35+X42+X53+X62. In addition, to ensure the reliability of statistical data, this study conducted a reliability analysis on the questionnaire. Cronbach’s α value is an important indicator for measuring the reliability of a questionnaire. The analysis results show that the Cronbach’s α value is 0.936. A value significantly higher than the acceptable threshold of 0.7 indicates satisfactory reliability or internal consistency of the questionnaire (Taber, 2018). Therefore, the questionnaire results of this study demonstrate reasonable reliability.
Table 2: Kansei evaluation matrix.
Table available in the original PDF paper.
Samples X1 X2 X3 X4 X5 X6 K1 K2 K3 K4 K5 K6 CE Value
Building a BPNN Prediction Model To explore the mapping relationship between the design elements of manual wheelchair form and Kansei imagery, this study uses the BPNN algorithm to construct a mapping model between the two. In this study, the form design elements of 20 manual wheelchairs were encoded as independent
Form Design of Manual Wheelchair Products Based on Evaluation Grid Method 201
variables, and the Kansei image comprehensive evaluation value was used as the dependent variable (see Table 2) to form a Kansei evaluation matrix, which was input into BPNN for training. Training of BPNN algorithm based on Matlab R2022a software platform.
Step 1. Determine the number of nodes. The number of input layer nodes in the manual wheelchair BPNN model is determined to be the total number of design categories 25, and the number of output layer nodes is the comprehensive evaluation value of Kansei imagery 1. Therefore, the number of hidden layer nodes is determined to be 14 through equation (1).
Equation reproduced from the original PDF.
Among them, H is the number of hidden layer nodes, M is the number of input layer nodes (number of design features), N is the number of output layer nodes (number of intuitive vocabulary), and a is an integer between 0 and 10.
Step 2. Data normalization processing. The output parameters must be limited within the range of [0,1], and the sensory evaluation data needs to be normalized. This study used the minimax method to normalize the input- output variables. The specific calculation formula is shown in equation (2). The normalized data can be input into the BPNN model for training and analysis.
(2)
Xα = Xα −Xmin Xmax −Xmin
Step 3. Train the BPNN model. BPNN is usually trained using the Trainlm algorithm, an optimization algorithm that utilizes gradient descent to minimize the network’s error function. The transfer functions of the input layer and hidden layer are ultimately determined as the Sigmoid function and pure function, and their mathematical expressions are shown in the formula (3).
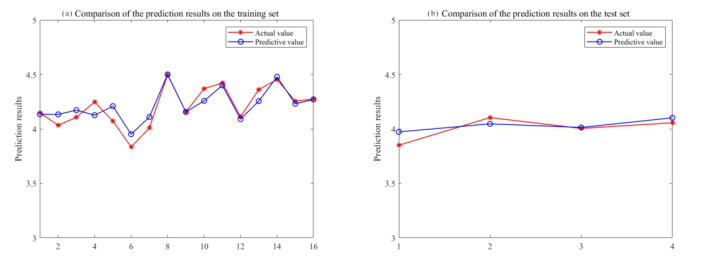
f(x) = 1 1 + e−x (0 < f(x) < 1) (3) The Sigmoid function can compress the input value into the [0,1] interval. In contrast, the pure function is used as a linear function in the output layer to output unconstrained actual values. Use the data from Table 2 and input it into BPNN for training. Randomly select 16 out of 20 samples as the training set and the remaining 4 schemes as the testing set. During the training process, the training frequency is set to 1000, the learning rate to 0.01, and the minimum training error value to 0.000001. Train using the Trainlm gradient descent function. After multiple iterations, the model achieved good convergence on the training set. The comparison curve between the predicted results of the training set and the actual values (see Figure 2 (a)). The comparison curve between the predicted results of the test set and the actual values (see Figure 2 (b)).
Figure 2: Prediction results of the training set (a) and the test set (b).
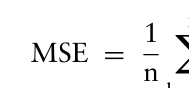
Step 4. Evaluate the performance of BPNN. As shown in formula (4), MSE was used as the test metric to evaluate the BPNN model’s predictive performance.
n X
Equation reproduced from the original PDF.Equation reproduced from the original PDF.
In the formula, xi is the output value of the i-th sample; x0 is the actual value evaluated by the subjects in the experiment. MSE measures the average square of the difference between predicted and actual values. If the MSE value of the neural network is less than 0.01 or even lower, it indicates that BPNN can be used for prediction, judgment, and inference. By comparing the comprehensive evaluation results of Kansei imagery with the output layer values of the established BPNN model, the measurement result values can be calculated using equation (4). The MSE of the training set is 0.0061179, and the MSE of the testing set is 0.0051367. The MSE of the training and testing sets is less than 0.01, indicating that the manual wheelchair BPNN model has a good fitting effect and feasibility. The predicted and actual values of the test set are shown in Table 3.
Table 3: Comparative analysis of model prediction results for the test set.
Table available in the original PDF paper.
Test Set Predicted Values Actual Values Test1 3.972 3.849 Test2 4.046 4.103 Test3 4.013 4.004 Test4 4.102 4.056
RESULTS AND DISCUSSION
This study establishes a nonlinear mapping model by combining EGM and BPNN techniques to address the limitations of qualitative relationship analysis in traditional KE methods. Firstly, 13 higher-level abstract Kansei factors were extracted from user interviews through EGM, expressing users’ attraction and emotional experience toward the design of manual wheelchairs. Based on the frequency of respondents mentioning emotional adjectives, six key Kansei factors were identified: comfortable (64), technological (61), sturdy (49), safe (41), lightweight (35), and
Form Design of Manual Wheelchair Products Based on Evaluation Grid Method 203
affordable (20). The results indicate that users attach great importance to the user experience of manual wheelchairs, with comfort being the core of product design. Secondly, wheelchair designs with a sense of technology easily attract users’ attention, and designers should prioritize these emotional preferences in innovative design. Security performance is another important factor that users are concerned about. In addition, users are also concerned about factors such as the stability, weight, and price of the wheelchair. Therefore, users prefer wheelchairs with technological design styles, affordable prices, stable performance, and safe and comfortable features. This study evaluated the attractiveness factors of manual wheelchair design in the market and investigated the mapping relationship model between users’ Kansei imagery and wheelchair design elements. The best Kansei evaluation combination was selected from 20 wheelchair samples as sample 3, the combination of X12+X23+X35+X42+X53+X62. This study is based on the KE method, which combines BPNN and EGM in artificial intelligence technology to establish a nonlinear mapping function under specific conditions, accurately calculating the mapping relationship between upper-level Kansei images and lower-level specific design elements. Therefore, designers can focus on the attractive factors of user preferences obtained from research results and systematically develop new product development strategies to shorten research time and improve user satisfaction.
CONCLUSION
This study systematically explores the complex relationship between user emotional needs and product design by innovatively integrating KE, EGM, and BPNN. Through this comprehensive approach, not only can we gain a deeper understanding of users’ emotional needs for manual wheelchair products, but we can also provide a scientific basis for design and promote innovation and optimization in product design. Through EGM, this study evaluated the attractiveness factors of manual wheelchair design in the market, providing market-oriented design references for manufacturers. KE’s design approach transforms users’ emotional needs into design elements that designers can adopt, enhancing the pertinence and effectiveness of the design. Through the application of BPNN, this study has made product design more scientific, improving the accuracy and predictability of the design process. With the rapid development of science, the application scope of BPNN will become more extensive, and it will also achieve more outstanding results in assisting product design. This study not only provides a new perspective for the design of manual wheelchairs but also offers a new approach that combines traditional KE methods with modern artificial intelligence technology for the Kansei design and evaluation of other products. Through this method, designers can gain a deeper understanding of user needs and create more attractive products that meet their emotional needs.
REFERENCES
Chen, Z. (2024). An Elderly-Oriented Design of HMI in Autonomous Driving Cars Based on Rough Set Theory and Backpropagation Neural Network. IEEE Access 12, 26800–26818.
Chen, Y. L., Lee, Ing. T. (2018). Developing Automatic Form and Design System Using Integrated Grey Relational Analysis and Affective Engineering. Applied Sciences 8, 91. Fan, K. K., Chiu, C. H., Yang, C. C. (2014). Green technology automotive shape
design based on neural networks and support vector regression. Eng. Comput. 31, 1732–1745. Ho, C. H., Hou, K. C. (2015). Exploring the Attractive Factors of App Icons. KSII Transactions on Internet and Information Systems 9, 2251–2270. Jiao, J. (Roger), Zhang, Y., Helander, M. (2006). A Kansei mining system for affective
design. Expert Systems with Applications 30, 658–673. Kang, X. (2020). Combining Grey Relationship Analysis and Neural Network to Develop Attractive Automobile Booth Design. Comput. Intell. Neurosci. 2020, 8863727. Kelly, G. A. (1955). The Psychology of Personal Constructs Vol. I. Li, Y., Feng, Q., Huang, T., Wang, S., Cong, W., Knighton, E. (2022). A new product
development study using intelligent data analysis algorithm based on KE theory. J. Intell. Fuzzy Syst. 43, 7041–7055. Lin, Z. H., Woo, J. C., Luo, F., Chen, Y. T. (2022). Research on Sound Imagery of Electric Shavers Based on Kansei Engineering and Multiple Artificial Neural Networks. Appl. Sci.-Basel 12, 10329. Liu, X., Gao, J., Li, N., Chen, G., Li, J., 2018. The prediction of horizontal
displacement of retaining and protection structure based on BP neural network. IOP Conference Series Materials Science and Engineering 392, 062087. https:// doi.org/10.1088/1757-899X/392/6/062087 Lu, P., Li, Z., Li, J., Hsiao, S.-W. (2023). A consumer-oriented design thinking model for product design education. Interact. Learn. Environ. 31, 4753–4771. Mattie, J., Aitken-Mundhenk, L., Bicknell, L., Mortenson, W. B., Borisoff, J. (2020).
Exploring the lived experience of people using ultralight wheelchairs with on-the- fly adjustable seating function. Disabil Rehabil Assist Technol 15, 878–884. Nagamachi, M. (2002). Kansei engineering as a powerful consumer-oriented technology for product development. Applied Ergonomics, Fundamental Reviews in Applied Ergonomics 2002 33, 289–294. Nagamachi, M. (1995). Kansei Engineering: A new ergonomic consumer- oriented technology for product development. International Journal of Industrial Ergonomics, Kansei Engineering: An Ergonomic Technology for product development 15, 3–11. Ohiwa, H., Takeda, N., Kawai, K., Shiomi, A. (1997). KJ editor: A card-handling
tool for creative work support. Knowledge-Based Systems 10, 43–50. Quan, H., Li, S., Wei, H., Hu, J. (2019). Personalized Product Evaluation Based on GRA-TOPSIS and Kansei Engineering. Symmetry-Basel 11, 867. Reynolds, T., Gutman, J. (1984). Advertising is image management. Journal of
Advertising Research 24, 27–37. Shin, D. (2021). The effects of explainability and causability on perception, trust, and acceptance: Implications for explainable AI. International Journal of Human- Computer Studies 146, 102551. Taber, K. S. (2018). The Use of Cronbach’s Alpha When Developing and Reporting
Research Instruments in Science Education. Res. Sci. Educ. 48, 1273–1296. Tang, C. Y., Fung, K. Y., Lee, E. W. M., Ho, G. T. S., Siu, K. W. M., Mou, W. L.
(2013). Product form design using customer perception evaluation by a combined superellipse fitting and ANN approach. Advanced Engineering Informatics 27, 386–394.
Form Design of Manual Wheelchair Products Based on Evaluation Grid Method 205
Wang, M., Cheng, X., He, Z. (2022). Research on Multiple Affective Responses Design of Product Based on Kansei Engineering and TOPSIS-AISM. Mathematical Problems in Engineering 2022, e6945986. Wang, T., Yang, L. (2023). Combining GRA with a Fuzzy QFD Model for the New
Product Design and Development of Wickerwork Lamps. Sustainability 15, 4208. Wang, T., Zhou, M. (2020). A method for product form design of integrating interactive genetic algorithm with the interval hesitation time and user satisfaction. International Journal of Industrial Ergonomics 76, 102901. Woo, J. C., Luo, F., Lin, Z. H., Chen, Y. T. (2022). Research on the Sensory Feeling
of Product Design for Electric Toothbrush Based on Kansei Engineering and Back Propagation Neural Network. Journal of Internet Technology 23, 863–871. Wu, M. Y., Chen, Y. H. (2022). Factors affecting consumers’ cognition of food photos using Kansei engineering. Food Sci. Technol. 42, e38921. Xu, H., Ren, R., Chen, H. (2024). Research on T-shirt-style design based on Kansei
image using back-propagation neural networks. AUTEX Research Journal 24. Yang, C., Liu, F., Ye, J. (2023). A product form design method integrating Kansei engineering and diffusion model. Advanced Engineering Informatics 57, 102058. Yang, H., Zhang, J., Wang, Y., Jia, R. (2021). Exploring relationships between design
features and system usability of intelligent car human–machine interface. Robotics and Autonomous Systems 143, 103829.
LISTED IN THE AHFE DIGITAL BOOKSTORE CATALOGUE
Explore the complete digital volume
Ergonomics In Design and Kansai Engineering
Read this individual research paper free through the original publisher, or explore the full digital proceedings book.
ISBN 978-1-964867-46-5
Explore this ISBN in the AHFE Bookstore ↗Listed in the July 2026 bookstore catalogue; search by ISBN to confirm current availability · Digital book purchase optional