Jungkwon Kim, Sangmin Kim, Jungi Lee, Kwangsun Yoo, Seokjoo Byun (2025). CRNSim: A New Similarity Index Capturing Global and Local Spectral Differences in Hyperspectral Data. In: Human Interaction and Emerging Technologies (IHIET-AI 2025): Artificial Intelligence and Future Applications. AHFE Open Access, vol. 161, pp. 311–321. https://doi.org/10.54941/ahfe1005923
Hyperspectral imaging (HSI) enables detailed spectral analysis across numerous bands, offering transformative potential in diverse domains such as remote sensing, agriculture, and medical diagnostics. However, the inherent challenges of inter-class similarity, intra-class variability, and limitations in existing similarity metrics hinder its effectiveness. To address these challenges, we propose CRNSim, a novel similarity index that integrates three complementary components: a Chebyshev-based term to capture extreme spectral deviations, a RMSE-based term to account for global spectral trends, and a nonlinear adjustment factor to enhance sensitivity to subtle variations while mitigating outlier influence. Experimental evaluations on benchmark hyperspectral datasets, including Indian Pines and Salinas Valley, demonstrate the superiority of CRNSim in improving inter-class separability, outperforming traditional metrics such as Chebyshev and RMSE. These findings highlight CRNSim’s potential to advance HSI analysis methodologies, making it a robust tool for fine-grained spectral differentiation across diverse applications.
Hyperspectral imaging (HSI) has emerged as a transformative technology in fields such as remote sensing (Pour et al., 2021; Wang et al., 2022), agriculture (Agilandeeswari et al., 2022; Wang et al., 2023), and medical diagnostics (Hao et al., 2021; Tsai et al., 2021), providing rich spectral information at the pixel level across hundreds of contiguous bands. This unique capability allows for the detailed characterization of materials and the extraction of intricate spectral patterns. However, the analysis of hyperspectral data is inherently challenging due to its high-dimensional nature, significant inter-class similarity, and pronounced intra-class variance. These factors necessitate the development of robust and generalizable methods to quantify spectral dissimilarity effectively.
The selection of a suitable similarity index plays a critical role in HSI analysis, directly impacting classification accuracy, clustering interpretability, and computational efficiency. Existing distance metrics, such as Euclidean distance (Gower, 1985), cosine similarity, and the Spectral Angle Mapper
(SAM) (Kruse et al., 1993), have been extensively applied due to their simplicity and effectiveness.
However, these metrics often fall short in capturing the complex spectral relationships within hyperspectral datasets. For instance, Euclidean distance primarily measures overall spectral differences but lacks sensitivity to the subtle differences between spectra, which limits its ability to capture the nuanced relationships present in hyperspectral data. Conversely, SAM focuses primarily on angular differences, offering robustness to illumination changes but neglecting amplitude information, which is often critical for accurate material differentiation (Vishnu et al., 2013).
Similarly, the Chebyshev distance, another notable metric, has demonstrated effectiveness in emphasizing extreme spectral deviations. Unlike Euclidean distance and SAM, the Chebyshev distance is sensitive to the largest individual differences in spectral bands, making it particularly useful for identifying outliers or extreme variations within the data. However, its reliance on maximum differences can limit its applicability in scenarios requiring the analysis of overall spectral trends or subtle variations. RMSE, on the other hand, excels in capturing global spectral trends and average differences, providing a straightforward measure of dissimilarity. Nevertheless, RMSE may underperform in hyperspectral contexts, as it can overemphasize global differences while failing to account for localized or extreme spectral variations critical for distinguishing subtle material differences. These limitations in existing metrics stress the necessity for a more integrated approach to spectral similarity measurement, capable of addressing the multifaceted nature of hyperspectral data.
To address these limitations, we propose a novel similarity index that integrates three complementary components into a unified framework for spectral similarity measurement: (1) a Chebyshev-based term to capture extreme spectral deviations, (2) an RMSE-based term to evaluate global spectral trends, complementing the Chebyshev term by accounting for overall consistency in spectral distributions; and (3) a nonlinear adjustment factor designed to enhance sensitivity to subtle spectral variations and mitigate the influence of outliers.
Through experimental evaluations on publicly available hyperspectral datasets, the proposed index demonstrates significant improvements in inter- class separability compared to traditional metrics. By addressing both global and local spectral features, this work contributes to advancing HSI analysis methodologies and broadening their applications in real-world scenarios.
RELATED WORKS Spectral Library Search Algorithms
Measuring spectral similarity is a cornerstone of HSI analysis, with methods broadly categorized into stochastic and deterministic measures (Nidamanuri and Zbell, 2011; Vishnu et al., 2013). Stochastic approaches leverage statistical properties of spectral data, employing metrics such as divergence, entropy, and probabilistic models to capture spectral variability (Chang, 1999; 2000). These methods excel in handling complex distributions but
CRNSim: A New Similarity Index Capturing Global and Local Spectral Differences 313
often demand substantial computational resources and domain-specific parameter tuning, which limits their broader applicability.
In contrast, deterministic approaches focus on direct comparisons between spectral signatures. Metrics such as SAM, Euclidean distance, and correlation (De Carvalho and Meneses, 2000) are widely used, each with distinct advantages. SAM, for instance, is valued for its robustness to illumination variations, enabling effective comparisons under varying lighting conditions. On the other hand, Euclidean distance captures absolute differences between spectral values, making it useful for applications where the magnitude of reflectance is critical. However, these deterministic measures frequently struggle to adapt to diverse spectral characteristics, often resulting in suboptimal performance in scenarios with overlapping classes or high spectral noise levels.
Modifications and Hybrid Approaches The inherent complexity of hyperspectral datasets often necessitates tailored algorithms designed to address specific applications (Rivard et al., 2008; Griffiths et al., 2009). Hence, researchers have explored integrating multiple algorithms into unified frameworks. This approach leverages the complementary strengths of various metrics, enhancing both the reliability and precision of material identification across diverse hyperspectral contexts. Building on these efforts, significant advancements have been made in refining existing metrics to better address the challenges. Hybrid strategies that combine deterministic and stochastic measures have demonstrated improved performance (Padma and Sanjeevi, 2014). For example, hybrid methods such as the Spectral Information Divergence (SID)- based approaches, have gained attention for their ability to leverage the complementary strengths of different metrics. Notably, SID-SAM (Du et al., 2004) integrates SID with angular metrics through trigonometric functions like tangent and sine. Another notable example, the SID-Spectral Correlation Angle (SID-SCA) (Kumar et al., 2011), merges SID with correlation-based metrics to enhance the discrimination of subtle spectral variations, such as crop types. These methods emphasize the value of hybrid strategies in improving spectral similarity measurement but also point to the need for continued refinement, particularly in terms of spectral separability and adaptability to a wide range of hyperspectral data.
THE PROPOSED SIMILARITY SCORE INDEX Preliminaries
The foundation of our proposed similarity score index lies in distance metrics, which provide a unified framework for evaluating spectral similarity and dissimilarity across various measures. To establish a rigorous basis for this index, we first define a metric space over Euclidean spaces. Let x = [xi]n
i = 1 ∈Rn represents a vector in n-dimensional Euclidean space, and {xi} denotes the sequence of elements of the vector x indexed by i. The standard properties of metric spaces are as follows:
Definition 1. A metric space M ⊂Rn equipped with a distance function δ : M × M →[0, ∞) satisfies
Equations and mathematical formulas are available in the original paper PDF.
x, y
Reflexivity: δ
x, y
Symmetry: δ
x, y
y, x
for all x, y ∈M.
Triangle inequality: δ
x, y
z, y
for all x, y, z ∈M.
It is well known that lp spaces, defined on Rn, are metric spaces equipped with the lp-norm defined as
p
! 1
|xi|p
To ensure mathematical precision in subsequent discussions, we formally define the max functions as follows:
n
i = 1 be sequences of real numbers and a, b ∈Rn be vectors, with their i-th elements denoted by ai, bi, respectively.
n
max
max
a, b
ai, bi
The maximum value across both sequences is
max
max
ai, bi
To quantify spectral similarity and dissimilarity across n bands, commonly used metrics such as Cosine similarity, Manhattan, Euclidean, Chebyshev, Canberra (Lance and Williams, 1966), Chi-square, and Jeffrey distances (Jeffreys, 1946) are employed. Each metric offers distinct properties that influence inter-class separability, a crucial aspect for classification and clustering tasks. Let µ, ν ∈ Rn represent spectral data for classes M and N, with µ (i) and ν(i) denote the i-th components of µ and ν, respectively. The formulas for these metrics are then given as follows: δcos (µ, ν) = µ · ν ∥µ∥l2 ∥µ∥l2 , δlp (µ, ν) = ∥µ −ν∥lp ,
(µ(i) −ν(i))2
|µ(i) −ν(i)| X
X
µ(i) + ν(i) ,
i
i
X
(µ(i) −ν(i)) log (µ(i))/(ν(i))
Depending on the chosen metric, the interpretation of distance values can vary. For example, in lp distances (such as Manhattan (p = 1), Euclidean (p = 2), and Chebyshev (p = ∞) distances), larger values represent greater dissimilarity, whereas metrics like cosine similarity interpret larger
CRNSim: A New Similarity Index Capturing Global and Local Spectral Differences 315
values as indicating higher similarity. Additionally, different metrics produce distance values on varying scales, as demonstrated in the above definitions. This variability necessitates a standardized similarity score that adheres to a common scale, ensuring more consistent and meaningful comparisons.
Based on these observations, we introduce similarity score indices mapping distance values to a common range [0, 1]. For metrics other than cosine similarity, the similarity score S is defined as S = 1− δ δmax . Here, δ represents the computed distance, and δmax denotes the properly designed maximum distance across all spectrum bands. For cosine similarity, the similarity score is identical to the computed distance, Scos (µ, ν) = δcos (µ, ν) .
Mathematical Formulation The complete definition of similarity score indices for the remaining metrics from δlp to δJef are defined as follows:
µ −ν max {µ, ν}
n · max
µ(i) µ(i) + ν(i), ν(i) µ(i) + ν(i) i δχ2 (µ, ν)
o,
n/2 · max
n · max
(µ(i) −ν(i)) log (µ(i))/(ν(i)) i For SArea (µ, ν), we introduce the relative area index as a variation derived from lp distances, providing an alternative way to interpret spectral data based on its relative area. By adopting these similarity score indices, we lay the groundwork for an improved framework in HSI analysis, mitigating biases caused by differences in metric scales.
Based on the similarity score indices defined above, we propose a new similarity index, SCRN, which combines three distinct terms with constraints α + β + γ = 1 and 0 ≤α, β, γ ≤1 as follows:
log (1+ |µ −ν|) log (1+ max {µ, ν})
l2.
This formulation unifies complementary components into a single framework. Each term addresses specific challenges in hyperspectral image analysis: the Chebyshev-based term (Sl∞) captures extreme spectral deviations, the RMSE-based term (SRMSE) evaluates overall spectral trends, and the nonlinear adjustment factor (N (µ, ν)) enhances sensitivity to subtle variations while mitigating outlier effects. The index’s design aims to balance precision in subtle spectral differentiation with robustness in noise-prone datasets. To demonstrate the practical effectiveness of SCRN, the subsequent section presents a detailed evaluation using public hyperspectral datasets. These experiments validate the index’s capability to improve inter-class separability, showcasing its advantages over existing metrics used in diverse spectral analysis tasks.
EXPERIMENTS In this section, we investigate the performance of the proposed similarity index across diverse hyperspectral datasets. The focus is to evaluate the ability of the index to capture spectral differences, addressing challenges posed by each independent similarity index included in ours. While there are various methods for determining the weights α, β and γ , we set them to 0.3, 0.5, and 0.2, respectively, and present the results of experiments conducted with these values.
Datasets Indian Pines (IP) Dataset Acquired using the Airborne Visible/Infrared Imaging Spectrometer (AVIRIS) sensor, the Indian Pines (IP) dataset comprises 224 spectral bands and represents agricultural fields with 16 distinct classes. The dataset is particularly challenging due to the subtle spectral variations among classes, which complicates the task of distinguishing them based on spectral similarity.
Salinas Valley (SV) Dataset This dataset, captured by the 224-band AVIRIS sensor over Salinas Valley, California, offers high spatial resolution with 3.7-meter pixels. Covering an area of 512×217 pixels, it represents diverse land types classified into 16 distinct categories. To enhance data quality, 20 water absorption bands ([108–112], [154–167], 224) were excluded from the analysis.
University of Pavia (UP) Dataset This dataset was acquired using the Reflective Optics System Imaging Spectrometer (ROSIS-3) sensor, capturing 610×340 pixels across 103 spectral bands. This dataset is particularly valuable for evaluating distance metrics in scenarios where inter-class separability is more pronounced, such as in urban environments.
For each dataset, the mean spectrum is calculated by averaging the spectral signatures of all pixels within a class. This mean spectrum serves as a representative profile, facilitating an inter-class comparison of spectral
CRNSim: A New Similarity Index Capturing Global and Local Spectral Differences 317
distributions. We compute similarity scores for all pairs of class mean spectra using the proposed similarity index and other benchmark indices as introduced in the previous section.
Results
Table 1. Average similarity scores across similarity indices and datasets.
As shown in Table 1, the proposed index achieves the lowest mean similarity scores across all three datasets, demonstrating its superior inter- class separability.
This consistent distinction outperforms traditional indices, such as the Chebyshev index, which exhibit higher mean similarity scores. While the proposed index has a relatively larger standard deviation, this indicates its ability to capture a broader range of spectral differences—a critical factor in hyperspectral image analysis.
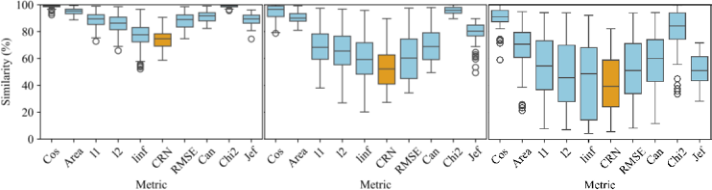
However, Figure 1 presents the boxplot analysis, which provides further insight into the performance of the proposed index. Compared to traditional indices like Chebyshev or RMSE, the IQR for the proposed index is smaller, indicating that the inter-class similarity scores are more consistently distributed. The reduced IQR suggests that the proposed index effectively minimizes extreme variability, allowing for more stable and reliable class separation.
Figure 1: Boxplots for three hyperspectral datasets – IP, SV, and UP.
The boxplots also reveal that the proposed index exhibits shorter whiskers in all datasets, than other indices showing low Q2 values. This indicates its stability in handling diverse spectral characteristics without being excessively influenced by outliers. Overall, the proposed index achieves a strong balance between inter-class separability and resilience to outliers, making it a reliable and adaptable tool for hyperspectral image analysis.
DISCUSSION
Our future work will focus on optimizing the weights α, β and γ in the proposed similarity index to enhance its adaptability across diverse HSI applications. While the current study demonstrates the index’s effectiveness with a fixed weighting scheme, domain-specific optimization could further improve its performance. For example, in agricultural applications, greater emphasis on the nonlinear adjustment term could enhance sensitivity to subtle crop differences, while urban land-use classification might benefit from prioritizing the Chebyshev-based term to highlight extreme spectral deviations.
Additionally, the development of a dynamic weighting mechanism that adapts to the spectral and spatial properties of datasets represents an exciting direction for future research. Leveraging machine learning techniques and domain adaptation strategies, such approaches could ensure robust and generalizable performance across varied HSI contexts. Integrating these optimizations would enhance the index’s ability to distinguish between classes and maintain consistency within classes, addressing the complexities of HSI more effectively.
Influence of Weighted Components on Similarity Score Given that different datasets exhibit unique spectral characteristics, careful adjustment of the weights is essential to optimize the performance of the proposed similarity index. To facilitate this adjustment, it is important to understand the relative influence of each component in the index. While the optimization of the weights α, β and γ for specific datasets remains a subject for future research, we provide a theoretical foundation for this process by examining the mathematical impact of each weight on the overall similarity score, SCRN(µ, ν). This analysis offers valuable insight into the sensitivity of the similarity measure to changes in the individual components, guiding future efforts to fine-tune the weights for various spectral characteristics.
To further elaborate, we focus on comparing the relative sensitivities of the similarity measure to the β-weighted RMSE term and the γ -weighted nonlinear adjustment term. By mathematically comparing their effects on the overall similarity score, we aim to highlight how the impact of the γ term can often be more pronounced than the β term under certain conditions, even when both weights are equal. This is because the nonlinear term (γ ) captures more subtle spectral variations that RMSE (β) may miss, even in cases of complex spectral distributions.
CRNSim: A New Similarity Index Capturing Global and Local Spectral Differences 319 Proposition 1. Let µ, ν ∈Rn be n-dimensional spectral vectors for class m and n, respectively. Then we see
<
δ M
log(1 + δ) log (1+M)
l2 <
l2 .
i = 1 and M = max {µ, ν}. Using these and the definition of SCRN, the inequality above can be written as To prove this, it suffices to show
δ(i) M(i) < log (1 + δ(i))
log (1 + M(i)) for all M (i) , δ (i) > 0. We note that the function log(1 + x)
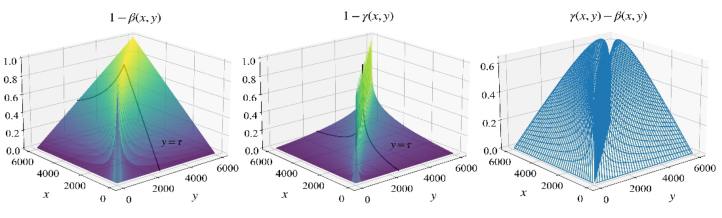
x decreases for x > −1 and M (i) > δ (i) > 0 for all spectral data since µ (i) , ν (i) are positive. Hence, the last inequality in the above is satisfied for all M (i) , δ (i) > 0. □ In Figure 2, we illustrate visualizations using representative functions, β(x, y) and γ (x, y), defined as
x −y
1 + x −y
β
x, y
x, y
, γ
max
x, y
log(1+max
x, y
Figure 2: 3D plots of 1 −β(x, y), 1 −γ (x, y), and their difference.
These functions approximate the behavior of the similarity score components SRMSE and N respectively and provide conceptual insight into how variations in the spectral data µ, ν influence the similarity index. While not direct computations of SRMSE or N, they serve as proxies to illustrate the relationship outlined in the inequality given in Proposition 1.
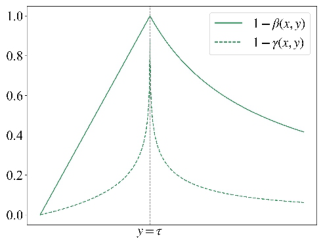
The graphical analysis allows us to directly interpret Proposition 1, in a sense that γ leads to more sensitive adjustments in the similarity score compared to β, further emphasizing the greater impact of the nonlinear adjustment term in certain spectral contexts. Furthermore, the curves of the element contained in SRMSE and N for the fixed spectrum ν is given in Figure 3 which also supports Proposition 1.
Figure 3: Graphs of two functions 1 −β(x, y) and 1 −γ (x, y) for fixed value y = τ.
CONCLUSION
This study addresses critical challenges in hyperspectral image (HSI) analysis by introducing CRNSim, a novel similarity index designed to capture both global and local spectral differences. By integrating Chebyshev-based, RMSE- based, and nonlinear adjustment components, CRNSim achieves a balanced approach to spectral analysis, enhancing its ability to differentiate between subtle material variations. Experimental results on benchmark datasets confirm its effectiveness in improving inter-class separability, outperforming traditional metrics such as Chebyshev and RMSE. While CRNSim demonstrates significant promise, future research will focus on optimizing its weighting parameters (α, β, γ ) to better adapt to specific domain applications. For example, agricultural applications may benefit from emphasizing nonlinear adjustments, while urban land-use classification may prioritize Chebyshev-based components. Furthermore, dynamic weighting mechanisms using machine learning and domain adaptation strategies could further improve its adaptability and robustness. These advancements would solidify CRNSim as a versatile tool for hyperspectral analysis across diverse applications, offering new opportunities for precision material identification and spectral pattern recognition.
REFERENCES
Agilandeeswari, L., Prabukumar, M., Radhesyam, V., Phaneendra, K. L. N. B.
and Farhan, A. (2022). Crop classification for agricultural applications in hyperspectral remote sensing images, Applied Sciences Volume 12, No. 3. Chang, C. (1999). Spectral information divergence for hyperspectral image analysis, In IEEE 1999 International Geoscience and Remote Sensing Symposium Volume 1. Chang, C. (2000). An information-theoretic approach to spectral variability, similarity, and discrimination for hyperspectral image analysis, IEEE Transactions on Information Theory Volume 46, No. 5. De Carvalho, O. and Meneses, P. (2000). Spectral correlation mapper (SCM): An
improvement on the spectral angle mapper (SAM), In Summaries of the 9th JPL Airborne Earth Science Workshop Volume 9. Du, Y., Chang, C.-I., Ren, H., Chang, C.-C., Jensen, J. O., and D’Amico, F. M. (2004).
New hyperspectral discrimination measure for spectral characterization, Optical Engineering Volume 43, No. 8.
CRNSim: A New Similarity Index Capturing Global and Local Spectral Differences 321
Gower, J. (1985). Properties of Euclidean and Non-Euclidean distance matrices, Linear Algebra and its Applications Volume 67. Griffiths, P. R., Shao, L., and Leytem, A. B. (2009). Completely automated open-path
FT-IR spectrometry, Analytical and Bioanalytical Chemistry Volume 393. Hao, Q., Pei, Y., Zhou, R., Sun, B., Sun, J., Li, S., and Kang, X. (2021). Fusing multiple deep models for in vivo human brain hyperspectral image classification to identify glioblastoma tumor, IEEE Transactions on Instrumentation and Measurement Volume 70. Jeffreys, H. (1946). An invariant form for the prior probability in estimation
problems, Proceedings of the Royal Society of London. Series A. Mathematical and Physical Sciences Volume 186, No. 1007. Kruse, F., Lefkoff, A., Boardman, J., Heidebrecht, K., Shapiro, A., Barloon, P., and Goetz, A. (1993). The spectral image processing system (SIPS)—interactive visualization and analysis of imaging spectrometer data, Remote Sensing of Environment Volume 44, No. 2. Kumar, M. N., Seshasai, M. V. R., Prasad, K. S. V., Kamala, V., Ramana, K. V.,
Dwivedi, R. S., and Roy, P. S. (2011). A new hybrid spectral similarity measure for discrimination among vigna species, International Journal of Remote Sensing Volume 32, No. 14. Lance, G. N. and Williams, W. T. (1966). Computer programs for hierarchical polythetic classification (“similarity analyses”), The Computer Journal Volume 9, No. 1. Nidamanuri, R. R. and Zbell, B. (2011). Normalized spectral similarity score
((NS3)) as an efficient spectral library searching method for hyperspectral image classification, IEEE Journal of Selected Topics in Applied Earth Observations and Remote Sensing Volume 4, No. 1. Padma, S. and Sanjeevi, S. (2014). Jeffries Matusita based mixed-measure for improved spectral matching in hyperspectral image analysis, International Journal of Applied Earth Observation and Geoinformation Volume 32. Pour, A. B., Zoheir, B., Pradhan, B., and Hashim, M. (2021). Editorial for the special
issue: Multispectral and hyperspectral remote sensing data for mineral exploration and environmental monitoring of mined areas, Remote Sensing Volume 13, No. 3. Rivard, B., Feng, J., Gallie, A., and Sanchez-Azofeifa, A. (2008). Continuous wavelets for the improved use of spectral libraries and hyperspectral data, Remote Sensing of Environment Volume 112, No. 6. Tsai, C.-L., Mukundan, A., Chung, C.-S., Chen, Y.-H., Wang, Y.-K., Chen, T.-H.,
Tseng, Y.-S., Huang, C.-W., Wu, I.-C., and Wang, H.-C. (2021). Hyperspectral imaging combined with artificial intelligence in the early detection of esophageal cancer, Cancers Volume 13, No. 18. Vishnu, S., Nidamanuri, R. R., and Bremananth, R. (2013). Spectral material mapping using hyperspectral imagery: A review of spectral matching and library search methods, Geocarto International Volume 28, No. 2. Wang, S., Guan, K., Zhang, C., Lee, D., Margenot, A. J., Ge, Y., Peng, J., Zhou, W.,
Zhou, Q., and Huang, Y. (2022). Using soil library hyperspectral reflectance and machine learning to predict soil organic carbon: Assessing potential of airborne and spaceborne optical soil sensing, Remote Sensing of Environment Volume 271. Wang, B., Sun, J., Xia, L., Liu, J., Wang, Z., Li, P., Guo, Y., and Sun, X. (2023). The applications of hyperspectral imaging technology for agricultural products quality analysis: A review, Food Reviews International Volume 39, No. 2.
LISTED IN THE AHFE DIGITAL BOOKSTORE CATALOGUE
Explore the complete digital volume
Human Interaction and Emerging Technologies (IHIET-AI 2025): Artificial Intelligence and Future Applications
Read this individual research paper free through the original publisher, or explore the full digital proceedings book.
ISBN 978-1-964867-37-3
Explore this ISBN in the AHFE Bookstore ↗Listed in the July 2026 bookstore catalogue; search by ISBN to confirm current availability · Digital book purchase optional