Accurate quantification of cognitive load is essential for optimizing human-computer interaction systems. Methods: This study recruited 159 healthy participants and employed a hierarchical n-back task paradigm (0-back to 3-back) to induce graded levels of cognitive load. Multimodal physiological signals, including electroencephalogram (EEG), heart rate variability (HRV), and electrodermal activity (EDA), were recorded simultaneously to construct a cognitive load dataset encompassing three modalities. Temporal and frequency domain features were extracted from EEG signals, temporal and frequency domain parameters from HRV signals, and phase-amplitude integration and SCR frequency from EDA signals. A Kruskal-Wallis test was used to analyze significant differences in physiological indices across different cognitive load levels. Finally, a multiple linear regression model was employed to quantify the contribution of each modality's features to cognitive load classification. Results: (1) A significant suppression of alpha band power in the eyes-open resting state validated the effectiveness of the EEG signal acquisition system; (2) With increasing task difficulty, the alpha and theta power of EEG and the LF value of HRV showed significant monotonic increasing trends (p < 0.05), confirming the sensitivity of multimodal physiological signals to changes in cognitive load; (3) The regression model revealed that EEG features had the highest contribution (β = 0.57). Conclusion: This study proposes a framework for cognitive load quantification based on multimodal feature fusion, providing a theoretical and empirical foundation for the development of high-precision cognitive load assessment models.
The rapid advancement of artificial intelligence and big data technologies has opened new avenues for precise cognitive load assessment through multimodal data fusion. Real-time monitoring and classification of cognitive load hold significant implications for optimizing system design, enhancing human-computer collaboration efficiency, and improving user
experience across domains such as education, healthcare, and intelligent interaction. However, feature alignment and dynamic modeling of multisource heterogeneous data remain central challenges in current research, necessitating interdisciplinary approaches to overcome existing barriers. Cognitive Load (CL), as a core indicator of individual cognitive resource allocation, holds significant research value in neuroscience, psychology, and human-computer interaction. Sweller proposed the Cognitive Load Theory (CLT), emphasizing the limited capacity of human working memory (Sweller, Ayres, & Kalyuga, 2011; Sweller, van Merriënboer, & Paas, 2019). Both excessively high and low cognitive loads can negatively impact task performance. High cognitive load may lead to attention dispersion and increased errors, while low cognitive load may cause fatigue and reduced attention (Mühlbacher-Karrer et al., 2017). Therefore, accurately quantifying cognitive load is crucial for optimizing task design and enhancing system performance.
With the increasing complexity of technology, cognitive load assessment has become a central issue in human-computer interaction and ergonomic design. By quantifying users’ information processing stress, human-computer interaction interfaces can be optimized to reduce operational error rates and prevent health risks associated with mental fatigue (Paas et al., 2016). For example, in driver monitoring systems (DMS), traditional vision-based technologies and detection response tasks (DRT) are widely used to assess drivers’ alertness and cognitive load (Biswas et al., 2016; Duchowski et al., 2019). The widespread application of non-invasive wearable devices also enables real-time monitoring of drivers’ states to ensure traffic safety (Choi et al., 2017). In the aviation field, cognitive load assessment is equally critical. Studies have shown that high cognitive load significantly prolongs pilots’ reaction times and affects their emotional states and decision-making behaviors (Vukovic et al., 2021). Additionally, subjective rating tools such as NASA-TLX are widely used for multidimensional cognitive load assessment (Toy et al., 2020). Therefore, with the prevalence of complex task scenarios, accurately quantifying neural and physiological responses under different cognitive load levels has become key to enhancing the adaptive design of human-machine systems. This research direction not only helps optimize task design but also provides safer solutions for high-risk fields such as driving, aviation, and healthcare (Chan, 2017). Thus, the identification and study of cognitive load hold significant theoretical and practical implications.
Cognitive load measurement can be divided into subjective self- reports, behavioral performance measurements, and physiological and EEG measurements. Traditional measurement methods (e.g., the NASA-TLX scale) are widely used subjective measurement tools that assess perceived cognitive workload in a multidimensional manner (Hart and Staveland, 1988; Park et al., 2018). However, due to subjective bias and lag, they are not used as standalone indicators in current research. Behavioral performance is also a common indicator and method for measuring individual cognitive load. Tasks such as N-back, detection response tasks, Stroop tasks, and multiple-object tracking tasks can induce different states of cognitive load (Innes, 2021). Among these, the N-back task, first proposed by Kirchner in
Engineering a Cognitive Load Assessment System Through Multimodal Sensor Fusion 103
1958, dynamically and systematically increases task complexity by adjusting the memory recall step length (n value), and is widely used to induce different levels of cognitive load, providing controllable experimental conditions for experiments and analyses in various environments (Pergher et al., 2019). In recent years, research based on multimodal physiological signals such as EEG, photoplethysmography (PPG), and electrodermal activity (EDA) has become a new direction for exploring the neural mechanisms of cognitive load due to its objective and continuous nature (Baig & Kavakli, 2018; Elkin & Devabhaktuni, 2019; Hogervorst, Brouwer, & Van Erp, 2014).
Electroencephalography (EEG) is one of the most commonly used physiological signals in cognitive load research. Extracted EEG features usually include time-domain, frequency-domain, functional connectivity, and nonlinear features (Xu et al., 2021; Chu et al., 2021). Band power is the most commonly used feature in cognitive load assessment. Research has found that EEG α (Haleh et al., 2017), θ (Radüntz, 2017; Klimesch et al., 2007; Zhang et al., 2016) band power is closely related to cognitive load. For example, Haleh et al. (2017) found that α - band power was significantly reduced during high n -back tasks, indicating a high consumption of cognitive resources. In addition, some studies have pointed out that an increase in θ -band(4–8 Hz) power is usually associated with a high cognitive load state. Some researchers used a six - level visual working memory task and θ - rhythm spectral analysis to study the load. The results showed that the strongest connection strength of θ - rhythm was distributed in the frontal midline area, and the functional connectivity between EEG waves weakened with cognitive overload (Klimesch et al., 2007; Zhang et al., 2016). In addition to EEG, photoplethysmography (PPG, which reflects sympathetic - parasympathetic balance through heart rate variability) and electrodermal activity (EDA, which characterizes changes in skin conductance levels) have been used to evaluate autonomic nervous activity induced by cognitive load. Some studies have shown that during high n -back tasks, the low - frequency/high - frequency ratio (LF/HF) of heart rate variability (HRV) was significantly increased, indicating an intensification of sympathetic nerve activation. At the same time, changes in EDA signals are also related to the cognitive load experienced by individuals. The skin conductance response (SCR) is a rapid reaction of the sympathetic nervous system to stimuli and is usually associated with an increase in cognitive load. Research has shown that high cognitive load tasks trigger more SCR events, and the amplitude and frequency of SCR are significantly increased (Rahma et al., 2022). In addition, some studies have pointed out that compared to baseline, SCL is higher during cognitive tasks, indicating a successful induction of sympathetic nervous responses (Ahmadi, Ozgur & Kiziltan, 2024).
Overall, indicators from EEG, PPG, and EDA can all serve as sensitive indicators of cognitive load. However, the contribution rates of these different indicators to cognitive load and which indicators are more robust remain to be further determined. Therefore, this study aims to construct a framework for quantitative assessment of cognitive load based on N-back tasks through multimodal signal analysis. It also measures the representativeness and contribution of feature values from different modal data to cognitive
load, providing indicator suggestions and support for cognitive load state identification and real-time monitoring.
METHODS
Participants A total of 210 healthy participants were recruited, including 112 males and 98 females, with an average age of 26.28±4.89. All participants were right- handed, with normal or corrected vision, and no history of mental illness. Informed consent was obtained from all participants prior to the experiment.
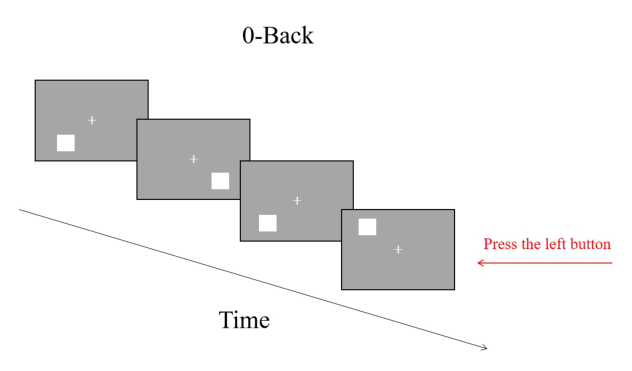
Experimental Design and Procedure The classic N-back task was used as a standard tool for assessing cognitive load, including four difficulty levels: 0-back, 1-back, 2-back, and 3-back (Aghajani et al., 2017; Pergher et al., 2019). First, a fixation point “+” was presented at the center of the screen, followed by stimuli (white squares) appearing in different positions, specifically at eight locations: top, bottom, left, right, upper left, lower left, upper right, and lower right. In the 0-back condition, participants were instructed to press the “J”key if the white square appeared in the upper left corner and the “F” key if it appeared in any other position. In the 1-back condition, no response was required for the first square, but for subsequent squares, participants were to press the “J” key if the current square’s position matched the previous one, and the “F” key if it did not. In the 2-back condition, no response was required for the first two squares, but for subsequent squares, participants were to press the “J” key if the current square’s position matched the one presented two squares prior, and the “F” key if it did not. In the 3-back condition, no response was required for the first three squares, but for subsequent squares, participants were to press the “J” key if the current square’s position matched the one presented three squares prior, and the “F” key if it did not.
Figure 1: Example of a 0-back task.
Engineering a Cognitive Load Assessment System Through Multimodal Sensor Fusion 105
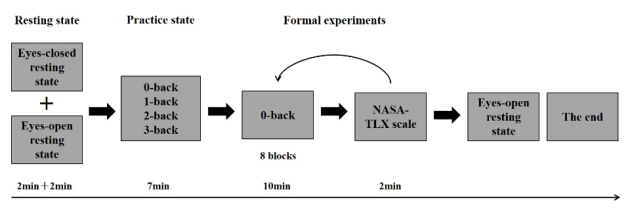
To minimize the impact of individual differences, this experiment employed a within-subject design with a single factor and four levels. Prior to the experiment, participants were fitted with and connected to EEG and physiological devices. The ErgoLAB Human-Machine Synchronous Cloud Platform was opened to record data, ensuring that all sensors had good signal quality. The experiment began with the collection of participants’ resting- state data, including two minutes of eyes-open rest and two minutes of eyes-closed rest. Participants then underwent a practice phase, where they practiced the 0, 1, 2, and 3-back tasks. Each block contained 20 trails, with a target-to-non-target stimulus ratio of 1:3. Each stimulus was presented for 500 ms, followed by a 2500 ms interval before the next stimulus was presented. Feedback on correctness or errors was provided after each practice session. Once the task rules were mastered, the formal experiment commenced, with each back task being performed twice in the order of 0, 1, 2, 3, 3, 2, 1, 0-back. After each task, participants were required to complete the corresponding NASA-TLX scale cognitive load questionnaire (Wang, Zhang & Wang, 2025). Following the experimental tasks, two additional minutes of eyes-open resting data were collected. The specific experimental procedure is outlined in the figure below.
Figure 2: Flowchart of the experimental procedure.
Data Collection Equipment and Materials Experimental materials: The N-back cognitive load task was edited on the Psychopy platform. Participants first practiced the 0, 1, 2, and 3-back tasks and then proceeded to the formal experiment after mastering the task rules. Each back task was performed twice, and after each task, participants were required to complete the corresponding cognitive load questionnaire. The cognitive load scale used was the NASA-TLX (Wang, Zhang & Wang, 2025), which includes six questions:
Q1. Mental Demand: The amount of mental activity required to complete the task, such as observing, remembering, thinking, and searching. Is the task mentally easy or difficult, simple or complex for you?
Q2. Physical Demand: The amount of physical effort required to complete the task, such as pushing, pulling, turning, or controlling movements. Is the task physically easy or difficult for you? Do your muscles feel relaxed or tense?
Q3. How fast or slow was your pace in completing the task? Did you feel calm or panicked?
Q4. How much effort did you exert in completing the task? Q5. How satisfied are you with your performance in achieving the goals? Q6. How much frustration or annoyance did you experience during the task?
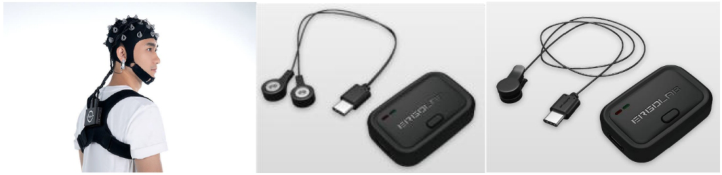
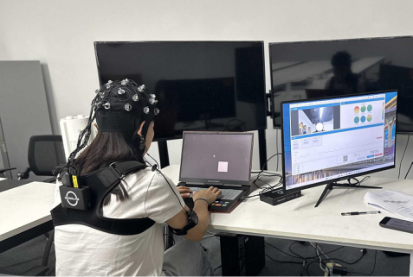
Experimental equipment: The experimental equipment used was the ErgoLAB Human-Machine Environment Synchronization Platform V3.0, which includes a real-time synchronized wearable physiological recording system (Beijing Kingfar Technology Co., Ltd.), the ErgoLAB PPG wireless pulse sensor (64 Hz sampling rate), the ErgoLAB EDA wireless skin conductance sensor (64 Hz sampling rate), and the ErgoLAB hydroelectrode EEG system (256 Hz sampling rate). Data were analyzed using the software analysis modules of the ErgoLAB Human-Machine Environment Synchronization Platform V3.0. The computer used had a Windows Enterprise Edition system with a screen resolution of 1920*1080.
Experimental environment: The experiment was conducted in a separate, quiet room with constant temperature (20-23
C) and constant lighting (approximately 40 lx), free from interference from high-power electrical sources.
Figure 4: Photograph of the experimental setup.
Engineering a Cognitive Load Assessment System Through Multimodal Sensor Fusion 107
Data Quality Check Before data analysis, the quality of the data signals was checked. From the perspective of data integrity, manual checks were performed to ensure that data modalities, folders, and N-back task key responses were complete. From the perspective of data signal accuracy, checks were made to ensure that EEG signals did not exhibit significant and prolonged high resistance during task states, that PPG signals had clear peaks and valleys (Yang, Beh, Lo, Wu, & Lu, 2020), and that there was no significant packet loss (≥20%) in the multimodal data signals. Data with these issues were marked as abnormal and manually deleted, resulting in 159 valid data entries for processing and analysis.
Dataset Description The dataset is available on the kingfar.cn website and includes data from 159 participants, comprising EEG, skin conductance, heart rate, NASA-TLX scale, and demographic survey questionnaire raw data. The dataset structure is as follows:
1. Dataset_description.json: Describes the ownership information of the dataset. 2. readme.json: Describes the content of the cognitive load experiment design, introducing the data collection method, label content, and other information. 3. participants.csv: Participant information file describing the demographic information (ID, gender) of the 159 participants. 4. participants.json: Describes the meaning of the headers in the participants.csv file. 5. Sourcedata: a. EEG, skin conductance, and heart rate collection device information in the info.txt file, specifying the device names and corresponding sampling rates. b. Original data folders for all participants, named by record number (001, 002, 003,..., 159). Each folder contains:
i All EEG raw data: - Complete EEG data records, including.csv formatted EEG files with 32 channels, containing timestamps and 32-channel EEG raw values. - Event.txt files recording segments during the process, with 7 columns: Segment ID, Segment Name (Name), Segment Type (SegmentType), Segment Start Timestamp (StartTime(s)), Segment End Timestamp (EndTime(s)), Segment Duration (Duration(s)), and Recording Name (RecordingName). ii All skin conductance raw data. iii All heart rate raw data: - Complete heart rate data records in.csv format, with 2 columns: timestamp and Value (%).
RESULTS AND DISCUSSION
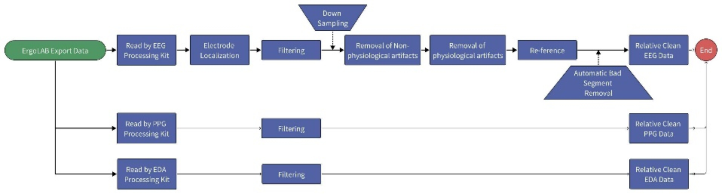
Data Preprocessing Data were processed using Python software. EEG signals were sampled at 256 Hz and filtered with a notch filter to remove DC components, set at 50 Hz to eliminate powerline interference and improve signal quality. Bandpass filtering was applied at 0.5–45 Hz to retain the main frequency components of EEG activity. The reference was converted to the average reference of all valid scalp electrodes using whole-brain average referencing, which eliminates spatial bias from fixed reference electrodes and enhances signal stability. Independent component analysis (ICA) was used to correct artifacts such as blinking, movement, electromyography, and electrocar- diography, with components exceeding ±100 µV considered artifacts and removed to improve EEG signal purity (Delorme & Makeig, 2004; Hyvärinen & Oja, 2000). PPG signals were bandpass filtered at 0.5–8 Hz to remove low-frequency baseline drift and high-frequency noise, retaining signals related to heart rate. Dynamic thresholding was then applied to extract pulse wave features (peak intervals), ensuring temporal accuracy in heart rate calculation (Yu et al., 2006). EDA signals were low-pass filtered at a cutoff frequency of 0.6 Hz to smooth rapid fluctuations in skin conductance responses (SCR), retaining slow-phase changes related to sympathetic nerve activity. High-frequency noise was removed, preserving effective EDA signals, and moving averaging (with a 1-second window) was applied to enhance the separation of tonic (baseline) and phasic (event-related) components (Benedek & Kaernbach, 2010).
Figure 5: Technical roadmap.
Data Quality Validation Alpha waves are a type of rhythm in EEG, typically appearing during relaxed states with eyes closed and characterized by a frequency range of 8–12 Hz. The traditional “Berger effect”indicates that alpha wave amplitude is suppressed (i.e., decreases) when eyes are open or cognitive load increases (Bazanova & Vernon, 2014). Importantly, detecting alpha suppression in EEG datasets is considered a hallmark of reliable, high-quality EEG recording (Marini et al., 2019; Radüntz, 2018). Research has shown that alpha band power spectral density (PSD) should dominate EEG signals during resting states. Experiments have demonstrated that when electrode quality is good, the alpha band PSD ratio exceeds 65%, and this ratio decreases by about 10% after electrodes dry for 30 minutes (Liu et al., 2019). Analysis of
Engineering a Cognitive Load Assessment System Through Multimodal Sensor Fusion 109
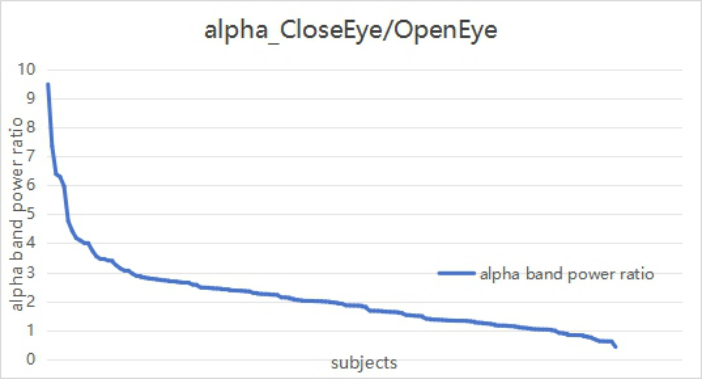
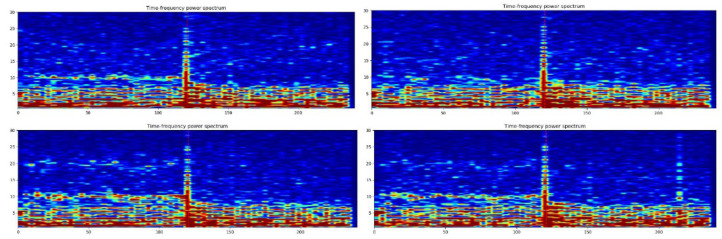
alpha suppression in EEG data revealed significant alpha suppression across different channels in individuals, as shown in the figure below. Analysis of EEG alpha suppression activity was conducted by comparing the ratio of EEG alpha power between eyes-closed and eyes-open resting states, with a ratio greater than 1 indicating good data quality. Results showed that after excluding 16 participants with incomplete resting-state data, the validation excellence rate reached 90%, as detailed in Figure 6. Additionally, Figure 7 illustrates distinct alpha blocking in different channels for a representative participant.
Figure 6: Comparison of alpha band energy between eyes-closed and eyes-open resting states.Figure 7: Example of alpha suppression analysis results for a participant.
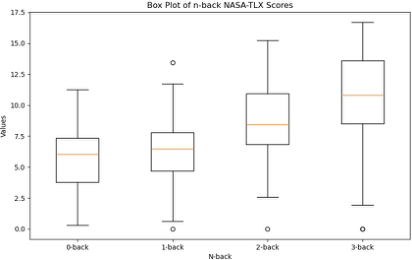
Differential Analysis Subjective scales: The NASA-TLX scale, which includes six items, measures cognitive load from various dimensions such as mental and physical demands, difficulty, effort, satisfaction (reverse scored), and frustration. The mean score was calculated as the individual’s subjective cognitive load, with higher scores
indicating higher perceived cognitive load and vice versa. A one-way ANOVA on the four levels of back tasks revealed significant differences in scores, F(3, 632) = 34.79, p <.001, η2p = 0.25. Specifically, the cognitive load scores for 0-back were significantly lower than for 2 and 3-back (M0-2 = −2.77; M0-3 = −4.88); scores for 1-back were significantly lower than for 2 and 3- back (M1-2 = −2.55; M1-3 = −4.66); and scores for 2-back were significantly lower than for 3-back (M2-3 = −2.11).
Figure 8: Mean of NASA-TLX scale.
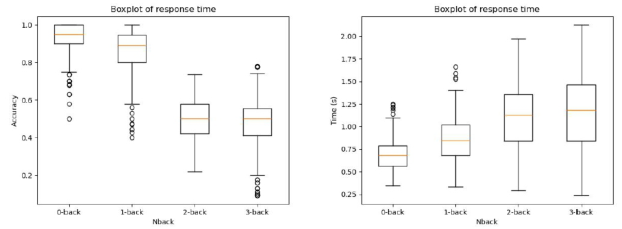
Objective Behavioral Performance: For the classic N-back paradigm, individual reaction accuracy and reaction time were analyzed. Accuracy was calculated as the number of correct responses divided by the total number of trials in each block, and reaction time was the average of all trial reaction times in each block. Higher accuracy and shorter reaction times indicate lower cognitive load, and vice versa. A one-way ANOVA on accuracy and reaction time across the four levels of back tasks showed significant differences in accuracy, F(3, 632) = 1308.49, p <.001, η2p = 0.78. Specifically, accuracy for 0-back was significantly lower than for 1, 2, and 3-back (M0-1 = −0.09; M0-2 = −0.44; M0-3 = −0.45); accuracy for 1-back was significantly lower than for 2 and 3-back (M1-2 = −0.35; M1-3 = −0.01); and no significant difference was found between 2 and 3-back, p > 0.05. Significant differences in reaction time were also found, F(3, 632) = 146.83, p <.001, η2p = 0.27. Reaction time for 0-back was significantly higher than for 1, 2, and 3-back (M0-1 = 0.16; M0-2 = 0.42; M0-3 = 0.47); reaction time for 1-back was significantly higher than for 2 and 3-back (M1-2 = 0.25; M1-3 = 0.31); and no significant difference was found between 2 and 3-back, p > 0.05.
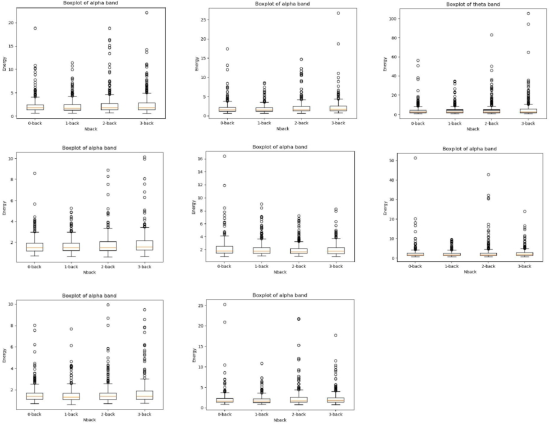
EEG Data For EEG data, we conducted analyses and better localized brain activity affected by cognitive load by examining the entire brain, different brain regions (frontal, central, parietal, occipital, temporal), and different hemispheres (left, right, midline). A one-way ANOVA on whole-brain power showed significant differences in alpha band power across conditions, F(3, 632) = 2.59, p < 0.05, η2p = 0.01. Specifically, alpha power for 0-back was significantly lower than for 2-back (M0-2 = −0.26). Beta band power also showed significant differences across conditions, F(3, 632) = 2.40, p < 0.06 (marginally significant). For left and right brain power, a one-way ANOVA
Engineering a Cognitive Load Assessment System Through Multimodal Sensor Fusion 111
showed significant differences in alpha band power across conditions for both the left hemisphere, F(3, 632) = 3.11, p < 0.05, η2p = 0.01 (1-back significantly higher than 2-back, M1-2 = 0.44), and the right hemisphere, F(3, 632) = 2.53, p < 0.01, η2p = 0.01 (1-back significantly higher than 2- back, M1-2 = 0.72). For different brain regions, a one-way ANOVA showed significant differences in frontal lobe alpha power, F(3, 632) = 2.98, p < 0.05, η2p = 0.01 (1-back significantly higher than 3-back, M1-3 = 0.40); frontal lobe theta power, F(3, 632) = 2.55, p < 0.06 (marginally significant), η2p = 0.01; parietal lobe alpha power, F(3, 632) = 2.93, p < 0.05, η2p = 0.01 (1-back significantly higher than 3-back, M1-3 = 0.44); temporal lobe alpha power, F(3, 632) = 2.64, p < 0.05, η2p = 0.01 (1-back significantly higher than 3-back, M1-3 = 0.21); and central region alpha power, F(3, 632) = 3.04, p < 0.05, η2p = 0.01, 1-back significantly higher than 3-back, ( M1-3 = 0.25).
Figure 9: Accuracy and reaction time for different _n_-back tasks.
EDA Data: For EDA data, we analyzed time-domain indicators, including skin conductance responses (SCR), which represent transient and rapid fluctuations in skin conductance, and skin conductance level (SCL), which represents gradual changes in skin conductance. A one-way ANOVA on SCR and SCL values across the four levels of back tasks showed no significant differences, ps > 0.05.
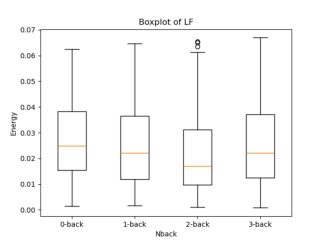
HRV Data: For HRV data, we analyzed frequency-domain indicators, including LF, which generally reflects parasympathetic nerve activation; HF, which generally reflects sympathetic nerve activation; and the ratio of LF/HF, which indicates autonomic nervous system balance. A one-way ANOVA comparing the four conditions showed significant differences in LF values, F(3, 632) = 4.40, p < 0.05, η2p = 0.02. Specifically, LF values for 2-back (M = 0.0224, SD = 0.02) were significantly lower than for 0-back (M2-1 = −0.005). No significant differences were found for HF and LF/HF values, ps > 0.05.
Multiple Linear Regression From the data results, different data modalities have distinct correlation indicators. Notably, difference tests reveal significant inconsistencies in outcomes between subjective questionnaires and objective behavioral and physiological measures for the 0-back and 2-back tasks. To explore the relationship between physiological indicators and subjective questionnaire scores, a multiple linear regression analysis was performed. Subjective scores
served as the dependent variable, and significant physiological indicators (EEG, PPG features) as independent variables. Data were normalized using Z - scoring to eliminate scale - related differences, and stepwise regression identified features significantly contributing to subjective scores.The final regression model includes these significant indicators: whole - brain, left - brain, right - brain, frontal, parietal, temporal, and central EEG alpha power; frontal EEG theta power; and PPG’s LF (parasympathetic activation). The model’s R2 is –0.10. The right - brain alpha power has the highest contribution (β = −1.70), followed by central alpha power (β = −1.59), frontal theta power (β = −1.23), parietal alpha power (β = 1.19), LF (β = −0.86), temporal alpha power (β = 0.75), frontal alpha power (β = 0.74), left - brain alpha power (β = 0.74), and whole - brain alpha power (β = −0.64).
Figure 10: Average power of EEG in different frequency bands under various _n_-back conditions (Note: The bands include parietal α, frontal α, frontal θ, temporal α, whole- brain α, right-hemisphere α, central α, and left-hemisphere α).Figure 11: LF values under different N-back conditions.
Engineering a Cognitive Load Assessment System Through Multimodal Sensor Fusion 113
DISCUSSION
This study constructed a quantitative assessment framework for cognitive load based on multimodal data, providing new insights and methods for the dynamic monitoring and quantification of cognitive load. By collecting three types of multimodal data—electroencephalography (EEG), heart rate variability (HRV), and electrodermal activity (EDA)—this study validated the effectiveness of multimodal physiological signals in cognitive load assessment.
First, our results are consistent with previous studies. The analysis of the NASA-TLX scale for cognitive load showed significant differences among the 0, 1, 2, and 3-back tasks. Specifically, the scores for 0-back were significantly lower than for 2 and 3-back, while no significant difference was found between 0 and 1-back. This may result from some participants found little difference in difficulty between these two conditions, allowing them to respond easily without inducing distinguishable load levels. Thus, they were unable to differentiate these conditions subjectively. In contrast, objective results differed from subjective results, as both objective behavioral performance and EEG and physiological results showed no significant differences between 2 and 3-back. This could be due to some participants found 3-back tasks difficult to complete, leading to feelings of slackness and abandonment. Therefore, although they subjectively indicated that 3-back was significantly more difficult than 0, 1, and 2-back, the objective indicators showed no numerical differences. This indirectly suggests that combining subjective and objective multimodal data collection provides a more comprehensive and detailed reflection of individual cognitive load changes. Regarding the multiple linear regression results, Hogervorst et al. (2014) used four measurement methods—EEG, ECG, skin conductance, and eye tracking—to assess cognitive load across different levels of N-back tasks, demonstrating the most significant relationship between EEG signals and cognitive load.
The study results not only validate the reliability of the devices used for physiological signal collection but also provide reliable physiological feature indicators for future research. Furthermore, the integration of multimodal data offers a more comprehensive perspective for cognitive load quantification. While single-modality data (e.g., EEG) can capture changes in brain activity, it may not fully reflect the complexity of cognitive load. Combining HRV and EDA provides a more comprehensive reflection of dynamic changes in the autonomic nervous system and emotional state, thereby more accurately and stably representing the dynamic characteristics of cognitive load. This multimodal data integration not only enhances the precision of assessment but also provides a richer set of features for future state identification research. For example, combining deep learning algorithms (e.g., convolutional neural networks or long short-term memory networks) with multimodal data for feature learning can improve the generalization and adaptability of models. Additionally, the feature indicators provided by this study can serve as references for a standardized evaluation system of cognitive load. Based on feature indicators from multimodal data,
a standardized assessment tool can be developed for monitoring cognitive load in fields such as education, healthcare, and human-computer interaction. In educational settings, real-time monitoring of students’ cognitive load can optimize teaching strategies. In healthcare, these feature indicators can assist in diagnosing diseases related to cognitive load, such as anxiety disorders or attention deficit disorders.
Future research can be expanded in several directions. First, sample size and task design can be further optimized, such as avoiding floor effects (e.g., 3-back) and ceiling effects (e.g., 0-back). For example, introducing cognitive load states from various real-world scenarios can enhance the generalizability and ecological validity of the research. Second, feature extraction methods can be combined with machine learning and deep learning algorithms (e.g., autoencoders or generative adversarial networks) to further explore the potential information in multimodal data. Finally, the introduction of more modalities (e.g., eye tracking or facial expressions) can further enrich the dimensions of cognitive load assessment. For instance, studies have shown that when individuals experience higher cognitive load, their gaze duration (Xue Yao feng & Li Zhuowei, 2019), number of fixations (Henderson & Ferreira, 1990), and pupil diameter (Biondi et al., 2020) increase. These directions will help advance cognitive load assessment methods and provide more reliable theoretical support for practical applications.
CONCLUSION
This study establishes a cognitive load quantification framework using multimodal sensor fusion, including EEG, HRV, and EDA, demonstrating that EEG features are the most significant contributors to cognitive load classification. Through experiments with 159 participants using a hierarchical n-back task, the research confirms the sensitivity of multimodal physiological signals to cognitive load changes and highlights the value of combining subjective and objective data for a comprehensive assessment. The findings provide a foundation for developing high-precision cognitive load assessment models and offer practical implications for optimizing task design in education, healthcare, and human-computer interaction systems. Future research could enhance generalizability by expanding sample sizes, refining task designs, and incorporating advanced feature extraction techniques and additional modalities.
ACKNOWLEDGMENT
This research was supported by the “Scientific Research Support” initiative provided by Kingfar International Inc. We extend our sincere gratitude to the Kingfar project team for their invaluable technical assistance and the provision of equipment related to the ErgoLAB Man-Machine-Environment Synchronization Platform V3.0. Their contributions were instrumental in advancing this study.
Engineering a Cognitive Load Assessment System Through Multimodal Sensor Fusion 115
REFERENCES
Ahmadi, N. K., Ozgur, S. F., & Kiziltan, E. (2024). Evaluating the Effects of Different Cognitive Tasks on Autonomic Nervous System Responses: Implementation of a High-Precision, Low-Cost Complementary Method. Brain and Behavior, 14(10), e70089. Baig, M. Z., & Kavakli, M. (2018, December). Analyzing novice and expert user’s
cognitive load in using a multi-modal interface system. In 2018 26th international conference on systems engineering (ICSENG) (pp. 1–7). IEEE. Bazanova, O. M., & Vernon, D. (2014). Interpreting eeg alpha activity. Neuroscience and Biobehavioral Reviews, 44(1), 94–110. Benedek, M., & Kaernbach, C. (2010). A continuous measure of phasic electrodermal activity. Journal of Neuroscience Methods, 190( 1), 80–91. Biondi, F. N., Balasingam, B., Ayare, P., 2020. On the cost of detection response task
performance on cognitive load. Hum. Factors, 0018720820931628. Biswas, P., Dutt, V., & Langdon, P. (2016). Comparing ocular parameters for cognitive load measurement in eye-gaze-controlled interfaces for automotive and desktop computing environments. International Journal of Human-Computer Interaction, 32(1), 23–38. Calcagno, A., Coelli, S., Couceiro, R., Durães, J., Amendola, C., Pirovano, I.,... &
Bianchi, A. M. (2020, June). EEG monitoring during software development. In 2020 IEEE 20th Mediterranean Electrotechnical Conference (MELECON) (pp. 325–329). IEEE. Chan, C.-Y. (2017). Advancements, prospects, and impacts of automated driving systems. International Journal of Transport Science and Technology, 6(3), 208–216. Choi, M., Koo, G., Seo, M., & Kim, S. W. (2017). Wearable device-based system
to monitor a driver’s stress, fatigue, and drowsiness. IEEE Transactions on Instrumentation and Measurement, 67(3), 634–645. Chu, H. Z., Jiao, X. J., Jiang, J., Cao, Y., Yang, J. H., Huang, M. Y.,... & Li, X. Q. (2021). Research on the personalized EEG response characteristics and recognition of mental workload. Manned Spaceflight, 27(6), 710–718. Delorme, A., & Makeig, S. (2004). EEGLAB: An open-source toolbox for analysis
of single-trial EEG dynamics. Journal of Neuroscience Methods, 134(1), 9–21. Duchowski, A. T., Krejtz, K., Zurawska, J., & House, D. H. (2019). Using microsaccades to estimate task difficulty during visual search of layered surfaces. IEEE Transactions on Visualization and Computer Graphics, 26(9), 2904–2918. Elkin, C., & Devabhaktuni, V. (2019, June). Comparative analysis of machine
learning techniques in assessing cognitive workload. In International Conference on Applied Human Factors and Ergonomics (pp. 185–195). Cham: Springer International Publishing. Haleh, Aghajani, Marc, Garbey, Ahmet, & Omurtag. (2017). Measuring mental workload with eeg+fnirs. Frontiers in Human Neuroscience, 11. Hart, & S., G.. (2006). Nasa-task load index (Nasa-TLX); 20 years later. Proc
Human Factors & Ergonomics Society Meeting (Vol. 50, pp. 904–908). Hart, S. G., Staveland, L. E., 1988. Development of Nasa-Tlx (Task Load Index): Results of Empirical and Theoretical Research. Advances in Psychology, vol. 52. Elsevier, pp. 139–183. Henderson, J. M., & Ferreira, F. (1990). Effects of foveal processing difficulty on the
perceptual span in reading: Implications for attention and eye movement control. Journal of Experimental Psychology: Learning, Memory, and Cognition, 16(3), 417.
Hogervorst, M. A., Brouwer, A. M., & Van Erp, J. B. (2014). Combining and comparing EEG, peripheral physiology and eye-related measures for the assessment of mental workload. Frontiers in neuroscience, 8, 322. Hyvärinen, A., & Oja, E. (2000). Independent component analysis: Algorithms and
applications. Neural Networks, 13(4-5), 411–430. Innes, R. J., 2021. Behavioural Measurement of Cognitive Workload. Klimesch, W., Sauseng, P., & Hanslmayr, S. (2007). EEG alpha oscillations: The inhibition-timing hypothesis. Brain Research Reviews, 53(1), 63–88. Lilienthal, L., Tamez, E., Shelton, J. T., Myerson, J., & Hale, S. (2013). Dual n-back
training increases the capacity of the focus of attention, 20, 135–141. Liu, D., Wang, Q., Zhang, Y., Liu, X., Lu, J., & Sun, J. (2019). A study on quality assessment of the surface EEG signal based on fuzzy comprehensive evaluation method. Computer Assisted Surgery, 24(sup1), 167–173. Mühlbacher-Karrer, S., Mosa, A. H., Faller, L.-M., Ali, M., Hamid, R., Zangl, H., & Kyamakya, K. (2017). A driver state detection system—combining a capacitive hand detection sensor with physiological sensors. IEEE Transactions on Instrumentation and Measurement, 66(4), 624–636. Marini, F., Lee, C., Wagner, J., Makeig, S., & Gola, M. (2019). A comparative
evaluation of signal quality between a research-grade and a wireless dry-electrode mobile EEG system. Journal of neural engineering, 16(5), 054001. Park, S., Jeong, S., Myung, R., 2018. Modeling of multiple sources of workload and time pressure effect with act-r. Int. J. Ind. Ergon. 63, 37–48. Pergher, V., Wittevrongel, B., Tournoy, J., Schoenmakers, B., & Van Hulle, M. M.
(2019). Mental workload of young and older adults gauged with ERPs and spectral power during N-Back task performance. Biological psychology, 146, 107726. Pillai, P., Balasingam, B., Jaekel, A., & Biondi, F. N. (2024). Comparison of concurrent cognitive load measures during n-back tasks. Applied Ergonomics, 117, 104244. Radüntz, T. (2017). A new method for the objective registration of mental workload.
In Advances in Neuroergonomics and Cognitive Engineering: Proceedings of the AHFE 2016 International Conference on Neuroergonomics and Cognitive Engineering, July 27–31, 2016, Walt Disney World®, Florida, USA (pp. 279–290). Springer International Publishing. Radüntz, T. (2018). Signal quality evaluation of emerging EEG devices. Frontiers in physiology, 9, 98. Rahma, O. N., Putra, A. P., Rahmatillah, A., Putri, Y. S. K. A., Fajriaty, N. D.,
Ain, K., & Chai, R. (2022). Electrodermal Activity for Measuring Cognitive and Emotional Stress Level. Journal of medical signals and sensors, 12(2), 155–162. Sweller, J., Ayres, P., & Kalyuga, S. (2011). Cognitive load theory. Springer. Sweller, J., van Merriënboer, J., & Paas, F. (2019). Cognitive architecture and instructional design: 20 years later. Educational Psychology Review, 31, 261–292. Toy, S., Miller, C. R., Guris, R. J. D., Duarte, S. S., Koessel, S., & Schiavi, A. (2020).
Evaluation of 3 cognitive load measures during repeated simulation exercises for novice anesthesiology residents. Simulation in Healthcare, 15(6), 388–396. Vukovic, M., Stolar, M., & Lech, M. (2021). Cognitive load estimation from speech commands to simulated aircraft. IEEE/ACM Transactions on Audio, Speech, and Language Processing, 29, 1011–1022. Xu, Z. M., Niu, Y. F., Wen, X. Y., Zhou, Y. Y., Wang, P., Wu, X., & Zhang, D.
Q. (2021). Review of cognitive load assessment based on EEG signals. Aerospace Medicine and Medical Engineering, 34(4), 339–348.
Engineering a Cognitive Load Assessment System Through Multimodal Sensor Fusion 117
Xue, Y. F., & Li, Z. W. (2019). Research on the cognitive load quantification model of online learning based on eye-tracking technology. Modern Educational Technology, 29(7), 59–65. Yang, Y. C., Beh, W. K., Lo, Y. C., Wu, A. Y. A., & Lu, S. J.. (2020). Ecg-aided ppg
signal quality assessment (sqa) system for heart rate estimation. IEEE. Yu, C, Liu, Z, McKenna, & T, et al. (2006). A method for automatic identification of reliable heart rates calculated from ecg and ppg waveforms. Journal of the American Medical Informatics Association. Zhang, D., Zhao, H., Bai, W., & Tian, X. (2016). Functional connectivity among
multi-channel EEGs when working memory load reaches the capacity. Brain research, 1631, 101–112. Zhong, X., Li, J., Liu, Z. G., & Huang, Y. C. (2018). Validity of the NASA-TLX scale for subjective fatigue evaluation based on VTS testing. Ergonomics, 24(4), 24–29.
LISTED IN THE AHFE DIGITAL BOOKSTORE CATALOGUE
Explore the complete digital volume
Human Error, Reliability, Resilience, and Performance
Read this individual research paper free through the original publisher, or explore the full digital proceedings book.
ISBN 978-1-964867-49-6
Explore this ISBN in the AHFE Bookstore ↗Listed in the July 2026 bookstore catalogue; search by ISBN to confirm current availability · Digital book purchase optional