Qichao Zhao, Ran Yang, Xiaoqing Zhu, Chunxiao Li, Xin Gao, Yanan Li, Haiyang Yu, Jie Wang, Junli An, Ziying Tan, Ziyuan Zhao (2024). Systematic Comparison of Signal Quality in Portable and Wearable Wireless EEG Devices: Methods and Standards. In: Ergonomics In Design. AHFE Open Access, vol. 129, pp. 75–85. https://doi.org/10.54941/ahfe1004813
Electroencephalography (EEG) is a technique that captures the electrical activity of the cerebral cortex, effectively reflecting various rapid cognitive processes. Traditional EEG devices, often large and bulky, are impractical for real-world applications. To address this, wearable and wireless EEG systems have been developed as cutting-edge technology. However, there remains uncertainty about their signal quality .In this study, we introduce a systematic comparison method customized for portable wireless EEG devices. This experiment includes three tasks: α-suppression, Biofeedback, and the Stroop Colour and Word Test, evaluating signal quality in both time and frequency domains. In the α-suppression task, we analyzed spectral power in the α band, Signal-to-Noise Ratio (SNR), Root Mean Square(RMS),and artifact rejection. For the biofeedback task, we evaluated Engagement (β/(α+θ)) and Relaxation (α/β) indices. We also measured the N400 amplitude during the Stroop Colour and Word Test. These indicators represent varying levels of signal quality requirements, from low to high. Additionally, to assess whether semi-dry EEG devices can match the performance of medical-grade gel electrodes, further significant difference and correlation analysis between the two types of devices were conducted. The frequency domain analysis revealed alpha suppression during eyes-open states and increased relaxation and engagement states during the biofeedback task compared to resting state. In the time domain analysis, although no statistical significance was observed in the N400 component, a clear trend of a larger N400 under inconsistent conditions was evident in waveform and topographic maps. Furthermore, difference tests and correlation analysis between the two devices demonstrated a strong positive correlation in signals and consistent performance across all tasks. These findings suggest that portable EEG devices provide reliable signal accuracy in real-world settings, the signal quality of the semi-dry electrodes used in this study is comparable to that of medical-grade gel electrodes.
Electroencephalography (EEG) technology originates from the synchronized synaptic activity of numerous neurons in the cerebral cortex. It involves the collection of signals from electrodes placed on the surface of the scalp. Unlike
other brain imaging methods such as Functional Magnetic Resonance Imag- ing (fMRI), EEG provides cost-effectiveness along with distinct advantages including non-invasive, silent recording, and it also offers high temporal resolution and safety. However, EEG signals are susceptible to interference from environmental factors such as electromagnetic fields and physiologi- cal artifacts, which necessitates controlled laboratory conditions for research (Kezi Selva Vijila et al., 2007; Jiang, Bian and Tian, 2019).
Advancements in emerging sensor technology, digital signal processing, and deep noise reduction techniques have enabled the miniaturization of EEG amplifiers while maintaining high signal precision. Additionally, progress in wireless data transmission technologies facilitates the wireless transfer of EEG signals to remote software (Brown et al., 2010; Aznan et al., 2019). The integrated application of these technologies has propelled the development of portable, wearable, and wireless EEG devices, expanding the horizons of EEG technology’s applications (Dabbaghian et al., 2019).
Portable EEG is rapidly demonstrating its potential across multiple fields. For instance, in the realm of abnormal sleep detection, EEG technology is used for monitoring sleep cycles and identifying sleep disorders (Szu, Tran and Lalonde, 2014). In biofeedback applications, EEG aids individuals in improving their mental states by monitoring brain activity (Phneah and Nisar, 2017). In the field of brain-computer interfaces, EEG is utilized for control- ling robotic arms or recognizing emotions and other states (Zhang, Ji and Zhang, 2016; Rahman et al., 2021; Hu et al., 2022).
However, the signal quality of these devices and the impact of different conductive mediums on signal quality remain unclear. There have only been a few articles dealing with this issue. For instance, Wyckoff et al. (2015) and Di Flumeri et al. (2019) directly compared research-grade gel electrodes with portable dry electrodes in their device selection. This comparison cov- ers different electrode materials, conductive mediums, and amplifier designs, exhibiting a significant leap in levels, More importantly, these two types of devices have different application fields, making such direct comparisons unfair to portable EEG devices. Meanwhile, Ahn, Ku and Kim (2019) only compared their self-developed dry electrodes with those dry electrodes that have relative recognition in the industry to validate the effectiveness of their devices, there was no comparison of portable devices with different con- ductive mediums. Additionally, in these studies, most comparisons of signal quality between different devices are based on a single dimension, (Bashivan, Rish and Heisig (no date); Ahn, Ku and Kim, 2019), without setting eval- uation indicators representing different signal qualities, we only know the limited availability of the device, but its generalization ability cannot be evaluated.
In our study, we aimed to establish a comprehensive assessment framework that includes various dimensions such as the time and frequency domains. This framework employs criteria with progressively increasing signal qual- ity from low to high (Wyckoff et al., 2015), this gradation allows for a thorough evaluation of the performance of portable devices. Additionally, we conducted a comparative analysis between a gel-based and a semi-dry portable EEG device. This comparison not only reveals potential differences
Systematic Comparison of Signal Quality 77
between two different portable EEG devices, but also serves to validate the rationality of our assessment framework to a certain extent.
EEG SYSTEM ErgoLAB Semi-Dry EEG
The system comprises 16 active channel electrodes and 1 earlobe clip refer- ence electrode. It is equipped with PPG, EDA, and 9-axis sensors. With an input impedance exceeding 10G, a common mode rejection ratio (CMRR) of 110dB, and a signal-to-noise ratio (SNR) of 120 dB, sampling rate reaches up to 1024Hz, and the resolution is 24 bits.
StarStim 8 Gel Electrode EEG StarStim 8 is a medical-grade gel electrode EEG device. It has a sampling rate of 500 SPS, a resolution of 24 bits, a sensitivity of 0.05 uV, and a signal-to- noise ratio of −115 dB. It adopts a dynamic bandwidth format, supporting a broadband range of 0 to 125 Hz. The device takes the form of an ear- clip reference electrode and supports continuous data acquisition for up to 6.5 hours.
EXPERIMENT Participants
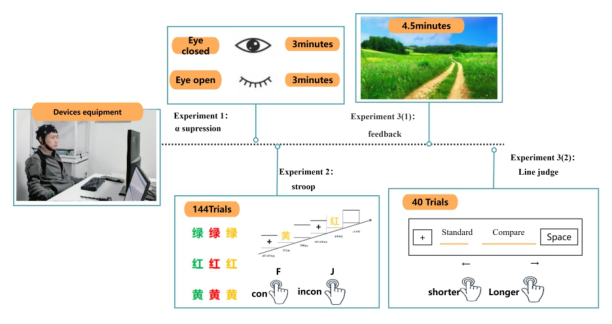
Fifteen participants were involved in experiments over two different days, using both medical-grade gel electrodes and portable semi-dry electrodes. The Latin square method was employed to balance the order of device usage and the timing of the experiments. Each participant completed the experimental tasks in the same procedure (Figure 1).
Procedure In this study, three tasks were performed to evaluate the acquired signal from both devices. Those tasks are explained as follows (see Figure 1).
Figure 1: Experimental procedure flowchart.
Alpha Suppression Task Alpha suppression is characterized by a reduction in alpha wave activ- ity (8–12Hz) when transitioning from a closed-eye to an open-eye resting state (Haueisen et al., 2020), which is a phenomenon particularly promi- nent in the occipital region, and has relatively low requirements for signal quality. In our experiment,we conduct three-minutes sessions of both open- eye and closed-eye resting states.
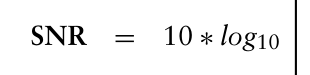
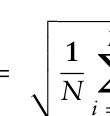
Additionally, we calculate the Signal-to-Noise Ratio (SNR) and the Root Mean Square (RMS) during the resting state as metrics for assessing sig- nal quality, the corresponding formula is as follows (Harke Pratama et al., 2020).
"
# σ 2
(1)
Equation reproduced from the original PDF.
α σ 2 1−70Hz N X
x2
RMS =
i (2)
Equation reproduced from the original PDF.
N is the number of samples in the segment
Xi is the value of the i-th sample in the segment.
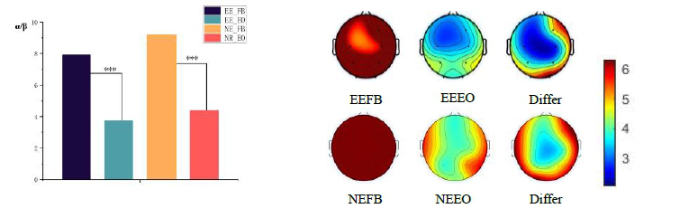
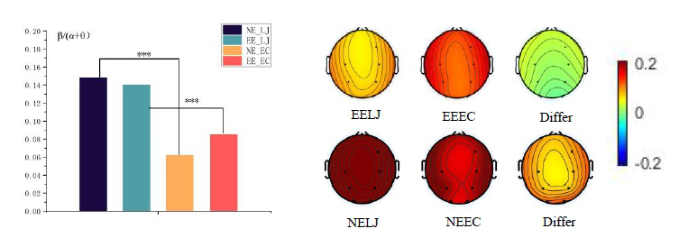
Biofeedback Task The biofeedback task encompasses two distinct sub-tasks. In the Line Judg- ment Task, participants adjust and match the length of a comparison line to a standard line. Here, the engagement index (E) is calculated using the ratio E=β/(α+θ) (Freeman et al., 2004; Marcantoni et al., 2023), which serves to measure the participants’ level of focus during the task. In the Breathing Relaxation Task, participants perform relaxation exercises guided by a video, aiming to achieve a state of relaxation, the relaxation index (R) is calculated using the ratio R=α/β, (Phneah and Nisar, 2017). More variables lead to greater variability in results, so the signal quality requirements for R=α/β are not as high as for E=β/(α+θ).
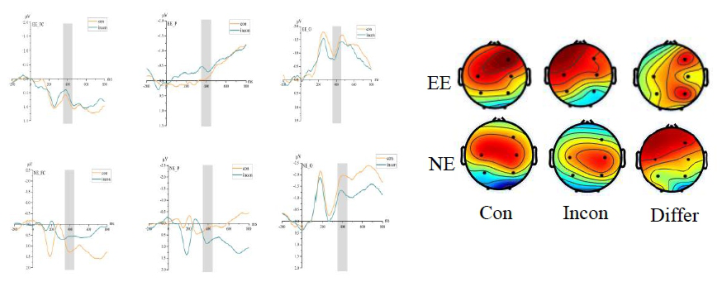
Stroop Colour and Word Test In the Stroop Colour and Word Test, when participants are required to judge whether the font color matches the semantic meaning of the word, incon- gruent condition is typically induces larger N400 (350–450ms) com- ponents compared to the congruent condition (Liotti et al., 2000; Li et al., 2011). This phenomenon represents increased cognitive con- trol in response to the conflict between the font color and word meaning. ERP is often masked by spontaneous potentials, requiring a large number of trials to be averaged to reveal it, which demands high signal quality. A total of 140 trials were conducted, with an equal number of congruent and in-congruent stimuli (Ahn, Ku and Kim, 2019; Wyckoff et al., 2015).
Systematic Comparison of Signal Quality 79
EEG DATA PREPROCESSING To ensure consistency in the final data structure between two devices, the steps are as follows:
Sampling Rate Adjustment: After electrode localization, the sampling rate of the StarStim 8 is adjusted to 256Hz.
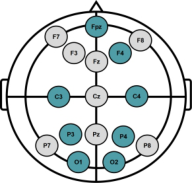
Channel Reduction: The number of channels on the ErgoLAB semi-dry EEG is reduced to 8 to align with the Starstim 8 configuration (Figure 2).
Filtering Process: The raw EEG data are processed using EEGLAB2021 with a band-pass filter from 0.1Hz to 70Hz, and a 50Hz notch filter to attenuate electrical line noise and minimize artifacts.
Independent Component Analysis (ICA): An 8-channel ICA is conducted for both devices. Ocular artifacts and other artifacts are identified and manually removed, based on distinct topographical and temporal features.
Data Segmentation and Baseline Correction: The EEG data is divided into segments based on the experimental tasks. For the Stroop Colour and Word Test, epochs from −200ms pre-stimulus to 1000ms post-stimulus are selected, with a 200ms pre-stimulus period serving as the baseline. Trials with incorrect responses are excluded using response markers. For the other three tasks, the data are divided into 2-second segments.
Visual Inspection and Removal of Bad Segments: The data from all tasks are visually inspected, and segments with poor signal quality are identified and removed.
Whole Brain Average Referencing: Finally, a whole-brain average referenc- ing is implemented to standardize the EEG data across all channels.
Figure 2: Channel distribution.
RESULTS
Number of Artifacts EEG signals are non-stationary, and the lower the signal-to-noise ratio, the more noise is contained in the signal, leading to greater amplitude vari- ability. In this study, the EEGLAB plugin was used to perform automatic artifact detection using the Max-min method on 3 minutes of resting-state, eyes-closed data (90 segments * 8 channels). Each segment was 2 seconds long, with a voltage range of ±80 micro volts. When the voltage difference between the maximum and minimum reached 160 micro volts, the segment
was marked as a bad segment. If the number of bad segments in a chan- nel exceeded 20%, that channel was marked as a bad channel (Morán and Soriano, 2018; Radüntz, 2018), averaging the results of the 15 participants. The table below indicates that the artifacts contained in both devices are at a lower level.
Table 1. The number of bad channel and electrodes in two devices (total 720 segments).
Table available in the original PDF paper.
Devices ErgoLAB semi-dry EEG StarStim 8 gel EEG Number of bad segments (n = 720) 0.8 0.13 Number of bad electrodes (n = 8) 0 0
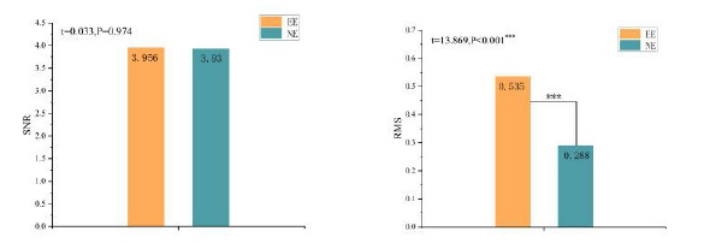
SNR and RMS in Alpha Suppression Task We computed the mean SNR and RMS of O1 and O2 as generic indicators to assess signal quality. Paired sample T-tests were conducted on the SNR and RMS of both devices during eyes-closed resting states. The results indicate that although the RMS of the semi-dry electrodes is higher than that of the gel electrodes, t(28) = 13.869, p < 0.001, there is no significant difference in the SNR between the two (Figure 3), t(28) = 0.033, p = 0.974. This suggests that the signal quality of the semi-dry electrodes is comparable to that of the gel electrodes, and their original signal amplitude is larger, enabling better noise resistance.
Figure 3: RMS (left) and SNR (right) for the two devices, where ‘EE’ represents ErgoLAB semi-dry EEG, and ‘NE’ represents StarStim 8 gel electrode EEG.
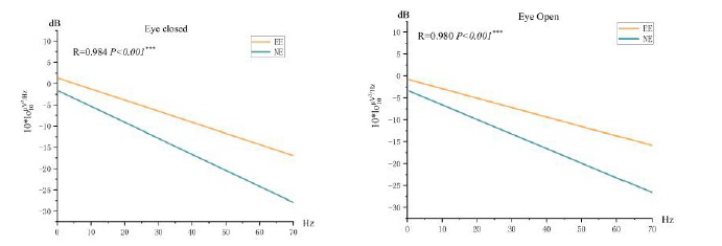
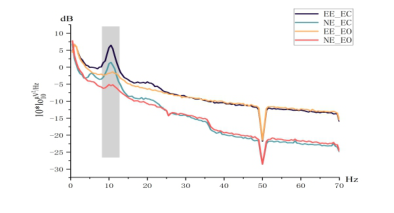
Analysis of Power Spectral Density After prepossessing, Fast Fourier Transform (FFT) was applied to obtain the energy values in the frequency domain. In accordance with previous research, the average of O1 and O2 values will be used for analysis. Firstly, Pearson correlation analysis was conducted separately for the energy values ranging from 1 to 70 Hz for two devices during both open-eye and closed-eye states. Subsequently, a paired sample t-test was performed on the alpha suppression of the two devices.
There is a strong positive correlation between the energy variations of the two devices in the 1–70 Hz range (Bashivan, Rish and Heisig,
Systematic Comparison of Signal Quality 81
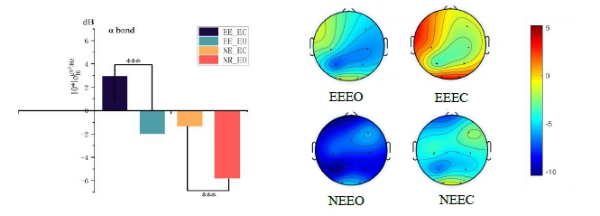
no date; Kam et al., 2019), rs > 0.98, ps < 0.001 (Figure 4). The results of the α band t-tests indicate that whether it’s the semi-dry electrode, t(28) = −4.060, p < 0.001, or the gel electrode, t(28) = −3.077, p = 0.005, the alpha power during eye-closed state is significantly higher than during eye-open state. Simultaneously, this difference is consistent across different devices (Figure 5 & Figure 6), t(28) = 0.452, p = 0.655.
Figure 4: Correlation during closed-eye (left) and open-eye resting states (right) on both devices.Figure 5: PSD in the 1–70 Hz range, where “EC” represents eye closed, and “EO” represents eye open.Figure 6: Average values of the alpha frequency (left) and power spectrum topograph- ical maps (right).
Engagement (β/(α + θ)) and Relaxation (α/β) In comparison to alpha suppression, tasks like breathing relaxation and line judgment involve mathematical operations on energy values from multiple frequency bands, making them more sensitive to data signal quality.
In order to examine whether the portable electrodes can still sensitively capture stimulus-induced differences, repeated measures analysis of variance (ANOVA) was conducted on the two factors: 2 devices (EE, NE) and 2 states (task, eye-open), using Engagement=β/(α+θ)and Relaxation=α/β as the indicators, FFT was also applied to these data, units in µV2.
The main effect of the feedback state is statistically significant, with F(1,59) = 13.999, p < 0.001, whether it’s the semi-dry electrode, F(1,59) = 6.062, p = 0.017, or the gel electrode, F(1,59) = 8.005, p = 0.006, the relaxation indicators in feedback task are greater than those during the resting state (Figure 7). there is no interaction between the devices and state, F(1,59) = 0.067, p = 0.796.
Figure 7: Average values of the alpha beta ratio (left) and power spectrum topograph- ical maps (right). ‘FB’ represents feedback.
In the line judgment task, there was no significant difference in β/(α+θ) between the task state and the open-eye resting state, with F(1,59) = 1.646, p = 0.205. Furthermore, when compared to the eye-closed, it was found that both the gel device F(1,59) = 33.593, p < 0.001, and the semi-dry device F(1,59) = 13.907, p < 0.001, had significantly higher Engagement during the line judgment task (Figure 8), there is no interaction between the devices and state, F(1,59) = 1.748, p = 0.191.
Figure 8: Average values of β/(α+θ) (left) and power spectrum topographical maps (right). ‘LJ’ represents line judgment, ‘EC’ represents eyes closed rest, and ‘differ’ represents the topographical map of the difference wave between LJ and EC.
Systematic Comparison of Signal Quality 83
N400 Amplitude Referring to previous research, a repeated measures analysis of variance 2 (devices (EE, NE) and 2 conditions (consistent, inconsistent)) was conducted on the average amplitude of N400 (350–450ms) using four anterior hemi- sphere channels, (Marini et al., 2019) namely FPZ, F4, C3, and C4, while the N400 amplitude was larger under the inconsistent condition compared to the consistent condition, but the difference did not reach statistical signif- icance (Figure 9), ps > 0.350,and there was no observed interaction between the devices and conditions, ps > 0.225.
Figure 9: N400 waveform and topographical map, ’FC’ represents the frontal and cen- tral areas, ‘P’ represents the parietal area, and ‘O’ represents the occipital region. ‘Con’ represents consistent, and ‘Incon’ represents inconsistent.
CONCLUSION
This study established a comprehensive evaluation framework, assessing the performance of portable EEG devices in terms of frequency domain, time domain, and general signal quality indicators.
Frequency domain indicators include alpha waves, alpha/beta ratio, and beta/(alpha+theta) ratio. Due to the narrow frequency range of a single band, they are easier to separate from noise. In contrast, the computational indica- tors of multiple frequency bands are more sensitive to the level and type of noise. Therefore, the requirements for signal quality of these three indicators gradually increase from low to high. The results show that the energy value of alpha waves in the closed-eye resting state is higher than that in the open- eye state, and the relaxation and engagement indicators under biofeedback conditions are higher than those in the quiet state. In the time domain anal- ysis, although there was no significant difference in the N400 (Liotti et al., 2000; Li et al., 2011) component statistically between the consistent and inconsistent conditions, a clear trend can be seen in the waveform and topo- graphic maps.Overall, these research results show that portable EEG devices can adapt to more realistic application environments and provide reliable signal accuracy.
To further assess the differences in signal quality among portable devices with different conductive media, this study added three general indicators such as artifact rejection rate, signal-to-noise ratio, and root mean square of the signal on the basis of time-frequency domain indicators and conducted a difference test between devices. In addition, the correlation of devices in the 1–70 Hz frequency band under closed and open-eye states was analyzed (Kam et al., 2019). The research results show that there are no significant dif- ferences in signal quality between the two devices, and the signals show a high degree of similarity. This finding confirms that the two portable EEG devices with different conductive media currently used have similar performance in practical applications.
In future research, we plan to enhance the study by balancing the sequence of experimental tasks, expanding the participant pool, and incorporating a greater variety of portable EEG devices, particularly those equipped with dry electrodes. These improvements aim to establish a more robust evaluation system and enable a more precise assessment of portable electrode devices.
REFERENCES
Ahn, J. W., Ku, Y. and Kim, H. C. (2019) “A Novel Wearable EEG and ECG Recording System for Stress Assessment”, Sensors, 19(9), p. 1991. Aznan, N. K. N. et al. (2019) “Using Variable Natural Environment Brain-Computer
Interface Stimuli for Real-time Humanoid Robot Navigation”, in 2019 Interna- tional Conference on Robotics and Automation (ICRA). IEEE, pp. 4889–4895. Bashivan, P., Rish, I. and Heisig, S. (no date) “Mental State Recognition via Wearable EEG”. Brown, L. et al. (2010) “A low-power, wireless, 8-channel EEG monitoring headset”,
in 2010 Annual International Conference of the IEEE Engineering in Medicine and Biology. IEEE, pp. 4197–4200. Dabbaghian, A. et al. (2019) “A 9.2-gram fully-flexible wireless dry-electrode headband for non-contact artifact-resilient EEG monitoring and programmable diag- nostics”, Proceedings - IEEE International Symposium on Circuits and Systems, 2019-May. Di Flumeri, G. et al. (2019) “The dry revolution: Evaluation of three different EEG
dry electrode types in terms of signal spectral features, mental states classification and usability”, Sensors (Switzerland), 19(6), pp. 1–21. Freeman, F. G. et al. (2004) “An evaluation of an adaptive automation system using a cognitive vigilance task”, Biological Psychology, 67(3), pp. 283–297. doi: 10.1016/j.biopsycho.2004.01.002. Harke Pratama, S. et al. (2020) “Signal Comparison of Developed EEG Device and
Emotiv Insight Based on Brainwave Characteristics Analysis”, Journal of Physics: Conference Series, 1505(1), p. 012071. Haueisen, J. et al. (2020) “Novel dry electrode EEG headbands for home use: Comparing performance and comfort”, Current Directions in Biomedical Engineering, 6(3), pp. 0–3. Hu, F. et al. (2022) “Research on Fatigue Driving State Recognition Method Based
on Multi-feature Fusion”, Hunan Daxue Xuebao/Journal of Hunan University Natural Sciences, 49(4), pp. 100–107. Jiang, X., Bian, G. Bin and Tian, Z. (2019) “Removal of artifacts from EEG signals: A review”, Sensors (Switzerland), 19(5), pp. 1–18.
Systematic Comparison of Signal Quality 85
Kam, J. W. Y. et al. (2019) “Systematic comparison between a wireless EEG system with dry electrodes and a wired EEG system with wet electrodes”, NeuroImage, 184(August 2018), pp. 119–129. Kezi Selva Vijila, C. et al. (2007) “Artifacts removal in EEG signal using adaptive
neuro fuzzy inference system”, Proceedings of ICSCN 2007: International Con- ference on Signal Processing Communications and Networking, pp. 589–591. doi: 10.1109/ICSCN.2007.350676. Li, C. L. et al. (2011) “EEG analysis for cognitive interference effects in a Stroop task”, International Conference on Control, Automation and Systems, pp. 348–351. Liotti, M. et al. (2000) “An ERP study of the temporal course of the Stroop color-
word interference effect”, Neuropsychologia, 38(5), pp. 701–711. Marcantoni, I. et al. (2023) “Ratio Indexes Based on Spectral Electroencephalographic Brainwaves for Assessment of Mental Involvement: A Systematic Review”, Sensors, 23(13). Marini, F. et al. (2019) “A comparative evaluation of signal quality between a
research-grade and a wireless dry-electrode mobile EEG system”, Journal of Neural Engineering, 16(5), p. 054001. Morán, A. and Soriano, M. C. (2018) “Improving the quality of a collective signal in a consumer EEG headset”, PLOS ONE. Edited by D. Marinazzo, 13(5), p. e0197597. Phneah, S. W. and Nisar, H. (2017) “EEG-based alpha neurofeedback training for
mood enhancement”, Australasian Physical and Engineering Sciences in Medicine, 40(2), pp. 325–336. Radüntz, T. (2018) “Signal Quality Evaluation of Emerging EEG Devices”, Frontiers in Physiology, 9(FEB), pp. 1–12. Rahman, M. M. et al. (2021) “Recognition of human emotions using EEG signals:
A review”, Computers in Biology and Medicine, 136(August), p. 104696. Szu, H. H., Tran, B. Q. and Lalonde, F. (2014) “Noninvasive detection of brain order-disorder transitions using functional EEG”, SPIE Newsroom. Wyckoff, S. N. et al. (2015) “Validation of a wireless dry electrode system for elec-
troencephalography”, Journal of NeuroEngineering and Rehabilitation, 12(1), p. 95. Zhang, Y., Ji, X. and Zhang, S. (2016) “An approach to EEG-based emotion recognition using combined feature extraction method”, Neuroscience Letters, 633, pp. 152–157.
LISTED IN THE AHFE DIGITAL BOOKSTORE CATALOGUE
Explore the complete digital volume
Ergonomics In Design
Read this individual research paper free through the original publisher, or explore the full digital proceedings book.
ISBN 978-1-964867-05-2
Explore this ISBN in the AHFE Bookstore ↗Listed in the July 2026 bookstore catalogue; search by ISBN to confirm current availability · Digital book purchase optional