Zehong Wei, Jiaxin Wang, Lei Shi, Qingju Wang, Yuanyuan Ren, Xuelian Zheng (2024). Driving Fatigue Recognition Based on the Combination of Multimodal Features. In: Advances in Human Factors of Transportation. AHFE Open Access, vol. 148, pp. 441–451. https://doi.org/10.54941/ahfe1005235
Effective identification of driving fatigue is extremely important for reducing casualties and property losses. Therefore, this paper proposes a driving fatigue recognition method based on the combination of multimodal features. Firstly, multimodal features based on photoplethysmography, eye state and vehicle motion are extracted according to the physiological and driving characteristics of driving fatigue. Secondly, C-SVM-RFE algorithm is used to optimize the features for improving the accuracy of the driving fatigue recognition. Finally, Support Vector Machine is used to establish the driving fatigue recognition model. In order to validate the driving fatigue recognition model, the photoplethysmography data, facial video data and vehicle motion data of 30 subjects in different driving states were collected, and then were processed using the above process. The results show that the model has a high accuracy in recognizing the fatigue state of the samples consisting of data from 30 subjects. It can be concluded that the method of driving fatigue recognition based on the combination of multimodal features can provide a means of driver monitoring for the traffic safety management, and reduce traffic accidents caused by driving fatigue.
When drivers are in a state of fatigue, their physiological function and ability to control the vehicle decrease dramatically, which is very likely to cause road traffic accidents, so it is of great significance to identify the driving fatigue state effectively (Li et al., 2018).
In recent years, the detection of driving fatigue state is mainly based on three types of indicators: drivers’ physiological information, drivers’ appear- ance information, and vehicle motion information. Ce Zou (2018) relies on deep learning for driving fatigue detection based on three physiological sig- nals of drivers’ EEG, EMG and ECG. Niu et al. (2013) selected three ocular parameters, namely, PERCLOS, blinking frequency and gaze direction, to detect driving fatigue. Assari et al. (2011) developed a driver fatigue moni- toring system based on three appearance indicators, namely, eyebrow raising,
yawning, and eye closure. Xu et al. (2015) selected a decision tree to deter- mine the driving fatigue level based on vehicle metrics such as lane offset value, steering wheel speed and steering wheel reversal rate.
Driving fatigue recognition based on these three types of indicators has limitations. Detection based on drivers’ physiological information is often intrusive to drivers, which will increase the burden for normal driving; detection based on drivers’ appearance information is easily affected by envi- ronmental factors and light intensity; Road alignment and drivers’ driving styles have too much influence on the vehicle motion information, which has a low generalization ability.
Therefore, driving fatigue recognition based on multimodal information has become popular (Wang, 2020; Fang, 2018). This paper chooses the com- bination of low invasive drivers’ physiological information, drivers’ appear- ance information and vehicle motion information as the driving fatigue recognition indexes, aiming to improve the inadequacy of single-indicator recognition.
EXTRACTION OF DRIVING FATIGUE FEATURES Extraction of Heart Rate and Heart Rate Variability Features
Driving fatigue is closely related to cardiac autonomic nervous system activ- ity. Therefore, heart rate (HR) and heart rate variability (HRV) have become important indicators to reflect the fatigue state of drivers.
The time-domain features selected in this paper include the average NN intervals (AVNN), the average heart rate (AVHR), the standard deviation of NN intervals (SDNN), the standard deviation of difference between adjacent NN intervals (SDSD), the square root of the mean of the sum of the squares of differences between adjacent NN intervals (RMSSD), the number of pairs of adjacent NN intervals difference by more than 50ms divided by the total number of all NN intervals (PNN50), and the formulas are as follows: N X AVNN = 1
Equations and mathematical formulas are available in the original paper PDF.
NN "
Equations and mathematical formulas are available in the original paper PDF.
PN
N X
NNi + 1 −NNi
v u u u t 1 N −2
N −1
2
NNi −NN
v u u t 1 N −1 i−1 N−1 X
2 (5)
NNi + 1 −NNi
N −1 × 100 (6) where N is the number of NN intervals, NNi is the value of the ith NN interval, NN is the value of the AVNN.
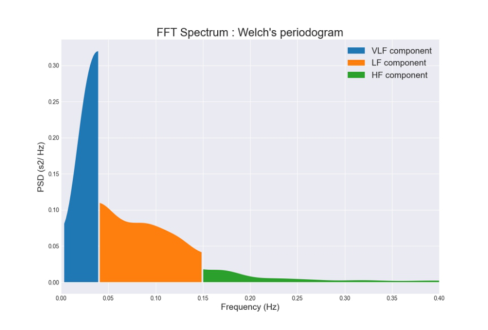
In this paper, HRV is analysed in the frequency domain using power spectrum estimation to decompose HRV into different frequency domains (Figure 1). Three HRV frequency-domain features are extracted, which are the high-frequency power HF, the low-frequency power LF, and the ratio of the two of them, LF/HF.
Figure 1: Heart rate variability power spectrum analysis.
The Poincaré plot is used to extract the nonlinear features of HRV. An ellipse is fitted to the Poincaré plot, and the semi-short and semi-long axes of the ellipse are named SD1and SD2, respectively. From SD1, SD2, and the ratio of them, three important HRV nonlinear features can be extracted:
2
NNi −NNi + 1
v u u t 1 N −1
2 (7)
2 NNi + NNi + 1 −2NN
v u u u t 1 N −1
2 (8)
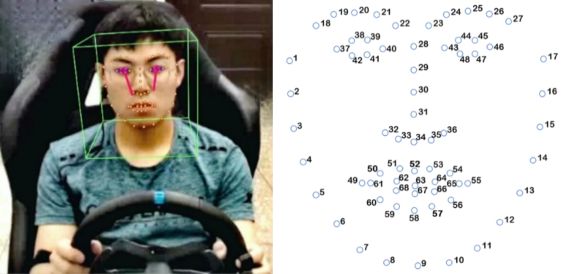
When drivers are in a fatigue state, they usually show some behaviors such as staring blankly, closing their eyes for a long time. Therefore, the OpenFace toolkit (Baltrusaitis et al., 2018) is utilized to obtain the 68 facial landmarks (Figure 2). Indicators commonly used to characterize driver fatigue include PERCLOS, blink frequency, and blink speed. All of these features can visually reflect the level of driving fatigue.
PERCLOS (Percentage of Eyelid Closure) refers to the percentage of total time that the eyes are closed for a certain period of time. In this paper, the eyelid closure threshold chosen is 70%. PERCLOS is calculated as follows:
Figure 2: Detection of facial landmarks.
where EARl is left eye aspect ratio, EARr is right eye aspect ratio, Max(EAR) is the maximum value of EAR.
(2) During a single blinking behavior, T denotes the total duration of the blinking behavior, and t denotes the length of time when the eyelid closure is at 70% and above. According to the definition of PERCLOS, there is the following calculation formula:
T × 100% (10) Significant differences in blink speed and blink frequency between drivers in alert and fatigued states. In this paper, blink speed (Tb) and blink frequency (Bf) are used as features to characterize driving fatigue. The blink speed is obtained by calculating the average value of the blink duration per unit of time.
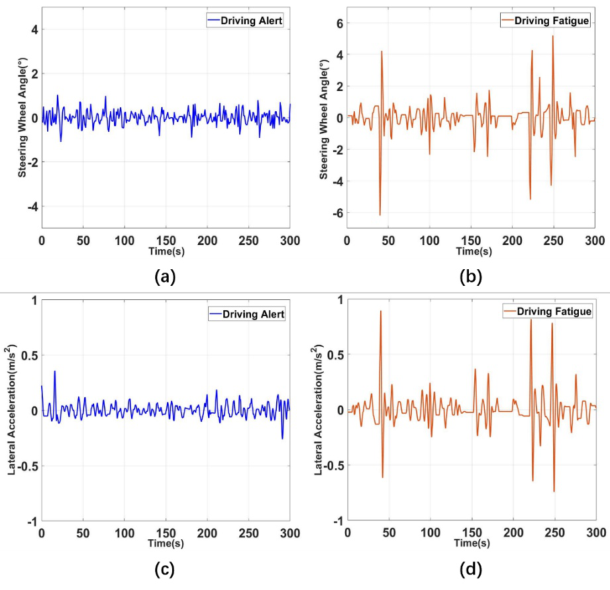
Extraction of Vehicle Motion Features During vehicle driving, the change of vehicle lateral position is mainly deter- mined by the driver’s manipulation of the steering wheel. Therefore, the waveforms of vehicle lateral acceleration under different states are extremely similar to their corresponding steering wheel angle waveforms, and the dif- ference in the pattern of change of vehicle lateral acceleration under the two states is obvious (Figure 3).
Thus, in order to effectively characterize the driving fatigue, five vehicle motion features were extracted, namely, the mean AVSA and standard devia- tion SDSA of the absolute value of the steering wheel angle, the steering wheel steering reversal rate SRR, and the mean AVLA and standard deviation SDLA of the absolute value of the vehicle lateral acceleration.
Driving Fatigue Recognition Based on the Combination of Multimodal Features 445
Figure 3: Trends of steering wheel angle and vehicle lateral acceleration under different driving conditions.
FEATURES SELECTION It is necessary to screen out the features that have a high degree of impor- tance in recognizing the fatigue state of the driver. This paper is based on the C-SVM-RFE algorithm (Wang, 2015) for feature selection.
Raw Features Set Construction In this paper, we use Fi to denote the feature vector and Li to denote the feature label (−1 for the driving alert class label; 1 for the driving fatigue class label) to build the raw features set:
Since the large differences in the values of features in Fi will affect the fea- ture importance assessment, the feature vectors should be normalized before feature selection.
Feature Importance Analysis For D = {(F1, L1), (F2, L2), ..., (Fn, Ln)}, Fi ∈Rd, Li ∈{−1, + 1}, a samples set consisting of n samples and d features, Fi is the features set of the training samples, and Li is the class label of the training samples, which is binary clas- sified using SVM, the objective function and constraints of the optimization process are as follow:
ωTxi + b
ωTx + b
The change in the objective function J when the ith feature fi is removed is named 1J :
1J(i) ≈(1ωi)2 (15) It can be seen that when a feature is removed, the size of ω2 corresponding to it is consistent with the contribution of the feature to the classification effect of this classification, so ω2
i is chosen as the feature importance ranking index, and the larger the value of ω2
i , the greater the contribution of the feature to the classification effect. According to the weight of each feature in the original feature set in the SVM classification process, the importance of each feature is ranked.
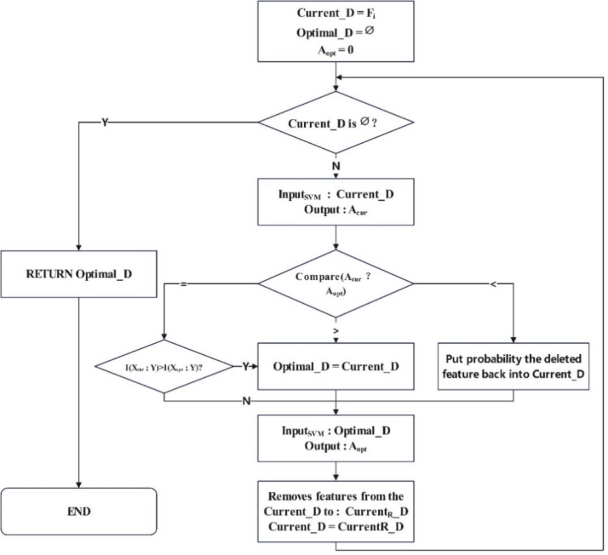
Feature Selection Based on C-SVM-RFE Algorithm Support Vector Machine Recursive Feature Elimination (SVM-RFE) algo- rithm (Guyon et al., 2002) is widely used in classification. In the SVM-RFE algorithm, if a feature that actually contains a large amount of information is deleted in a certain iteration, the feature will not be discussed again in all subsequent iterations, which makes some features that actually contain a large amount of information not be analysed efficiently. Therefore, this paper uses a recursive feature elimination method with correlation-support vector machines (C-SVM-RFE) algorithm (Figure 4).
Driving Fatigue Recognition Based on the Combination of Multimodal Features 447
Figure 4: Flowchart of the C-SVM-RFE algorithm.
After each round of feature elimination, the classification accuracy Acur under the current feature subset Current_D is compared with the classifi- cation accuracy Aopt under the optimal feature subset Optimal_D before iteration. if the accuracy improves, the Current_D is updated to Optimal_D; if it is flat, the feature subset with a larger value of mutual information with the class labels is selected as the new optimal feature subset; if it decreases, use the simulated annealing criterion to probabilistically reevaluate the previously removed features:
!
1000 ×
Acur −Aopt Exp > random (0, 1) (16) pNumlf
where Numlf is the number of features remaining in the current iteration; random (0, 1) is a random number from 0 to 1.
Each time a removed feature is reevaluated, the selection criterion for that feature is to use the Pearson’s Correlation Coefficient to find the fea- ture among the deleted features that has the least correlation with the one in Current_D to be put back into Current_D.
DRIVING FATIGUE RECOGNITION MODEL BASED ON SVM In this paper, when constructing the driving fatigue recognition model, the samples set after feature selection is used as the input of the model, and the
alert and fatigue are used as the output of the model, and the 5-fold cross- validation method is chosen to divide the training set and the test set. The RBF kernel function is selected to construct the SVM model, which is highly tolerant to sample data with high complexity and high variability, and has good nonlinear approximation ability. In order to ensure the classification effect of the model, the model parameters need to be optimized. The per- formance of the model constructed in this paper is mainly determined by the penalty factor C and the parameter γ of the RBF kernel function. We use the grid search method to find the optimal model parameters to max- imize the SVM recognition accuracy, where C is in the range [0.1, 100] and γ is in the range [0.01, 10].
A commonly used model evaluation method for dichotomous problems is the Concombination Matrix evaluation method (Table 1).
Table 1. Concombination matrix.
Table available in the original PDF paper.
Predicted positive Predicted negative Actual positive True Positive (TP) False Negative (FN) Actual negative False Positive (FP) True Negative (TN)
Based on the above concombination matrix, five evaluation metrics: Accu- racy, Precision, Recall, Specificity, and F1-score can be calculated to evaluate the performance of the classifier.
EXPERIMENTAL VERIFICATION Data Collection
This paper designs a experiment based on the driving simulator. The subjects were required to have a legal driver’s license, be able to drive the vehicle proficiently, be in good physical condition, not consume alcoholic beverages for 24 hours prior to conducting the experiment, and not have 3D vertigo syndrome. A total of 30 subjects were recruited for the simulated driving experiment, of which, 19 were male subjects and 11 were female subjects. The basic information of the subjects is shown (Table 2).
Table 2. Basic information of the subject.
Table available in the original PDF paper.
Age range 20–40 Driving age range 1-20 Average 24.73 Average 3.67 Standard deviation 3.75 Standard deviation 3.43
In order to induce driving fatigue, the driving scenario of this experiment was set up as a monotonous circular highway (Rossi et al., 2011). The high- way is a bidirectional four-lane highway with a single lane width of 3.75 m. The speed limit is 100–120 km/h for the left lane and 60–100 km/h for the right lane. The total length of the road section is about 60 km, which is divided into two sections of straight roads and two sections of curved roads,
Driving Fatigue Recognition Based on the Combination of Multimodal Features 449
of which each section of straight roads is 20 km long and each section of curved roads is about 10 km (Figure 5).
Figure 5: Experimental road shape.
Normally, 14:00–16:00 and 23:00–01:00 are the high incidence of driving fatigue, the experiment chose 14:30 as the start time of the simulation test, and the total length of a single experiment was 90 min the test procedure was as follows.
1. The subjects came to the test site 20 min in advance, filled in the basic information form, wore the physiological index collection equipment, and clarified the experiment requirements. 2. The subjects were given a 10-minute test drive to familiarize them- selves with the operation of the driving simulator, including steering, acceleration and deceleration, etc. 3. Subjects drove the vehicle maintaining a speed range of 100km/h– 120km/h in the left lane for 60 consecutive minutes, during which driv- ing fatigue state was naturally induced. Staff questioned and recorded the subjective fatigue state of the subjects every 5 minutes until the end of the test.
Features Optimization Results The results of ranking the importance of features are shown in Table 3.
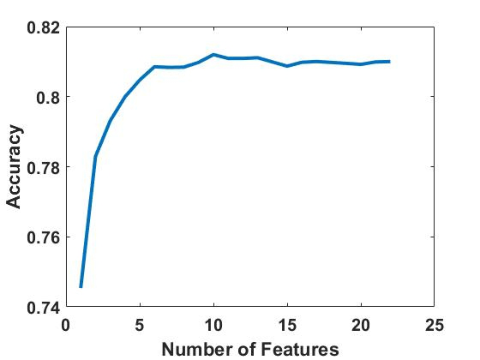
The classification accuracy under different number of features is obtained using C-SVM-RFE algorithm. When the number of feature dimensions starts to increase, the classification accuracy rate grows faster when the number of features is small, and the classification effect is significantly improved; when the number of feature dimensions reaches 6, the classification accuracy rate becomes a slow growing trend; when the number of feature dimensions reaches 10, the classification accuracy rate reaches the maximum; after that, with the increase of the number of feature dimensions, the classification accu- racy rate tends to be stable, and even shows a decreasing trend (Figure 6). Therefore, this paper selects the feature subset corresponding to the maxi- mum classification accuracy as the optimal feature subset, which consists of 10 types of features: Tb, AVNN, AVHR, PERCLOS, Bf, LF/HF, SDLA, SRR, RMSSD, and SD1/SD2.
Figure 6: Classification accuracy with different number of features.
DRIVING FATIGUE RECOGNITION RESULTS In this paper, the collected multimodal data are segmented into 5-minute- long segments, and a total of 312 samples are constructed through feature engineering, each containing 10 classes of features.
The parameters corresponding to the highest average classification accu- racy were found through a grid search as C = 1.779 and γ = 0.214. The 5-fold cross-validated driving fatigue recognition results are shown in Table 4.
Table 4. Driving fatigue recognition results.
Table available in the original PDF paper.
Evaluation indicators
Recognition result Accuracy Precision Recall Specificity F1 82.40% 81.43% 86.36% 77.97% 83.82%
Driving Fatigue Recognition Based on the Combination of Multimodal Features 451
As can be seen from the model evaluation indexes, except for Specificity, all other indexes reach more than 80%, among which Recall is relatively the highest. In this paper, Recall represents the probability that the model successfully recognizes the fatigue state when the driver is fatigued, while Specificity represents the probability that the model successfully recognizes the awake state when the driver is alert. In practical application, the harm of unsuccessfully detecting the driving fatigue is greater than the harm of misjudging, so it is considered that the driving fatigue recognition model is effective and can provide a reference for the detection of driving fatigue.
CONCLUSION
This paper proposes a driving fatigue recognition method based on the combination of multimodal features, the results are mainly as follows:
1. Driving fatigue features are extracted based on photoplethysmography, eye states and vehicle motion, and the extracted features are optimized using the C-SVM-RFE algorithm. 2. The driving fatigue recognition model is constructed based on SVM, and the multimodal data of 30 drivers in different driving states are collected through driving simulation experiments for verification.
The results show that the recognition method based on the combination of human-vehicle multimodal features proposed in this paper has high recog- nition accuracy of driving fatigue, which is of practical significance for improving driving safety and reducing road traffic accidents caused by driver fatigue.
REFERENCES
Assari, M. A., Rahmati, M. (2011). Driver drowsiness detection using face expression recognition. 2011 IEEE international conference on signal and image processing applications (ICSIPA), pp. 337–341. Baltrusaitis, T., et al. (2018). OpenFace 2.0: Facial Behavior Analysis Toolkit. IEEE
Computer Society, 2018, pp. 59–66. Fang, Y. (2018). Research on Driving Fatigue Detection Method Based on Information Fusion. Master thesis, Harbin Institute of Technology. Guyon, I., et al. (2002). Gene Selection for Cancer Classification using Support
Vector Machines. Machine Learning, 2002, 46(1), pp. 389–422. Li, Y. Y., Yamamoto, T. and Zhang, G. (2018) ‘The effect of fatigue driving on injury severity considering the endogeneity’, Journal of Safety Research, 64, pp. 11–19. Niu, Q. N., et al. (2015) Detection of driver fatigue based on eye movements, Journal
of Harbin Engineering University, 36(3), pp. 394–398. Wang, G. D. (2020). Research on Vehicle Driver Fatigue Detection Method Based on Multi-feature Fusion. Master thesis, Shandong University. Wang, J. (2015). The research of Feature Selection Algorithm Based on SVM-PFE.
Master thesis, Dalian University of Technology. Xu, C., et al. (2015). Driver Drowsiness Level Analysis and Predication based on Decision Tree. Journal of Tongji University (Natural Science), 2015, 43(1), pp. 75–81. Zou, C. (2018) Research on Driving Fatigue Detection Method Based on Multi
Physiological Information Fusion. Master thesis, Yanshan University.
LISTED IN THE AHFE DIGITAL BOOKSTORE CATALOGUE
Explore the complete digital volume
Advances in Human Factors of Transportation
Read this individual research paper free through the original publisher, or explore the full digital proceedings book.
ISBN 978-1-964867-24-3
Explore this ISBN in the AHFE Bookstore ↗Listed in the July 2026 bookstore catalogue; search by ISBN to confirm current availability · Digital book purchase optional