Lei Shi, Youlin Zhang, Jicun Xu, Xuelian Zheng, Xiao Tong Cui, Qingju Wang (2023). Driving Behavior Analysis Based on Weighted Cost Function. In: Ergonomics In Design. AHFE Open Access, vol. 77, pp. 636–643. https://doi.org/10.54941/ahfe1003423
Drivers are the main participants of road traffic, and analyzing their driving behavior characteristics is beneficial to road safety and personalized vehicle insurance formulation. Most existing studies describe driving behavior characteristics by constructing various driving behavior features of driving data. However, drivers' pursuit of different property is the main reason to form different driving behavior characteristics. Therefore, this paper proposes a novel framework, which uses the weight of cost function to represent driving behavior characteristics. Firstly, for every driver’s basic driving maneuver, cost function representing comfort, safety and quickness is calculated. Secondly, for every driver, weights of each characteristic are calculated by entropy weight method. Finally, based on these weights, driving style is clustered by k-means. Different than those previous studies can only describe driving behavior characteristics from results, this paper describes driving behavior characteristics from causes. Therefore, the framework proposed in this paper is helpful to deeply understand differences between various driving behavior characteristics, and beneficial for describing driver decision making. The empirical results on driving data implies that this framework can efficiently recognize driving behavior characteristics.
Driving style analysis has become the focus of public attention with the deve- lopment of technology, which plays a vitally important role in road safety (Guo, et al., 2013; Sagberg, et al., 2015; Kashevnik, et al., 2019), eco-driving (Di Cairano, et al., 2014; Xu, et al., 2020), vehicle insurance (Handel, et al. 2014; Wei, et al., 2016), and intelligent vehicle design (Martinez, et al., 2016; Wang, et al., 2017). Therefore, efficiently recognizing driving styles has been the research focus in recent years.
So far, both subjective and objective methods have been used in previous researches. Generally, subjective methods mostly adopted the questionnaire (Orit, et al., 2004; Ishibashi, et al., 2007). Researchers designed questionnai- res according to their experience and asked drivers to fill them out so that they could identify different drivers. In recent years, objective methods have
Driving Behavior Analysis Based on Weighted Cost Function 637
become more and more popular, as they’re more objective and easier to imple- ment. For objective methods, most studies constructed statistical features or function features on driving data. These features were used to describe the statistical distributions between various driving behaviors, so those represent diversities of driving behavior characteristics. Using these features, resea- rchers have applied well-trained classifiers such as XGBoost (Shi, et al., 2019), the Markov model (Guardiola, et al., 2014), the Semi-Supervised Tri- CatBoost (Liu, et al., 2020), structural equation models (Zhao, et al., 2019), the semi-supervised support vector (Wang, et al., 2017), and neural networks (Chen, et al., 2021; Chen, et al., 2019) to identify driving styles.
However, the above features just only represent driving behavior from results level, lacking of analysis for causes of driving behavior. As a result, the existed methods are not much help in understanding driving behavior dee- ply. Beyond that, existed studies may use classifiers to identify driving styles based on labelled data, which acquiring labelled data needs much funding, resources and manpower.
The paper proposes a novel framework for driving style analysis. It uses the weight of cost function to represent driving behavior characteristics and clustering driving styles according to k-means. Considering drivers’ decision preferences, the framework constructs features by quantifying the causes of driving behavior. Compared with the previous studies, which only constru- cted features of driving data, this paper can have a more comprehensive understanding of driving behavior decisions. In addition, different from pre- vious studies, this framework uses k-means to cluster driving styles, which overcomes the disadvantages of manually labelling data.
DATA DESCRIPTION The data set used in this paper is sampled by experiments, which are car- ried out in the RADS 8 DOF Panoramic Driving Simulation. The test route contains 11 curves and the total round trip is about 10.35 km. 16 drivers (10 males, 6 females; age range 28∼50 years old, average age = 29.8, stan- dard deviation (SD) = 2.7; driving experience 0∼12 years, average = 7.6 years, SD = 3.3) are paid for their participation in this study, and all drivers are required to drive the vehicle in similar conditions to minimize potential disturbance caused by external factors.
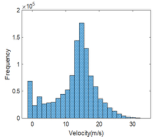
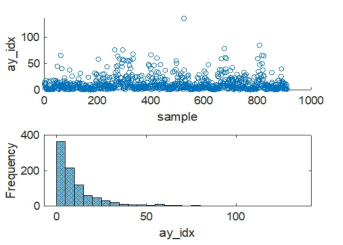
The data recorded by the RADS 8 DOF Panoramic Driving Simulation are recorded at a sampling rate of 60 Hz. Because raw data are volatile, we used a moving-average algorithm to smooth the data. The statistical results from the processed data are shown in Figure 1. The velocity falls in the 0∼34 m/s range, longitudinal acceleration falls in the −7 m/s2∼6 m/s2 range, lateral acceleration ranges from −7 m/s2 to 9 m/s2, and longitudinal jerk ranges from −6m/s3∼6m/s3.
METHOD
In driving, the driver takes the driving goal realization as the premise. They comprehensively consider the pursuit of various properties. Drivers make driving decision based on the value of various properties.
(a) velocity (b) longitudinal acceleration
(c) lateral acceleration
(d) longitudinal jerk
Figure 1: The frequency distribution histograms of processed variables.
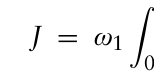
Driving Cost Function and Property Weights Drivers make driving decision based on the value of various properties and on the value of cost function. We choose velocity, longitudinal acceleration, late- ral acceleration and jerk to construct the cost function so as to representing drivers’ pursuits for comfort, safety and quickness:
Z T
Z T
Z T
Z T
2 dt
Equation reproduced from the original PDF.
vd −v
0
0 ay2dt + ω4
0 jerk2dt + ω3
0 ax2dt + ω2
(1) Where, T is the duration of the driving manoeuvre; ω1, ω2, ω3, ω4 are weights for different properties; vd is the desire velocity, and vd = 80km/h.
The first and the second item in equation (1) represent the pursuit of com- fort, the third item represents the pursuit of safety, and the last item represents the pursuit of quickness.
In driving, drivers adjust the weights of each item in equation (1) in order to make the total cost keeps the minimum. Property weight in the cost function describes driver decision-making preference, which is useful for driving style recognition. Therefore, driving behavior features could be described by the property weight, and driving style could be recognized according to those weights.
Road alignment has a salient influence on drivers operation and the cost value. Therefore, sections of driving-straight and turning based on trajectory radius were extracted from the origin driving data. Furthermore, the sections of driving-straight and turning were divided into three types according to vehicle longitudinal acceleration, namely accelerating, driving almost at con- stant speed and decelerating. Therefore, the original driving data was divided into sections by the six driving manoeuvres, and the manoeuvres are listed in Table 1.
Table 1. The six driving manoeuvres.
Table available in the original PDF paper.
Manoeuvres according to vehicle longitudinal
Manoeuvres according to road alignment
acceleration
Driving-straight accelerating driving at constant speed decelerating Turning accelerating driving at constant speed decelerating
Driving Behavior Analysis Based on Weighted Cost Function 639
Driving Style Clustering Weights of the four properties show a driver preference, and the bigger weights imply that the driver prefer the corresponding property. Therefore, the four property weights were used to describe driving characteristics, and k-means was used to cluster different driving style.
RESULTS AND ANALYSIS Property Weights
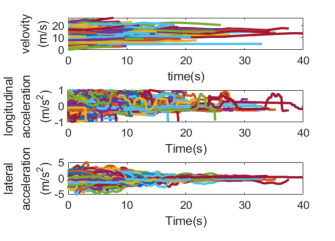
Variable profiles of different driving manoeuvres extracted according to velo- city, longitudinal acceleration, and lateral acceleration are shown in Figure 2.
(b) accelerating when turning
(a) accelerating when driving-straight
(c) driving at constant speed when driving-straight
(d) driving at constant speed when turning
(f) decelerating when turning
(e) decelerating when driving-straight
Figure 2: Variable profiles of different driving manoeuvres.
It’s obviously that statistical distribution of variables for different driving manoeuvres are distinctly different.
On each driving section, the four items in equation (1) were calculated. Then, property weights were obtained by entropy weight method for each driver.
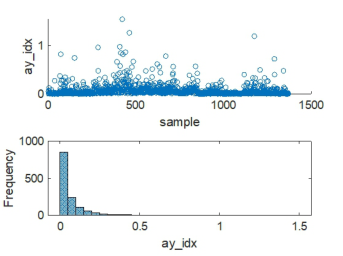
For one of the participants, the four properties are shown in Figure 3 and Figure 4. Specifically, statistical distribution of lateral acceleration for driving-straight is concentrated, which indicates that there is little difference in safety when driving straight because of the influence of road alignment. In addition, statistical distribution of jerk for turning is more concentrated than driving-straight, and the variability of velocity and longitudinal acceleration has little differences between driving-straight and turning.
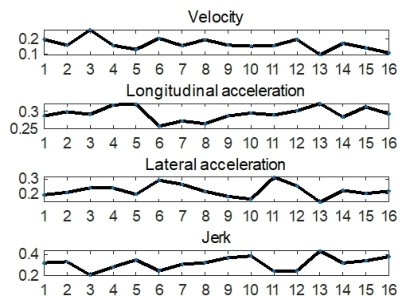
Entropy weight method was used to calculate property weights for every driver (as shown in Figure 5). It’s obvious that the pursuits of quickness among drivers are basically the same. However, the pursuit of comfort and safety varies from person to person. The comfort is often sacrificed when drivers prefer safety, and the quickness is often sacrificed when drivers prefer comfort.
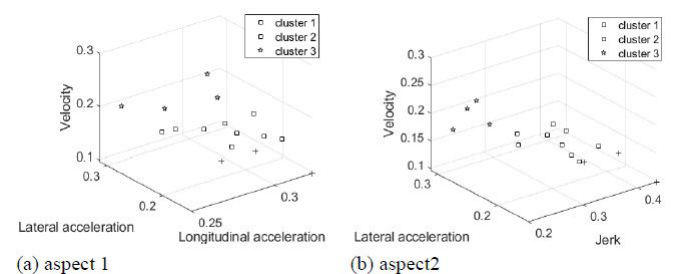
Driving Style Most studies classify driving style into three clusters: cautious, normal and aggressive. So, we also classified driving style into three clusters. The cluster center of each cluster is shown in Table 2.
(a) velocity (b) longitudinal acceleration
(c) lateral acceleration (d) jerk
Figure 3: Properties when driving-straight.
Driving Behavior Analysis Based on Weighted Cost Function 641
(a) velocity (b) longitudinal acceleration
(c) lateral acceleration (d) jerk
Figure 4: Properties when turning.Figure 5: Weights of properties for different drivers.
In Table 2, the ω1 and ω2 decrease successively among the three clusters, but ω3 and ω4 increase successively. Therefore, we draw conclusion that the cluster1 pay more attention to comfort and less attention to quickness. On the contrary, the cluster 3 prefer quickness than comfort. Therefore, the cluster 1 is cautious, the cluster 3 is aggressive and the cluster 2 is normal.
The details of driving style clustering results in different aspects are shown in Figure 6. The coordinate axes represent property obtained by different variables, and points represent samples. In different perspectives,
Table 2. Cluster center of driving style clusters.
Table available in the original PDF paper.
Driving style clusters Weights of properties ω1 ω2 ω3 ω4
Figure 6: Clustering results of driving style in different aspect.
property weights can be used to describe driving behavior characteristics and effectively recognize various driving style.
CONCLUSION
This paper proposed a novel framework to describe driving behavior cha- racteristics based on weighted driving cost function. Property weights were used to describe driving behaviour characteristics, and driving styles were clustered according to property weights in the cost function of each dri- ver. We evaluated the effectiveness of this framework on real driving data. The results implied that the proposed framework could effectively distin- guish different driving styles, and explain the causes of different driving behaviors.
However, there still are some limitations in this paper. The types of dri- ving manoeuvres are simple and subjective in this paper, so that, the data mining method will be applied to obtain more complex and subjective dri- ving manoeuvres. In addition, how to further analyse driving styles using the nonlinear features about the property weights will be explored in the future work.
REFERENCES
Between Driver Characteristics and Driving Safety Using Structural Equation Models, Transportation Research Part F: Traffic Psychology and Behaviour, Volume 62.
Driving Behavior Analysis Based on Weighted Cost Function 643
Chen C., Liu Q., Wang X., Liao C., and Zhang D. (2021). Semi-Traj2Graph: Identifying Fine-Grained Driving Style with GPS Trajectory Data Via Multi-Task Learning, IEEE Trans. Big Data, Volume 8, Issue 6. Chen J., Wu Z., and Zhang J. (2019). Driver Identification Based on Hhidden Feature
Extraction by Using Adaptive Nonnegativity-Constrained Autoencoder, Applied Soft Computing, Volume 74. Di Cairano S., Bernardini D., Bemporad A., and Kolmanovsky I. V. (2014). Stochastic MPC with Learning for Driver-Predictive Vehicle Control and Its Application to HEV Energy Management, IEEE Transactions on Control Systems Technology, Volume 22, Issue 3. Guo F. and Fang Y. (2013). Individual Driver Risk Assessment Using Naturalistic
Driving Data, Accident Analysis and Prevention, Volume 61. Handel P. and Ohlsson J. (2014). Smartphone-Based Measurement Systems for Road Vehicle Traffic Monitoring and Usage-Based Insurance, IEEE Systems Journal, Volume 8, Issue 4. Ishibashi M., Okuwa M., Doi S., and Akamatsu M. (2008), Indices for Characteri-
zing Driving Style and Their Relevance to Car Following Behavior, Transactions of the Society of Automotive Engineers of Japan, Volume 39. Kashevnik A., Lashkov I., and Gurtov A. (2019). Methodology and Mobile Application for Driver Behavior Analysis and Accident Prevention, IEEE Transactions on Intelligent Transportation Systems, Volume 21, Issue 6. Liu W. R., Deng K. Y., and Zhang X. Y. (2020). A Semi-Supervised Tri-CatBoost
Method for Driving Style Recognition, Symmetry, Volume 12, Issue 3. Martinez C. M., Heucke M., Wang F. Y., Gao B., and Cao D (2016). Driving Style Recognition for Intelligent Vehicle Control and Advanced Driver Assista- nce: A survey, IEEE Transactions on Intelligent Transportation Systems, Volume 19, Issue 3. Nai W., Chen Y., Yu Y., Zhang F., Dong D., and Zheng W. (2016). “Fuzzy Risk Mode
and Effect Analysis Based on Raw Driving Data for Pay-How-You-Drive Vehicle Insurance,” 2016 IEEE International Conference on Big Data Analysis (ICBDA), Hangzhou, China. Orit T. B. A., Mario M., and Omri G. (2004.) The Multidimensional Driving Style Inventory-Scale Construct and Validation, Accident Analysis and Prevention, Volume 36. Sagberg F., Piccinini G. F. B., and Engström J. (2015). A Review of Research on
Driving Styles and Road Safety, Human Factors, Volume 57, Issue 7. Shi X., Wong Y. D., Li M. Z.-F., Palanisamy C., and Chai C (2019). A Feature Learning Approach Based on XGBoost for Driving Assessment and Risk Prediction, Accident Analysis and Prevention, Volume 129. Wang W., Xi J., Chong A., and Li L. (2017). Driving Style Classification Using a
Semi-Supervised Support Vector Machine, IEEE Transactions on Human-Machine Systems, Volume 47, Issue 5. Wang W., Xi J., Liu C., and Li X. (2017). Human-Centered Feed-Forward Control of a Vehicle Steering System Based on a Driver’s Path-Following Characteristics, IEEE Transactions on Intelligent Transportation Systems, Volume 18, Issue 6. Xu J., Saleh M., and Hatzopoulou M. (2020). A Machine Learning Approach Captu-
ring The Effects of Driving Behavior and Driver Characteristics on Trip-Level Emissions, Atmospheric Environment, Volume 224. Zhao X., Xu W., Ma J., Li H., and Chen Y. (2019). An Analysis of the Relationship
LISTED IN THE AHFE DIGITAL BOOKSTORE CATALOGUE
Explore the complete digital volume
Ergonomics In Design
Read this individual research paper free through the original publisher, or explore the full digital proceedings book.
ISBN 978-1-958651-53-7
Explore this ISBN in the AHFE Bookstore ↗Listed in the July 2026 bookstore catalogue; search by ISBN to confirm current availability · Digital book purchase optional