Kaapo Seppälä, Kaisa Könnölä, Markus Krusberg, Teijo Lehtonen (2025). Content Forms and Information Presentation in Virtual Reality - Case: Communicating the Sustainability of Cruise Ships. In: Human Factors and Wearable Technologies. AHFE Open Access, vol. 175, pp. 88–97. https://doi.org/10.54941/ahfe1006362
New technologies open new possibilities to communicate with consumers. Virtual Reality (VR) creates an immersive environment using various content types, from audio to multisensory experiences. In this paper, we wanted to deepen understanding on different ways of sharing information in VR and Metaverse environments; how they are experienced and their effectiveness when different information sharing elements are present. We present the test results of the effect of selected aural and visual content types and their effectiveness in communicating sustainability-related themes to consumers.Combining the logged in-game data with the questionnaire answers, we found out that most players value text as least favourable content form to obtain information in VR environments. However, the learning outcome from text was on a par with the results from other content forms. The youngest age group showed a tendency to advance rapidly in the game, while prematurely quitting the game was observed most often within the eldest user segment. Overall results show a positive attitude towards the idea of presenting sustainability-related content in VR.
As consumers’ awareness regarding sustainability issues is growing, industry stakeholders are seeking new ways to increase sustainability transparency and more effective means of communicating it to consumers (Saarni et al., 2019). The evolution of new technologies opens new possibilities to communicate with consumers. This article is related to our research project Sustainability and Transparency in Shipbuilding Networks, which aimed in recognizing relevant sustainability indicators and how they can be communicated effectively to various consumer groups. In this article, we present the results regarding the effectiveness of communicating sustainability of cruise ships to consumers in different age groups or gender, using different content forms in a Virtual Reality (VR) application called SmartEcoCabin.
When researching sustainability transparency, our related research question can be stated as follows: What is the most beneficial content form
Content Forms and Information Presentation in Virtual Reality, Case 89
when communicating sustainability information in VR? Is any content form better over others in drawing and maintaining the attention of the user in a VR environment, and which is the most effective way to present the information and make the user understand the message.
We will first take a brief look to content forms and existing research. Then we go through our research setting which we followed during the first half of 2019. After that, we will provide a detailed description of the application that was used, followed by acquired results, further discussion and conclusions.
VIRTUAL REALITY AND CONTENT FORMS VR is a highly immersive form of linear or interactive multimedia, featuring a combination of different visual and aural content, such as text, still image, aural content, animation, videos, 3D objects and various multisensory elements (Bis, 2019), (Guan et al., 2010), (Obrist et al., 2016). In this paper, we refer to these as content forms. Visual elements and cues can be displayed hovering in front of the user as in heads-up-display or attached on the surfaces of objects in a VR scene. Aural content forms include speech, ambient sound, sound effects and music.
Visual and aural content is experienced differently in VR. Our visual sense has an orientation that we can adjust by turning our head or with eye movement. At any one point of time, we can only have a view in one direction with a certain viewport. Sounds can come from all directions, and the user can gain information from surroundings even without actively listening all the time (Nordahl and Nilsson, 2014). In some cases, aural content can compensate for a poor quality of visual content. This has been noted by (Kauhanen et al., 2017) while exploring the user experience (UX) of 360 degree videos played in VR. Other already existing, or potential in the future, ways to present information are haptic feedback and stimulation of the chemical senses, smell and taste. Examples of haptic input or feedback are touch, temperature, vibration and pressure (Search, 2015), (Serrano, 2016). In this research we focus on visual and aural content forms and exclude haptic and more advanced multisensory content as they were not used in the SmartEcoCabin.
RELATED WORK
Previous research about the creation of VR environments has already contributed to the necessary design elements behind immersive experience. However, the existing research related to content elements in VR has been focusing mostly on subjects other than corporate sustainability communication.
Kelling et al., (2018) were focusing on journalistic and cultural experiences that can be seen as a form of communication and therefore supporting our sustainability approach. They point out that immersion requires e.g. sense of presence, possibilities of exploration and a pleasant experience. They found out that the UX can be improved by adding audio and narration.
Kauhanen et al., (2017) focuses on video as a content form. 360-videos were found to be content that raise neutral to positive reactions even with
a relatively low picture quality. Due to development in cameras, the use of 360-photographs and videos as VR content form can be expected to increase in both recreational and educational applications.
The content forms and their effects have been frequently addressed in the application area of education. If we define education as communicating selected themes, VR provides us features that differ from other media. It allows the individuality of the message, allows the user to influence the content that reaches them, is insensitive to time and allows the user to be heavily involved in the transmitted content (Bis, 2019). Concerning the experience of presence, the more immersive the VR environment is, the more the human-computer-interface dissolves, even disappears, and the user is confronting pure information directly in visual, aural and haptic forms (Sánchez et al., 2000).
Similar to journalistic and cultural storytelling, the effectiveness of the VR-based education process also depends on the quality of the prepared training material, or on the quality of the prepared virtual training environment. To properly prepare the virtual environment, it is necessary to select the suitable content forms that are validated with the expected target audience (Marjanovic et al., 2018). In addition, visual cues were also found to be generally effective when they were tested and compared by Nolan (2015).
Makransky et al., (2018) found out in their research, that different types of pedagogical agents make a difference on the learning outcomes of boys and girls. Boys achieved better learning results when the pedagogical agent was a futuristic robot drone, whereas girls’ learning results were better when the pedagogical agent was a female scientist.
Olofsson (2017) focuses on investigating and measuring different methods of displaying text and receiving text input in VR environments. The results of Olofsson’s interactive user study show that when using the same relative text size, the view distance has a significant effect and that the majority of the test participants with no earlier experience of VR environments, preferred the stationary text over the hand-held text.
RESEARCH SETTING The aim of this research is to gain understanding on different ways to share information in VR; how they are experienced and what is their effectiveness when different information sharing elements are present.
The first research question is; Are there differences in experiencing the following visual content types: 2D video, text and 3D animation?
The second research question is; How different age groups and genders experience a gamified information sharing VR application?
The VR game developed and used as the research tool included a cabin of a future cruise ship with information hotspots for sharing sustainability information and smart solutions used onboard. For sharing the information, audio, 2D video, text and 3D animation were used. We refer to the testers also as players.
Testing with a real audience took place on the SciCruise (a 23h science workshop cruise for school children), and in two maritime industry seminars.
Content Forms and Information Presentation in Virtual Reality, Case 91
In the SciCruise, the testers were pupils, students, teachers, parents and event organisers. In the seminars most testers were adult maritime professionals. A HTC-Vive VR-set and a laptop PC was used in all test sessions. An extra display was also arranged for the spectators.
A single game test (per player) advanced in three phases: before playing the game, the player filled the pre-game questionnaire, surveying demographic information and the player’s daily sustainability choices.
The game collected data of the player’s teleporting and information hotspot triggering actions. The timestamps of these actions were logged. Also the player’s head and hands positions were logged continuously. The data logging for each specific player started at the moment the operator started the game.
After playing, each player filled the In-Game Game Experience Questionnaire (Ijsselsteijn et al., 2014), followed by questions about the learning outcomes on the sustainable or smart solutions presented in the game, and questions on how well any specific content form served memorizing the information.
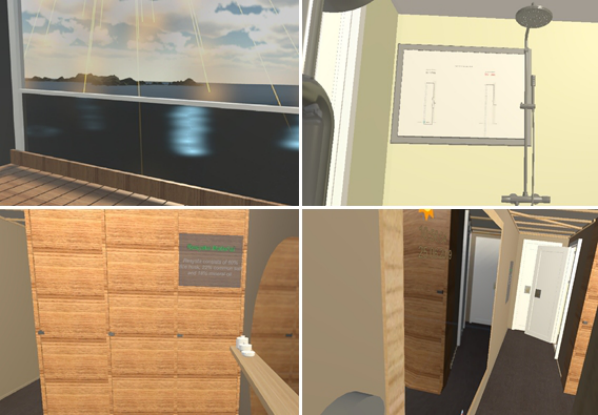
GAME DESCRIPTION The game takes place on a 3D model of SmartEcoCabin, a concept for an ecological future cruise ship cabin, with various smart functionalities and sustainable design solutions, presented in Figure 1. The cabin model and the information content were provided by a co-operating shipyard. The model was implemented into VR scene with Unity 3D. VR functionality and interaction were added to it utilising Steam VR support.
Figure 1: Solar panel 3D-animation (1a), shower video (1b), resysta material (1c), info mirror (1d).Table 1: Information hotspots in the SmartEcoCabin game.
Table available in the original PDF paper.
Hotspot Speech Length Text Animation Video Solar panel 4.5 s - Continuous - Shower 10 s - - 11 s Info-mirror 18 s - - - Resysta material 20.5 s Still - -
The cabin contains four hidden information hotspots (Table 1) that appear as blue buttons when the player is near them. When a button is pushed, the game presents information on the specific smart functionality or sustainability solution via speech and one of the following content forms: text, animation, video or image. The player can move by walking, but teleporting with a controller is recommended.
RESULTS
The results fall into two categories: in-game data and questionnaire data. In-game data presents the players’ actions as quantitative data, whereas the questionnaire includes both quantitative and qualitative data about the players’ opinions.
In-Game Data In Table 2, the age and gender of the participants are explained. The age group categories are underaged, young adults (18–40 years) and older adults (over 40 years). There was a significant proportion of male and female participants in all age groups, and thus comparison of female and male answers does not have an effect based on the age group, or vice versa.
Table 2: Information on the total of 84 participants in the testing.
Table available in the original PDF paper.
Age Group Science Event Seminars Female Male All Under 18 years 54 0 24 (44%) 29 (54%) 54 18–40 years 8 3 6 (55%) 5 (45%) 11 Over 40 years 6 13 6 (32%) 9 (68%) 19
The SciCruise science event was aimed for the school aged children, as can be seen from the participants for that specific game test. Then again, in the two seminars, the test participants were older people, who had a special interest for maritime industry e.g. through their work, except for two students visiting the museum where the seminar was held.
Several variables, computed from the in-game data, are presented in Table 3 by gender and age group. Game time was calculated as the time for playing the game per player, starting from the activation of the beginning information hotspot, and ending to the activation of the game- end information hotspot. The game-end information hotspot emerged into the scene only after finding all the other information hotspots. So if the data of the activation of the game-end information hotspot was missing, the player had quit the game before completing it. For those players the total game time was not calculated at all.
Content Forms and Information Presentation in Virtual Reality, Case 93
Table 3: Game time and attention span related statistics by gender and by age group.
Table available in the original PDF paper.
Median Quit Playing Next Opened Moved Away
Demographic Category
Avg. Game Time Female 2 min 57 s 2 min 46 s 2 (5%) 13 (33%) 17 (43%) Male 2 min 47 s 2 min 43 s 3 (7%) 8 (19%) 20 (47%) Under 18 years 2 min 33 s 2 min 36 s 1 (2%) 20 (37%) 33 (61%) 18-40 years 2 min 58 s 3 min 6 s 1 (9%) 1 (9%) 3 (27%) Over 40 years 3 min 51 s 3 min 59 s 3 (16%) 0 (0%) 2 (11%)
The time between opening two info points was calculated from in- game data. This was the time it took to listen and watch the information visualisation, as well as to find and activate the next information hotspot. If the player found and activated the next information hotspot while the audio from the previous one was still playing, then the two speeches were played on top of each other, preventing listening to the information accurately. In Table 3, the players, who activated the next hotspot (for at least one of the info points) while the previous audio was still playing, are calculated as next opened column. While this was a feasible way to understand how many players were listening to the information, it can be considered as a minimum – it is quite possible that some players did not listen to the information, but instead spent time trying to find the next information hotspot.
The in-game data also included position information, and it was used to calculate when the player had moved away from the last opened information hotspot. As it was common to see players adjust their position to be able to observe the visual presentation, movement within one meter radius from the point where the player pressed the button was allowed. In Table 3, the column moved away describes the number and percentage of players, who moved further than one meter from the activation point before the audio clip had ended.
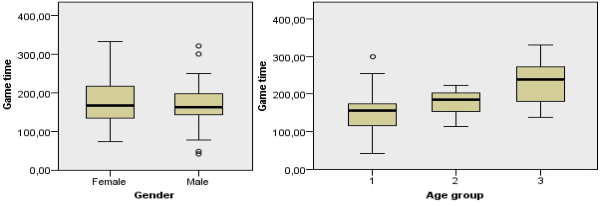
According to Kruskal-Wallis Independent samples test (p = 0.36) no differences between genders could be noted in game times. This can also be easily seen from the boxplot in Figure 2a. When comparing the age groups, Kruskal-Wallis test shows a statistically significant difference between the groups (p < 0.001), and according to the pairwise comparisons, this difference is seen between the youngest and the oldest age group. This is visualised in boxplot in Figure 2b.
Figure 2: Boxplots of game time by gender, 2a, and by age groups, 2b.
Some of the players quit the game before going through all the information hotspots, including the end game information hotspot (Table 3). Typically, these players informed that “I think this was enough for me”, and wanted to get out of the VR environment with no further explanation for the reason to quit. Although the number of these players was quite small (five out of all 84 players), a beginning of tendency towards older people quitting more often can be seen, while no differences were seen on the gender of the quitters.
The number of people opening the next information hotspot fast or moving away from specific information hotspots are described in Table 4. For three of the information hotspots (shower, info-mirror and Resysta material) these numbers resemble each other. In other words, the way the information was presented on top of audio, whether being video, 2D images or text, did not seem to get people to focus for the audio less or more. The reason for the solar panel difference to the other three information hotspots is probably due to the audio being significantly shorter than the other audios. This means that the players simply could not find the next information hotspot or move away as quickly.
Table 4: The number of people (out of total 84) opening the next information hotspot, and moving away before the audio clip ended.
Table available in the original PDF paper.
Hotspot Next Opened Moved Away Shower 12 (14%) 24 (29%) Info-mirror 15 (18%) 31 (37%) Resysta Material 11 (13%) 27 (32%) Solar Panel 0 (0%) 4 (5%)
Questionnaire In the end-game questionnaire, the focus was on the experiences of the player from information sharing viewpoint. The first question, presented in Figure 3, was about how well they remembered the information of the different information hotspots. The answers to all the four information hotspots quite much resemble each other.
Figure 3: How well the players think they remember information about the following sustainable solutions.
Content Forms and Information Presentation in Virtual Reality, Case 95
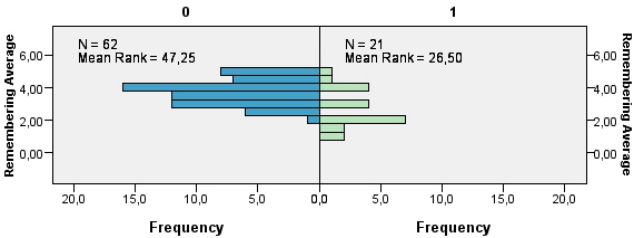
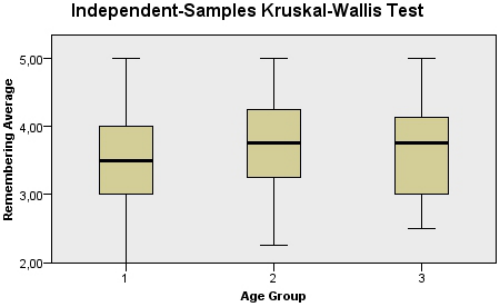
As presented in Table 3, some of the players opened the next hotspot while the previous speech was still playing. These players can be called “hotspot- seekers” while the rest of the players can be considered as information- listeners. Almost all of the hotspot-seekers belong to the youngest group. For every player, an average of remembering information was calculated from remembering of each information hotspot. When comparing these remembering averages, answers of the hotspot-seekers and information- listeners differed statistically significantly (Mann-Whitney U-test p < 0,001), as can be seen in Figure 4. This further verifies that some players were eager to find the hotspots and were not actively focusing on the information content.
Figure 4: Remembering sustainable information of hotspots divided between 0=“information-listeners” and 1=“hotspot-seekers”.Figure 5: Boxplot of how well information was remembered in each of the three age groups.
To get a better view on whether there is a difference between age groups, only the view of the information-seekers was taken into account when comparing the age groups. There, the Kruskall-Wallis statistic does not find statistical difference, as can be clearly seen from Figure 5. In other words, information was remembered similarly in different age groups, when only taking into account those players who focused on listening to the information.
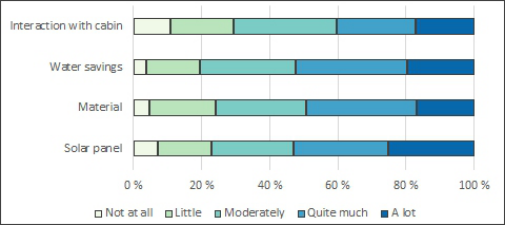
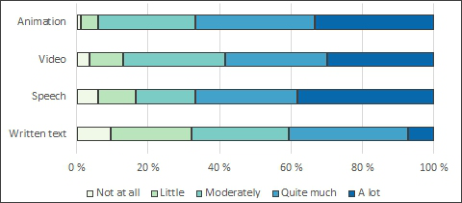
Another issue that was questioned from the players was how each of the content forms was experienced and how these elements helped to remember the information. As can be seen from Figure 6, written text was considered to be the least helpful content form.
Figure 6: How different elements help to remember information.
This supports earlier findings that especially persons with no experience of VR, can find it difficult to read in this environment. However, if text needs to be used, then the preferred model is to insert stationary text in the VR environment (Olofsson, 2017).
Written text was used in the Resysta material hotspot. When comparing Figure 6 to Figure 3, we can see that the information of the Resysta material was remembered as well as other information.
CONCLUSION
In order to find out how well different content forms serve the purpose of information sharing in VR, we developed a VR game SmartEcoCabin that was tested publicly, accompanied by a two-part questionnaire. We also researched how different age groups or genders experience such an application. Combining the logged in-game data with the questionnaire answers, we found out that most players value text as least favourable content form to share information in VR.
In contrast to Makransky et al., (2018), who reported differences in boys and girls, we did not find similar results. In our test, the SmartEcoCabin the user experience did not differ between gender groups. Some players are tempted to rush through the game, not listening or otherwise observing the information content. This behavior was more common within the youngest age group of our test players, for whom the test might have appeared as a game to speedrun. A weak tendency of quitting the game session before completing the game was noticed among the older players.
ACKNOWLEDGMENT
The research reported in this article has been conducted as a part of SUSTIS (Sustainability and Transparency in Shipbuilding Networks) project. The project was carried out in collaboration with VTT Technical Research Centre of Finland, DNV GL Business Assurance, Evac, Lautex, Meriteollisuus,
Content Forms and Information Presentation in Virtual Reality, Case 97
Meyer Turku, NIT Naval Interior Team, Paattimaakarit, Piikkio Works, Sininen Polku and SSAB Europe. The project was mainly funded by Business Finland.
REFERENCES
Bis, Ł. (2019). Virtual Reality. Now. Social Communication, Special Issue 2018, 121–127. Guan, L. Wang, Y. Zhang, R. Tie, Y. Bulzacki, A. Ibrahim, M. (2010). Multimodal
information fusion for selected multimedia applications. International Journal of Multimedia Intelligence and Security, Vol. 1, No. 1, 5–32. Ijsselsteijn, WA. de Kort, YAW. Poels, K. (2014). The Game Experience Questionnaire. Eindhoven: Technische Universiteit Eindhoven, https:// research.tue.nl/en/publications/the-game-experience-questionnaire. Kauhanen, O. Väätäjä, H. Turunen, M. Keskinen, T. Sirkkunen, E. Uskali, T.
Lindqvist, V. Kelling, C. Karhu, J. (2017). Assisting immersive virtual reality development with user experience design approach, 127–136. Kelling, C. Kauhanen, O. Väätäjä, H. Karhu, J. Turunen, M. Lindqvist, V. (2018).
Implications of Audio and Narration in the User Experience Design of Virtual Reality, 258–261. Makransky, G. Wismer, P. Mayer, RE. (2018). A gender matching effect in learning with pedagogical agents in an immersive virtual reality science simulation. Marjanovic, U. Tegeltija, S. Medic, N. Lazarevic, M. Tasic, N. Lalic, B (2018).
Content Development for Virtual Reality Training. 9th International Scientific and Expert Conference TEAM 2018, At Novi Sad, Serbia, 253–256. Nolan, S. (2015). Guiding Attention in Immersive 3D Virtual Reality. Master’s thesis, University of Dublin, Trinity College, https://scss.tcd.ie/publications/theses/diss/ 2015/TCD-SCSS-DISSERTATION-2015-064.pdf. Nordahl, R., Nilsson, NC. (2014). The Sound of Being There: Presence and
Interactive Audio in Immersive Virtual Reality, The Oxford Handbook of Interactive Audio. Oxford University Press, Oxford, England, UK. Obrist, M. Velasco, C. Vi, CT. Ranasinghe, N. Israr, A. Cheok, AD. Spence, C. Gopalakrishnakone, P. (2016). Touch, Taste, & Smell User Interfaces: The Future of Multisensory HCI. Workshop CHI2016, Imagineering Institute 2016, 3285–3292. Olofsson, J. (2017). Input and Display of Text for Virtual Reality Head-Mounted
Displays and Hand-held Positionally Tracked Controllers. Master’s thesis, Luleå University of Technology Department of Computer Science, Electrical and Space Engineering. Saarni, J. Heikkilä, K. Kalliomäki, H. Mäkelä, M. Jokinen, L. Apostol, O. (2019). Sustainability in Shipbuilding – Observations from Project- Oriented Supply Network in Cruise Ship Construction, http://urn. fi/URN: NBN: fi-fe2019052216657. Sánchez, Á. Barreiro, JM. Maojo, V. (2000). Design of Virtual Reality Systems for Education: A Cognitive Approach. Education and Information Technologies, Volume 5, Issue 4, 345–362. Search, P. (2015). Interactive Multisensory Data Representation, Design, User
Experience, and Usability: Users and Interactions. Springer, Cham, Switzerland. Serrano, B. Baños, RM. Botella, C. (2016). Virtual reality and stimulation of touch and smell for inducing relaxation: A randomized controlled trial. Computers in Human Behavior, Volume 55, Part A, 1–8.
LISTED IN THE AHFE DIGITAL BOOKSTORE CATALOGUE
Explore the complete digital volume
Human Factors and Wearable Technologies
Read this individual research paper free through the original publisher, or explore the full digital proceedings book.
ISBN 978-1-964867-51-9
Explore this ISBN in the AHFE Bookstore ↗Listed in the July 2026 bookstore catalogue; search by ISBN to confirm current availability · Digital book purchase optional