Jinghao Jiang, Kaizhong Cao (2025). An examination of the influence of visual perception of 3D LED billboards on viewer emotions: based on environmental psychology. In: Human Interaction and Emerging Technologies (IHIET 2025). AHFE Open Access, vol. 197, pp. 388–398. https://doi.org/10.54941/ahfe1006731
The advent of 3D LED billboards in consumer and public display sectors necessitates a comprehensive understanding of their visual effects and the mechanisms underlying users' emotional responses. Environmental psychology suggests that environments can evoke feelings of happiness and relaxation, yet they may also induce anxiety and depression. Consequently, this study seeks to employ the PAD model (pleasure, arousal, dominance) alongside environmental psychology to investigate the impact of 3D LED billboard visual effects on audience emotions. It aims to analyze the emotional characteristics observed in experiments and case studies to inform the optimization of design strategies. Traditional research in this area is constrained by physical influences and regulatory policies, presenting challenges such as imprecise experimental parameter adjustments (e.g., environmental daylight, on-site human traffic) and legal restrictions that prevent the display of experimental content on screens. This study introduces an innovative approach by developing a VR virtual experimental platform, offering new methodological insights for future research on 3D LED billboards.Methods: This study employed a questionnaire survey and a quantitative experiment. Initially, a questionnaire featuring various photographs of 3D LED billboard cases was distributed, and participants were asked to evaluate these cases based on visual quality elements. The aim was to identify differences in the design elements of 3D LED billboards across different visual levels. Subsequently, on-site measurements of the 3D LED billboard scenes were conducted for modeling purposes, and a naked-eye 3D video was produced. The emotions elicited by various screen parameters were quantitatively assessed using the PAD (Pleasure, Arousal, Dominance) model. Following the experiment, emotional calculations and design factor evaluations were performed for different design scenarios to investigate the emotional design strategies of the environment. In this experiment, screen parameters served as independent variables, while pleasure, arousal, and dominance in the PAD model functioned as mediating variables, and emotional tendency was the dependent variable.Conclusion: The analysis of questionnaire survey data reveals that the visual quality of 3D LED billboards is influenced by factors such as brightness, size, color saturation, viewing angle, and distance. Furthermore, the examination of quantitative experimental data indicates an absence of linear correlation between screen parameters (specifically brightness) and the audience's PAD (Pleasure-Arousal-Dominance) emotional values when the same content is displayed. Optimal screen parameters can elicit feelings of surprise or pleasure in viewers, whereas extreme parameters may provoke anxiety or hostility. The visual perception of the screen significantly impacts the audience's sense of pleasure and dominance, suggesting that varying screen parameters predominantly affect the audience's positive or negative attitudes and their active or passive willingness to engage with the screen. Additionally, we conducted emotional evaluations and design analyses of various cases and experiments, proposing emotional design strategies aimed at enhancing positive emotional responses. These strategies are intended to guide future designs towards being more scientifically grounded and human-centered, thereby improving the visual image quality of 3D LED billboards.
The 3D LED billboard consists of extensive LED panels installed on the exteriors of buildings, in public squares, and other urban environments (Lee et al., 2012). Its primary mechanism involves connecting two panels to create a curved 3D display. In contrast to traditional 2D screens, the 3D LED billboard employs the optical illusion principle of deformable optical elements to generate a pseudo-realistic 3D dynamic effect
An Examination of the Influence of Visual Perception of 3D LED Billboards 389
(Linwei et al., 2023). The term “3D LED billboard” as examined in this study, pertains to outdoor LED screens that present 3D video content visible without special glasses. Currently, achieving naked-eye 3D on LED screens necessitates constructing a three-dimensional viewing experience through the manipulation of distance, size, shadow effects, and three-dimensional perspective relationships within multi-angle two-dimensional images. A fundamental distinction between true 3D and pseudo-3D lies in the presence or absence of binocular disparity, which refers to whether each eye perceives a different image. According to the principles of naked-eye 3D implementation, all current outdoor large screens lack binocular disparity.
As 3D LED billboards rapidly proliferate in various urban commercial areas and tourist attractions, a significant research gap exists concerning the impact of factors such as viewing area settings, screen brightness, environmental contrast, and content framing on the visual and emotional experiences of audiences. Designers and operational teams responsible for these 3D LED billboards remain in the exploratory and experiential phases of managing these installations. During this period, there has been an excessive focus on maximizing screen brightness and size, which has disrupted local residents’ daily routines, caused color distortion that undermines the effectiveness of advertising campaigns, and led to miscalculations of optimal viewing positions, thereby diminishing the intended 3D effects. Currently, solutions to these issues are predominantly technical, focusing on procurement, installation, and production, while lacking specific research and guidance on how screen attributes influence audience emotions and visual experiences during ongoing operations.
According to environmental psychology (Gifford and Robert, 2014), the environment can evoke feelings of happiness and relaxation, yet it can also induce anxiety or even depression. Investigating the impact of environmental factors on emotions is advantageous for human-centered design. This study employs a combination of questionnaire surveys and quantitative experiments. Initially, we distributed questionnaires featuring images of various corner screens, requesting participants to evaluate the cases based on visual quality elements. This allowed us to summarize the differences in 3D corner screen design elements across different visual levels. Subsequently, we conducted on-site measurements of 3D LED billboard scenes for modeling purposes and produced a naked-eye 3D short film to quantitatively assess the emotional responses elicited by different screen parameters using the PAD model. Conventional research methodologies have been constrained by physical factors and promotional policies, resulting in imprecise control over experimental parameters, such as ambient lighting and crowd dynamics, as well as legal restrictions that inhibit the display of experimental content on screens by the experimental group. This study introduces an innovative approach by developing a virtual reality (VR) experimental platform, thereby offering novel experimental frameworks for future investigations into 3D LED billboard technology.
390 Jiang and Cao
EMOTIONAL RESPONSE TO THE ENVIRONMENT Environmental psychology posits that the environment and human emotions interact dynamically, with environmental stimuli triggering emotional responses (Mehrabian and Russell, 1974). As individuals evaluate their surroundings, they develop preferences that influence their emotions. Emotional perception involves processing environmental information through senses like sight, sound, and touch, leading to feelings such as pleasure and engagement. This perception affects personal experiences, quality of life, and well-being, significantly enhancing happiness and mental health.
Environmental psychology’s perception theory provides a framework for understanding 3D LED billboards’ impact. It emphasizes how the environment shapes human perception and behavior, with vision being a key information channel influenced by environmental factors (Alfonso, 2024). For instance, lighting can alter spatial perception, and excessive brightness can cause eye strain and discomfort, affecting emotional well- being and increasing depression risk. The perceptual process involves three stages: sensation (sensory input without brain processing), perception (brain-mediated interpretation), and cognition (integration with culture and experience). “Environmental preference” refers to how individuals assess and choose environments based on their satisfaction with the space (White and Gatersleben, 2011). This concept involves evaluating features, such as those on 3D LED billboards, to determine which elements generate positive reactions and which cause negative visual effects, providing guidance for future design strategies.
Human visual perception is complex, involving many variables in assessing visual quality. Evaluating using real spaces or models is costly and time- consuming, with limited control over variables like daylight (Bellazzi et al., 2022). This study focuses on a 3D LED billboard, serving both public and promotional purposes. Adjusting these billboards often requires specific reviews or policy approvals, challenging standard research teams. High- definition virtual reality simulations provide an ideal platform to study the interaction between emotions and environmental factors, allowing precise control over experimental conditions (Li & Kim, 2024). This methodology not only optimizes time and cost efficiency but also aids in the early detection of potential design issues (Marín-Morales et al., 2020).
PAD EMOTION MODEL The PAD emotion model is comprised of three dimensions: pleasure (pleasure-displeasure), activation (arousal-nonarousal), and dominance (dominance-submissiveness) (Mehrabian, 1996). The pleasure dimension (P) denotes the positive or negative valence of emotions, capturing their fundamental nature. The activation dimension (A) reflects the intensity of an individual’s neurophysiological activity. Lastly, the dominance dimension (D) signifies the extent to which emotions exert control over external circumstances and other individuals.
The PAD emotional space constitutes a framework for characterizing the positioning of emotional states within a three-dimensional construct defined
An Examination of the Influence of Visual Perception of 3D LED Billboards 391
by the axes of pleasure, activation, and dominance. This model utilizes spatial distance to quantify the similarities and distinctions among diverse emotional states. The dimensions of this space are delineated as pleasure (P), activation (A), and dominance (D). As a quantitative approach to emotion description, the PAD emotional space allows for any coordinate position e (P, A, D) to correspond to a distinct emotional state E.
In a series of comprehensive experiments conducted by the Institute of Psychology at the Chinese Academy of Sciences, the methodology for measuring the PAD (Pleasure, Arousal, Dominance) scale was refined and simplified. The revised scale now comprises 12 emotion assessment items, with four items allocated to each dimension. Utilizing this scale, the emotional spatial coordinates of 14 basic emotions were systematically measured (Huang and Luo, 2004). These foundational emotional PAD values facilitate the assessment of participants’ emotional tendencies and intensities (Li et al., 2008).
Upon completing the data collection for the experiment, the data can be processed using specific formulas to derive the results pertaining to PAD emotional bias. This measurement approach elucidates the spatial positioning relationship between the PAD values obtained in the test and the fourteen fundamental emotions delineated within the PAD model. The PAD emotional bias signifies the emotional state corresponding to the nearest spatial positioning outcome. To determine this coordinate distance within the emotional space, the Euclidean distance algorithm can be employed.
Equation reproduced from the original PDF.
In the sensory space, the variable L denotes the distance between the assessed emotional state and the 14 fundamental emotions. The coordinates p, a, and d represent the measured emotional state e within this space, whereas pn, an, and dn correspond to the coordinates of the basic emotion type en.
STUDY DESIGN Experimental Design
This study utilizes a methodological approach that integrates questionnaire surveys with quantitative experiments. Initially, we disseminated questionnaires that included case photographs of 3D LED billboards, which varied in terms of contrast, viewing angles, and animation content. Participants were tasked with visually ranking these cases and identifying the primary factors they perceived as influencing visual quality. This approach enabled us to synthesize the pertinent variables affecting different levels of visual quality in 3D LED billboards.
A subsequent variable control experiment was conducted on the VR platform, wherein key influencing factors identified from the questionnaire survey were selected as independent variables. The PAD model’s dimensions of pleasure, activation, and dominance were employed as mediating
392 Jiang and Cao
variables, while emotional tendency was designated as the dependent variable. The objective of the experiment was to investigate the pathways through which these variables influence audience emotions. For the experimental materials, a 3D LED billboard scene from the Communication University of China, located in Chaoyang District, Beijing, was selected for on-site measurement and modeling. A self-produced 3D short film was developed utilizing Blender’s internal stereoscopic rendering capabilities to generate virtual reality animations with binocular disparity for the left and right eyes. The camera settings were configured to mimic human optical parameters, with an distance of 6.5 cm and a focal length of 35 mm. The study employed a between-subjects design. To assess subjective experiences, the standard Simplified Chinese PAD scale, developed by the Institute of Psychology at the Chinese Academy of Sciences, was utilized. This evaluation measured participants’ levels of pleasure, arousal, and dominance.
Questionnaire Collection In this study, a total of 100 questionnaires were initially collected via the Internet. Following a screening process, 8 questionnaires were deemed invalid and subsequently excluded, resulting in a final sample of 92 valid questionnaires, comprising 39 male and 53 female respondents. All participants reported having knowledge of or exposure to 3D LED billboards. Furthermore, the study enlisted 47 participants for a VR quantitative experiment, consisting of 23 males and 24 females, aged between 18 and 35 years, with a mean age of 26. All participants possessed normal or corrected- to-normal vision and had no history of neurological or psychological disorders. To ensure the reliability of the experimental data, participants were instructed to abstain from psychotropic substances, alcohol, and other stimulants for 24 hours prior to the experiment, thereby minimizing neural stimulation and maintaining a calm and stable emotional state. Additionally, participants were required to have spent a specified duration at the Communication University of China.
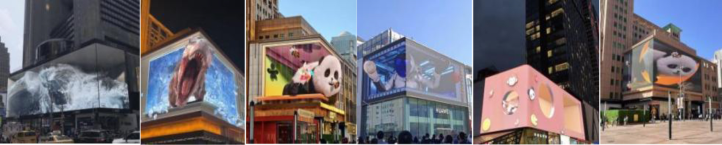
This study analyzes data from over ten 3D LED billboard cases, including those in Times Square, New York, and Wangfujing, Beijing. Six cases were chosen for their unique features, such as screen brightness and animation effects, which affect visual quality. Participants rank these cases to identify the best and worst designs and the most important factors. These rankings help pinpoint deficiencies in visual quality, and the frequently cited factors will be used in future quantitative analyses.
Figure 1: Actual photos of various cases (numbered from left to right as ABCDEF).
An Examination of the Influence of Visual Perception of 3D LED Billboards 393
Statistical analysis revealed an average visual quality ranking of BCADEF, with most participants citing screen brightness as the key factor. Content framing and viewing angle also significantly impacted visual quality. Interviews with some participants highlighted that, in clear daylight, insufficient screen brightness caused uneven lighting, diminishing the 3D effect of the LED billboard. Despite the engaging content, participants were unlikely to stop and watch it. Visual quality assessments show Group B and Group F support this. Although Group C and Group F have similar content, differences in screen brightness lead to a significant gap in visual quality, with Group C ranking second and Group F the lowest. Some participants also mentioned that the frame-out effect increased visual tension, providing a unique experience compared to a flat screen, which caused some to stop watching.
In real life, the majority of screen manufacturers opt not to incorporate automatic ambient light-adjusting brightness functions in their displays, primarily as a cost-saving measure. Instead, they rely on management teams to manually adjust screen brightness. This often results in the operational teams excessively increasing screen brightness during daylight hours to address issues of uneven brightness. Consequently, the brightness levels remain unchanged even as ambient light diminishes. This situation raises concerns about potential light pollution at night and its impact on viewers’ emotional states. Furthermore, it prompts the question of whether enhancing the framing effect during the animation design phase could mitigate negative emotional responses caused by uneven screen brightness. In light of these considerations, this study aims to investigate the relationship between screen brightness and audience emotions. Accordingly, the following research hypotheses are proposed: H1: Different screen brightness levels can affect the viewer’s pleasure. H2: Different screen brightness levels can affect the viewer’s activation. H3: Different screen brightness levels can affect the viewer’s dominance. H4: Sustaining a consistent screen brightness from daytime to nighttime may induce negative emotional responses in the audience.
H5: Enhancing the overflow effect of the animation may alleviate the related adverse emotional reactions caused by inconsistent screen brightness.
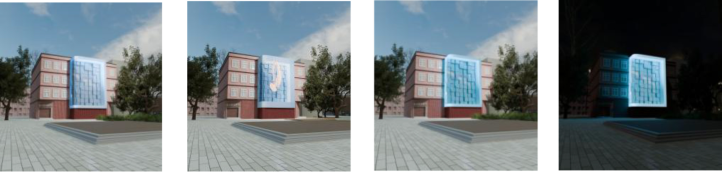
VR Experiment In order to conduct quantitative experiments, this study involved measuring the 3D LED billboard environment at the Communication University of China in situ and obtaining relevant construction drawings for verification purposes. Concurrently, we designed a series of naked-eye 3D animation depicting interactions between jellyfish and cubes, incorporating virtual borders and an out-of-frame effect. Four experimental conditions were established for VR video rendering: (1) a group with low screen brightness and uneven brightness across the screen; (2) a group with uneven screen brightness but enhanced animation overflow effects; (3) a group with moderate screen brightness and no uneven brightness; and (4) a group with moderate screen brightness intended for nighttime viewing. These conditions
394 Jiang and Cao
are hereafter referred to as Low Brightness, Overflow Amplification, Moderate Brightness, and High Brightness, respectively. The experiment was conducted at an optimal vantage point located 60 meters from the 3D LED billboard. Two cameras, each with a focal length of 35 mm, an distance of 6.5cm, and positioned at a height of 1.7 m, were configured to capture the left and right stereo channels necessary for rendering.
Figure 2: The environment among different groups (low brightness, overflow amplification, moderate brightness, and nighttime brightness).
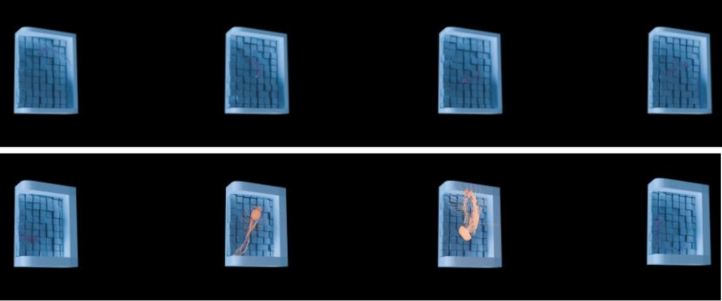
Apart from the group that enhanced the animation’s overflow effect, the jellyfish did not substantially extend beyond the boundaries of the screen frame. In the enhancement group, efforts were made to augment the framing effect of the jellyfish by broadening the false frame of the screen. Concurrently, the size of the principal subject, the jellyfish was increased as it swam towards the audience, ensuring that its tentacles were distinctly positioned in the space anterior to the false frame. Additionally, the color of the jellyfish was altered to enhance its visual appeal.
Figure 3: Compare the animations at the same time. Normal (top) amplification (bottom).
Prior to the commencement of the experiment, each participant viewed a 30-second video in an environment where the 3D LED billboard was deactivated to facilitate adaptation. Following this adaptation phase, participants were randomly assigned to an experimental group. All subjects across the four experimental groups were tasked with viewing a 3D
An Examination of the Influence of Visual Perception of 3D LED Billboards 395
animation. The only variables differing among the groups were the screen brightness of the video and the framing effect of the animation. Upon completion of the viewing, participants were required to complete the PAD scale developed by the Chinese Academy of Sciences and participate in a brief interview. Subsequently, data collection and processing were conducted.
Ultimately, a total of 47 scales were collected, comprising 12 for moderate brightness, 12 for overflow amplification, 12 for low brightness, and 11 for nighttime brightness. Following a screening process, 47 valid data points were selected for statistical analysis, which was conducted using SPSS.
DATA ANALYSIS The reliability and validity of 47 questionnaires were assessed using SPSS version 27.0. The analysis of data reliability revealed that Cronbach’s α values for the three dimensions of PAD were 0.843, 0.789, and 0.630, respectively. All variables demonstrated Cronbach’s α coefficients and KMO values exceeding 0.6, indicating that the measurement instruments for these questions possess satisfactory reliability and validity. Furthermore, the overall reliability and validity assessment of the scale yielded values of 0.806 and 0.703, respectively, suggesting that the scale as a whole exhibits good reliability and validity.
The emotional spatial distances between the PAD values of the four groups and the 14 basic emotions were calculated using Euclidean distance algorithm. Consequently, the PAD values for the four experimental groups and their corresponding emotional spatial distances from the 14 basic emotion types were determined.
Table 1: Pleasure-activation-dominance values of the four groups.
The minimum values for Moderate Brightness, Low Brightness, Overflow Amplification, and Nighttime Brightness were 0.24, 1.39, 0.81, and 0.78, respectively. These values correspond to the emotional tendencies of joy, boredom, neutrality, and anxiety.
Upon conducting a homogeneity of variance test on four sets of experimental data, it was determined that the significance level for all four experiments was below 0.001, thereby justifying the application of a one-way ANOVA. The ANOVA results indicated that the significance levels between the P, A, and D groups across the four experiments were also below 0.001, which is less than the predetermined threshold of 0.005. This finding suggests a significant difference in the data among the experimental groups with varying brightness levels. In conclusion, when the same 3D animation is played in a consistent environment, variations in screen brightness significantly affect the audience’s pleasure, activation, and dominance levels, thereby supporting hypotheses H1, H2, and H3. Additionally, the PAD emotional tendency analysis reveals that achieving moderate screen brightness during the day induces anxiety in viewers at night, thus confirming hypothesis H4. Furthermore, enhancing the animation’s overflow sensation leads to increased levels of pleasure, activation, and dominance among the audience compared to weak overflow effects under uneven screen brightness conditions, thereby validating hypothesis H5.
CONCLUSION
Since the advent of 3D LED billboards, screen operation teams have predominantly focused on augmenting screen brightness and enlarging screen dimensions to enhance the viewing experience. This approach has resulted in animation content becoming increasingly dazzling. The substantial cost associated with 3D LED billboards, along with their maintenance and management expenses, raises concerns regarding sustainability. Through a series of controlled experiments examining screen brightness and animation content, we critically assess the prevalent dependence on increased brightness. Our findings suggest that brighter screens do not inherently lead to superior visual experiences. Instead, improvements can be achieved through the judicious management of screen brightness, adaptation to ambient light conditions, and by enhancing the immersive quality of animations. Based on our experimental research, this paper presents the following conclusions: In practical applications of screen brightness control strategies, excessively low screen brightness during daylight hours can result in uneven luminance,
An Examination of the Influence of Visual Perception of 3D LED Billboards 397
thereby rendering animation content, which is intended to elicit joy and surprise, monotonous. However, the assumption that increased brightness is invariably beneficial is not universally valid. As ambient lighting conditions fluctuate, a brightness level that was initially appropriate may induce feelings of anxiety or sadness in viewers. From the perspective of the Pleasure- Arousal-Dominance (PAD) model, insufficient brightness diminishes arousal, thereby attenuating the media’s effectiveness. Although excessively high brightness can enhance arousal, it may also lead to discomfort and cognitive fatigue, contributing to viewer anxiety. Optimal brightness levels are crucial to maintaining a balanced state of pleasure, arousal, and dominance in viewers.Notably, differences in pleasure and dominance are more pronounced, suggesting that variations in brightness primarily affect viewers’ subjective attitudes and the extent to which they feel controlled by the screen.
Under conditions of consistent screen brightness variability, augmenting the Overflow effect of animations has been shown to enhance the PAD (Pleasure-Arousal-Dominance) values of viewers, with a notable increase in pleasure. This finding suggests that the emotional design of 3D LED billboards can be optimized not only through the intrinsic characteristics of the screen but also by enhancing the frame-out effect and three- dimensionality during the animation design process. This strategy not only elevates the emotional experience and visual quality perceived by viewers but also mitigates the need for manual screen brightness adjustments and reduces the costs associated with implementing adaptive brightness functions responsive to ambient conditions.
As society progresses, there has been a gradual increase in public awareness of 3D LED billboard technology, establishing it as a pivotal tool for shaping urban aesthetics. Consequently, the impact of human visual perception on the critical parameters of display technology is garnering heightened scholarly attention. Drawing upon the principles of environmental psychology, this study employs virtual reality (VR) methodologies to assess visual perception and utilizes the Pleasure-Arousal-Dominance (PAD) emotional space algorithm to propose a comprehensive set of emotional experience evaluation methods. These methods are applied to assess the emotional experiences associated with naked-eye 3D LED billboards. By employing the PAD Emotion Scale for scoring and conducting a detailed analysis of specific PAD values, this research aims to achieve a profound understanding of the audience’s subjective experiences and cognitive emotions. This understanding serves as a crucial foundation for subsequent design optimizations.
REFERENCES
Bellazzi, A., Bellia, L., Chinazzo, G., Corbisiero, F., D’Agostino, P., Devitofrancesco, A., Fragliasso, F., Ghelere, M., Megale, V., Salamone a, F. (2022). Virtual reality for assessing visual quality and lighting perception: A systematic review. Building and environment (Feb.), 209. de la Fuente Suárez, Luis Alfonso. (2024). Discovering the sensory, emotional, and interactive experiences of a place. Frontiers in Psychology.
398 Jiang and Cao
Gifford., & Robert. (2014). Environmental psychology matters. Annual Review of Psychology. Huang, Y., & Luo, Y. (2004). Native Assessment of International Affective Picture
System. Chinese Mental Health Journal, (09): 631–634. Lee, J., Chae, K. Y., Ji, S. (2012). The 3D video processing method in the stereoscopic camera for mobile devices. IEEE International Conference on Emerging Signal Processing Applications. IEEE. Li, M., & Kim, N. (2024). Exploring multisensory home office design in virtual
reality: Effects on task performance, heart rate, and emotion. Acta psychologica, 250, 104536. Li, X., Fu, X., Deng, G. (2008). Preliminary Application of the Abbreviated PAD Emotion Scale to Chinese Undergraduates. Chinese Mental Health Journal, 22(5), 327–329. Linwei, F., Jiani, Z., Yun, T. S. (2023), “Research on the expression features of naked-
eye 3d effect of led screen based on optical illusion art”, International Journal of Internet Broadcasting and Communication, vol. 15, no. 1, pp. 126–139. Marín-Morales, J., Llinares, C., Guixeres, J., Alcaiz, M. (2020). Emotion recognition in immersive virtual reality: From statistics to affective computing. Sensors, 20(18), 5163. Mehrabian, A. (1996). Pleasure-arousal-dominance: A general framework for
describing and measuring individual differences in temperament. Current Psychology, 14(4), 261–292. Mehrabian, A., & Russell, J. A. (1974). An approach to environmental psychology.
MIT. White, E. V., & Gatersleben, B. (2011). Greenery on residential buildings: does it affect preferences and perceptions of beauty?. Journal of Environmental Psychology, 31(1), 89–98.
LISTED IN THE AHFE DIGITAL BOOKSTORE CATALOGUE
Explore the complete digital volume
Human Interaction and Emerging Technologies (IHIET 2025)
Read this individual research paper free through the original publisher, or explore the full digital proceedings book.
ISBN 978-1-964867-73-1
Explore this ISBN in the AHFE Bookstore ↗Listed in the July 2026 bookstore catalogue; search by ISBN to confirm current availability · Digital book purchase optional