Kaito Nozaki, Wonseok Yang (2026). Optimization of Interface Design Based on User Behavior: Focus on the Adoption of Touch-Based UI in Home Appliances. In: Interdisciplinary Practice in Industrial Design. AHFE Open Access, vol. 222, pp. 34–43. https://doi.org/10.54941/ahfe1007744
The rapid transition toward touch-based UI in modern consumer products has created a notable mismatch with mental models that users have cultivated through long-term interaction with physical controls. This cognitive discrepancy often leads to operational confusion and a significant decline in overall usability. Consequently, to enhance the efficiency of product interactions, it is crucial to approach digitization in a manner that aligns with the user’s established mental model. This research focuses on specific "tasks" during product use to clarify the UI format that best corresponds to various operational characteristics. The investigation involved a detailed functional analysis of existing microwave ovens and washing machines, leading to a comprehensive classification of their operations. Based on these findings, ten different UI patterns were derived to represent various stages of digital integration, which were then evaluated through rigorous user testing. The results indicated that, for microwave ovens, a fully digital UI format was the most effective, suggesting that interface consistency increases usability. By contrast, for washing machines, physical buttons received the highest evaluation. This suggests that tasks requiring complex decision-making are better supported by a physical UI, which enhances the user’s sense of control. These findings aid the creation of design strategies that balance the convenience of digitalization with the user’s inherent mental model and product-specific characteristics. Ultimately, this study contributes to the realization of safer, more intuitive, and more ergonomic UI designs for future household appliances.
In recent years, interface design in industrial equipment and automobiles has rapidly shifted from dedicated physical controls to touchscreen-based interfaces, a trend often associated with the shift toward software-defined vehicles (SDVs). Although software control enables flexible information presentation and feature scalability, it can also increase visual and cognitive demands, creating the new challenge of degraded operational performance. In an on-road study, Vikström (2022) reported that the task completion time in a touchscreen-equipped vehicle was approximately four times longer than that in a vehicle equipped with predominantly physical controls. Against this background, the Euro NCAP (2026) has begun to re-evaluate the role of physical operation. The underlying cause of this gap is not simply user Received February 19, 2026; Revised April 6, 2026; Accepted April 21, 2026; Available online July 20, 2026
Optimization of Interface Design Based on User Behaviors 35 proficiency but structural differences between the two modalities. Physical buttons and dials provide tactile landmarks at the fingertip, such as geometry and resistance during actuation. As noted by Radwin and Jeng (1997), key travel and actuation force provide essential information for appropriate motor control. Physical controls also allow users to preposition their fingers on a button before action, supporting location and confirmation with reduced reliance on vision. By contrast, touch-based interfaces typically present a smooth glass surface that offers few physical cues to the fingertip. A biomechanical analysis by Bachynskyi et al. (2015) suggested that touch interactions on flat surfaces may increase physical load in terms of posture and musculoskeletal demand. Moreover, because there is no stable place to rest the finger, users may be forced to keep their fingers hovering above the surface, increasing uncertainty during usage. Minimalistic flat designs in digital interfaces can further exacerbate this issue, as demonstrated by Burmistrov et al.’s (2015) finding that interfaces lacking three-dimensional cues can increase cognitive load. Although prior research has clarified the characteristics of both physical and touch-based interfaces, the UI modality that is optimal for specific operational content has not yet been identified. Therefore, this research aims to identify task-appropriate UI modalities based on operational characteristics and task properties. To this end, we used microwave ovens and washing machines as case studies and examined how differences in UI modality for each task affected users’ subjective evaluations.
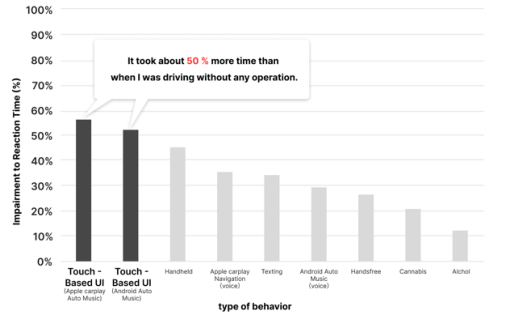
Cognitive Change Associated With Lack Of Feedback One of the most significant structural differences was the lack of haptic feedback. The distinct haptic click of physical buttons provides immediate confirmation of successful actuation at the fingertip, thereby reducing the need for visual confirmation. Akamatsu and MacKenzie (1996) showed that haptic information can reduce the target-selection time. In contrast, touch- based UIs typically lack such cues, increasing visual reliance and keeping the user’s eyes on the display. Ramnath et al. (2020) reported that reaction times increased by more than 50 percent when interacting with infotainment functions via touch inputs while driving.
Figure 1: Reaction rate during operation.
36 Nozaki and Wonseok Meanwhile, Hoggan et al. (2008) argued that the absence of haptic feedback can shift attention and cognitive resources toward the visual channel, whereas providing haptic feedback can support performance in touchscreen interactions. However, much of the existing literature focuses on improving feedback for isolated input actions. This paper presents comprehensive design guidelines for complex, multistep interaction processes, such as home appliances, leveraging the respective strengths of physical and digital interfaces according to task characteristics.
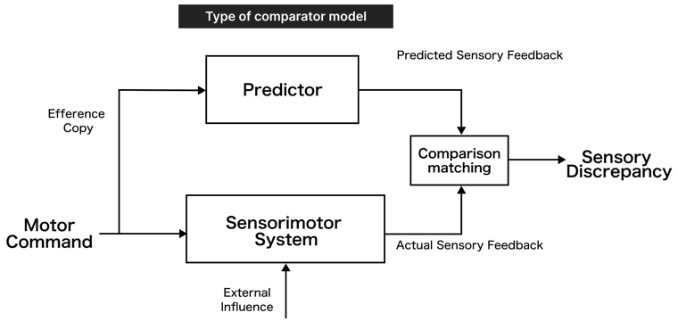
Product’s Sense of Initiative to Users While using an interactive system, users compare their intended actions with feedback from the system to verify that the system responded as expected. The sense of agency (SoA) emerging through this process is regarded as an important indicator of whether users feel that they can control the system appropriately (Cornelio et al., 2022). The widespread adoption of touch panels in home appliances may remove the physical feedback associated with operation, thereby attenuating SoA.
Figure 2: Comparator model.
According to the comparator model, SoA relies on the match between internally generated predictions of the sensory consequences of one’s actions and actual sensory feedback (Murakami and Kitazaki, 2024). However, a lack of haptic information in touch-based UI may disrupt this matching process. Previous studies reported that a physical click and the presence of haptic feedback contribute to the formation of SoA (Cornelio et al., 2017). Providing haptic feedback has also been shown to strengthen the temporal binding between actions and outcomes (Evangelou et al., 2021). In addition, differences in input devices can modulate the strength of the SoA (Bergstrom- Lehtovirta et al., 2018). However, much of the existing literature focuses on isolated actions. Therefore, this research investigates how SoA changes across tasks with different characteristics and examines the suitability of optimal UI modalities in multistep operation processes, such as those found in home appliances.
Optimization of Interface Design Based on User Behaviors 37 The UI Design is Affected by Physical Cognitive Process
The interaction characteristics of UI, as well as the underlying sensorimotor and cognitive processes, are key factors shaping user performance. Bachynskyi et al. (2015) showed that touch-surface orientation and device configuration affect posture, muscle activity, and interaction performance. Meanwhile, Kay et al. (2013) reported that in touch input, a finger-lift response involves less execution time than a touch-down press, which can directly bias measured reaction-time values. Huang and Hou (2025) suggested that differences in input modalities could influence user trust and cognitive load. In alignment with these cognitive perspectives, Mathur and Moallem (2022) demonstrated that the spatial configuration of in-vehicle touchscreen interfaces—specifically the distinction between vertical and horizontal grid segmentation—induces significant variances in visual search efficiency and task success rates. Conversely, Xia (2023) argued that an information architecture predicated on user behavioral logic, as opposed to functional logic, facilitates a more precise mapping to the user’s mental model, thereby mitigating operational barriers and reducing cognitive friction in home appliance interfaces. Furthermore, Oulasvirta et al. (2018) modeled neuromotor control in button-pressing, and de Korte et al. (2008) reported that haptic feedback can alter movement behavior and muscle loading during interaction. Taken together, these findings indicate that UI design can shape interaction behaviors through both bodily and cognitive mechanisms. However, because most existing literature focuses on isolated low-level actions, this research examines concrete product-specific operations.
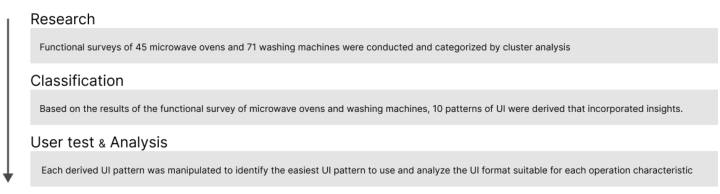
Research Method In this research, the following three-step approach was conducted to present guidelines for optimal UI design from a usability perspective in a digitized interface.
Figure 3: Research method.
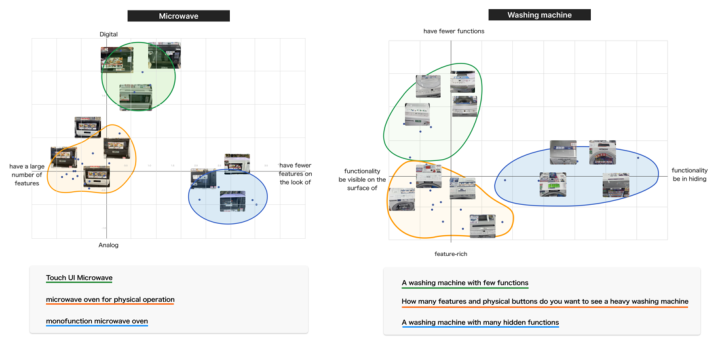
Step1: Classification of Current Functions After extracting functions from 45 current microwave ovens and 71 washing machines, classification was performed using quantification III and cluster analysis for each product. As a result, the current microwave oven and washing machine could be classified into three different patterns. The characteristics of microwave ovens and washing machines classified below are shown.
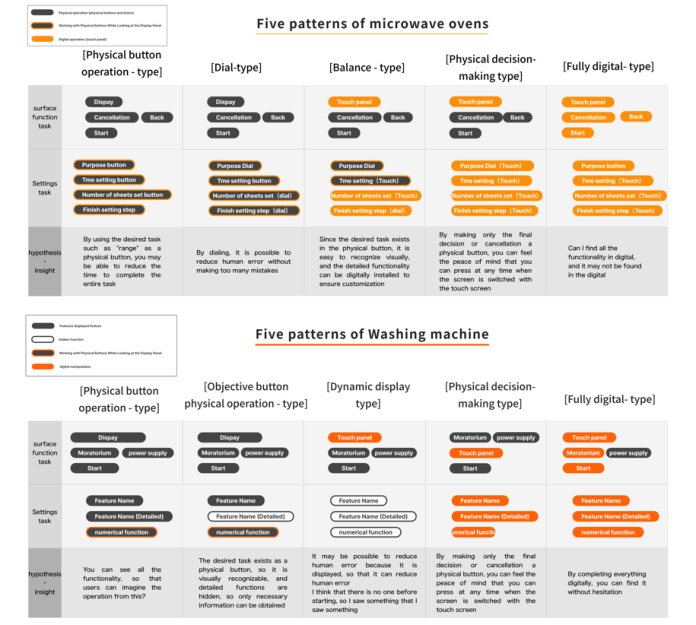
Step 2: Derivation of UI Patterns The classification of functionality based on the current electronic range and washing machine. Each of the electronic range and washing machine 5 patterns are derived from the electronic range and washing machine. The following example shows the UI for 10 patterns.
Figure 5: Guide of UI patterns.
Optimization of Interface Design Based on User Behaviors 39 Step 3: User Test
1) Experimental Method A UI pattern sample was created and a user test was conducted on 30 subjects. The subjects were asked to complete the questionnaire before and after each sample was operated, and a total of 10 patterns of samples were evaluated.
2) Evaluation Method The usability was quantified using the System Usability Scale (SUS) developed by the evaluation method (Brooke, 1986). In addition, I asked six questions that I extracted from the functional survey I created. To measure the subject’s ability, affinity for digital technology was confirmed using ATI (Affinity for Technology Interaction), developed by Franke (2019). The designated task was performed for each microwave oven and washing machine, and a total of 10 UI patterns were generalized thereafter. The recommended UI format was reviewed for each task and operation characteristic.
Result
1) Microwave (Physical button operation - type / Dial-type / Balance - type / Physical decision-making type / Fully digital- type)
Table 1 presents the results of the SUS score and ATI in the microwave oven. First, a single regression analysis was conducted to examine the association between ATI and SUS scores, but no statistically significant relationship was confirmed. When comparing SUS scores based on UI pattern, the completely digital type showed the highest score in the microwave oven, followed by dial and physical button types. These results suggest that unifying operations into a single UI format in a microwave may contribute to improving subjective usability. In addition, a multiple regression analysis was performed with the SUS score of each UI pattern as the objective variable, as well as the evaluation score of the six items as the explanatory variable. Statistically significant effects were observed for all the four UI patterns.
Table 1: Microwave SUS and ATI results.
Table available in the original PDF paper.
Pattern SUS Single Regression Analysis of SUS and ATI Fully digital- type 64.6 n.s.
Dial-type 64.0 n.s.
Physical button operation - type 59.5 n.s.
Physical decision-making type 54.2 n.s.
Balance - type 49.5 n.s.
Table 2: Multiple regression analysis by microwave SUS and element.
Table available in the original PDF paper.
Pattern Appearance
Feature-
Decisionability Recognizability
Assessment
Rich
Operational Imagination
Ease of Finding
of Revocation
One’s Purpose
n.s. n.s. P < 0.05 n.s. P < 0.05 n.s.
Fully digital type Dial-type n.s. n.s. n.s. n.s. n.s. n.s.
P < 0.05 P < 0.05 P < 0.05 n.s. P < 0.05 n.s.
Physical button operation - type n.s. n.s. P < 0.05 n.s. n.s. n.s.
Physical decision- making type Balance - type n.s. n.s. n.s. P < 0.05 n.s. n.s.
2) Washing Machine (Physical button operation - type / Objective button physical operation - type / Dynamic display type / Physical decision-making type / Fully digital type) Similar to microwave ovens, Table 3 presents the SUS score and ATI results for the washing machine. First, a single regression analysis was conducted to examine the association between ATI and SUS scores, but no statistically significant relationship was confirmed. When comparing SUS scores based on UI pattern, the physical button operation type showed the highest score for washing machines, followed by the physical decision-making and the objective button physical operation types. These results suggest that tasks involving decision-making, such as “start” and “cancellation,” in the washing machine may contribute to improving subjective usability. In addition, a multiple regression analysis was performed with the SUS score of each UI pattern as the objective variable and the evaluation score of six items as the explanatory variable. A statistically significant effect was observed for all UI patterns.
Table 3: Washing machine SUS and ATI results.
Table available in the original PDF paper.
Pattern SUS Single Regression Analysis of SUS and ATI Physical button operation - type 61.6 n.s.
Physical decision-making type 56.7 n.s.
51.8 P < 0.10
Objective button physical operation - type Fully digital type 48.3 n.s.
Dynamic display type 45.7 n.s.
Table 4: Multiple regression analysis by SUS and element of washing machine.
Table available in the original PDF paper.
Pattern Appearance
Feature-
Decisionability Recognizability
Assessment
Rich
Operational Imagination
Ease of Finding
of Revocation
One’s Purpose
n.s. n.s. P < 0.05 n.s. n.s. P < 0.05
Physical button operation - type P < 0.05 P < 0.05 n.s. n.s. n.s. n.s.
Physical decision- making type n.s. n.s. n.s. P < 0.05 P < 0.05 P < 0.05 Objective button physical operation - type
n.s. n.s. P < 0.05 P < 0.05 P < 0.05 n.s.
Fully digital- type n.s. n.s. n.s. n.s. P < 0.05 n.s.
Dynamic display type
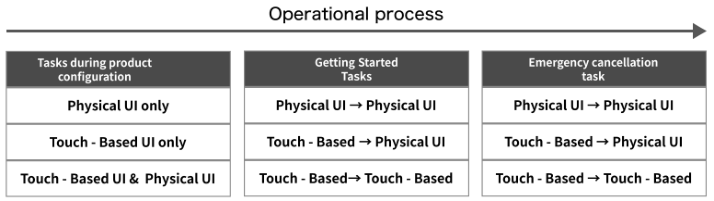
3) UI Format Assessment In order to make it applicable to products other than microwave ovens and washing machines, the operation process was generalized based on three operation processes: “tasks during product configuration”, “tasks to start”, and “tasks to perform emergency cancellation”. “Start Task” and “Cancel Urgent Task” focus on transitions from UI format before performing the task, respectively.
Figure 6: Classification in UI format.
The results of the unitary arrangement variance analysis confirmed the significant differences between the two items. Touch-Based UI & Physical UI was the most highly rated in “ease of operation imagination,” suggesting increased operational predictability using frequent features as physical UI. In addition, in “ease of cancellation,” the form using the physical UI for the final operation ranked high. Consequently, it is effective to assign a physical
42 Nozaki and Wonseok UI that is easy to predict for daily operations and easy to recognize for emergency operations to improve operability and sense of security.
Table 5: UI format analysis results.
Table available in the original PDF paper.
Operational Imagination Feature-Rich Oder UI Style Point UI Style Point
Third Touch-Based UI 3.280 Touch-Based UI→ Touch-Based UI
CONCLUSION
This research examined how differences in UI modality associated with product digitization affect users’ subjective evaluations. Adopting a consistent UI modality tended to yield higher ratings for microwave ovens. This suggests that, because microwave-oven use typically involves relatively few tasks from initiation to completion, minimizing burdens such as gaze shifts can enhance perceived ease of use. For washing machines, perceived usability improved when tasks involving decision-making were performed using physical controls. As washing-machine operation often requires many steps even within a single task, we inferred that users prefer to secure the final commitment through the certainty provided by physical feedback. Although the development of products with touch-based interfaces has accelerated with advances in ICT, our findings suggest that UI selection should not be treated as a binary choice in which every operation is assigned to either physical controls or touch-based interfaces. Instead, designers should analyze user behavior at the task level and allocate roles between physical and touch-based interfaces according to operational characteristics. These results extend prior work that has focused on isolated UI attributes by offering practical guidance for determining adoption policies for physical and touch-based interfaces in product design. Accordingly, the selection of appropriate UI modalities based on operational characteristics and usage contexts may improve usability not only for microwave ovens and washing machines but also for other products. Future studies should develop concrete design guidelines linked to the evaluation dimensions used in this research.
REFERENCES
Akamatsu, M., & MacKenzie, I. S. (1996). Movement characteristics using a mouse with tactile and force feedback. International Journal of Human-Computer Studies, 45(4), 483–493. ATI Scale. (n.d.). Affinity for Technology Interaction (ATI) Scale. Retrieved February
18, 2026, from https://ati-scale.org/
Optimization of Interface Design Based on User Behaviors 43 Bachynskyi, M., Palmas, G., Oulasvirta, A., Weinkauf, T., & Steed, A. (2015).
Performance and ergonomics of touch surfaces: A comparative study using biomechanical simulation. In Proceedings of the 33rd Annual ACM Conference on Human Factors in Computing Systems (CHI ’15). ACM. Bergstrom-Lehtovirta, J., et al. (2018). I really did that: Sense of agency with touchpad, keyboard, and on-skin interaction. In Proceedings of the 2018 CHI Conference on Human Factors in Computing Systems. ACM. Brooke, J. (1996). SUS: A “quick and dirty” usability scale. In P. W. Jordan, B.
Thomas, B. A. Weerdmeester, & I. L. McClelland (Eds.), Usability evaluation in industry (pp. 189–194). Taylor & Francis. Burmistrov, I., Zlokazova, T., Izmalkova, A., & Leonova, A. (2015). Flat design vs traditional design: Comparative experimental study. In Human-Computer Interaction – INTERACT 2015 (LNCS 9297, pp. 106–114). Springer. Cornelio Martinez, P. I., et al. (2017). Agency in mid-air interfaces. In Proceedings
of the 2017 CHI Conference on Human Factors in Computing Systems. ACM. Cornelio, P., et al. (2022). The sense of agency in emerging technologies for human– computer integration: A review. Frontiers in Neuroscience. de Korte, E. M., de Kraker, H., Bongers, P. M., & van Lingen, P. (2008). Effects of
a feedback signal in a computer mouse on movement behaviour, muscle load, productivity, comfort and user friendliness. Ergonomics, 51(11), 1757–1775. Euro NCAP. (2025, November 26). Euro NCAP announces 2026 protocol changes to tackle modern driving risks. https://www.euroncap.com/en/press-media/press- releases/euro-ncap-announces-2026-protocol-changes-to-tackle-modern-driving- risks/ Evangelou, G., et al. (2021). I feel it in my fingers! Sense of agency with mid-air
haptics. In 2021 IEEE World Haptics Conference (WHC). IEEE. Hoggan, E., Brewster, S. A., & Johnston, J. (2008). Investigating the effectiveness of tactile feedback for mobile touchscreens. In Proceedings of the SIGCHI Conference on Human Factors in Computing Systems (CHI ’08). ACM. Huang, H., & Hou, G. (2025). The impact of usage experience and input modality
on trust experience and cognitive load in older adults. Frontiers in Computer Science, 7, 1659594. Kay, M., Rector, K., Consolvo, S., Greenstein, B., Wobbrock, J. O., Watson, N. F., & Kientz, J. A. (2013). PVT-Touch: Adapting a Reaction Time Test for Touchscreen Devices. PervasiveHealth ’13, 248–251. Mathur, P., & Moallem, A. (2022). Tesla Model 3: Impact of vertical segmentation
on visual search time. Usability and User Experience, 39, 1–9. Murakami, T., & Kitazaki, M. (2024). Effects of transformation patterns in virtual embodiment on sense of body transformation, sense of body ownership, and sense of agency. Transactions of the Virtual Reality Society of Japan, 29(1), 39–47. Oulasvirta, A., Kim, S., & Lee, B. (2018). Neuromechanics of a Button Press.
Proceedings of the 2018 CHI Conference on Human Factors in Computing Systems, 1–13. Radwin, R. G., & Jeng, O.-J. (1997). Activation force and travel effects on overexertion in repetitive key tapping. Human Factors, 39(1), 130–140. Ramnath, R., et al. (2020). Interacting with Android Auto and Apple CarPlay (TRL
report). Vikström, F. D. (2022, October 18). Physical buttons outperform touchscreens in new cars, test finds. Vi Bilägare. Xia, C. (2023). Research on user interface design of home appliances based on
behavioural logic. SHS Web of Conferences, 152, 05003.
LISTED IN THE AHFE DIGITAL BOOKSTORE CATALOGUE
Explore the complete digital volume
Interdisciplinary Practice in Industrial Design
Read this individual research paper free through the original publisher, or explore the full digital proceedings book.
ISBN 978-1-964867-98-4
Explore this ISBN in the AHFE Bookstore ↗Listed in the July 2026 bookstore catalogue; search by ISBN to confirm current availability · Digital book purchase optional