Sarina Funaki, Momoka Muto, Wonseok Yang (2026). Relationship between feedback in Information Processing and Online Shopping. In: Interdisciplinary Practice in Industrial Design. AHFE Open Access, vol. 222, pp. 132–143. https://doi.org/10.54941/ahfe1007753
Waiting time during screen transitions in online shopping occurs when users expect immediate responses to their actions, which affects their evaluation of the purchasing experience. This research aims to clarify how processing speed and visual feedback presented during waiting time influence the purchasing experience. This research examined waiting time in online shopping by manipulating processing speed and the presentation of visual feedback during waiting. Users’ behavioral tendencies were classified as either exploratory or linear, and evaluations of the purchasing experience were compared between these groups. The results indicated that the factors affecting purchasing experience evaluations vary by behavioral tendency. For users with exploratory behavior, visual feedback showing progress during waiting led to more positive evaluations, even when processing speed was the same. For users with linear behavior, processing speed itself had a stronger effect on purchasing experience evaluations, even when visual predictability was provided. The sense of predictability regarding waiting time was found to depend on several factors, including the ability to understand the endpoint or remaining time and the perception that processing is ongoing. These findings indicate that information presentation for waiting time in online shopping should not be uniform; instead, optimization of processing speed and the use of visual feedback should be tailored to users’ behavioral tendencies.
In contemporary society, where many services are now online-based, waiting time during service use is unavoidable and significantly affects user satisfaction (Taylor, 1994). In online shopping, users expect immediate responses and smooth screen transitions; even minor processing delays can cause unpleasant experiences (Nielsen, 2010). To improve experiences related to waiting time, many studies have examined the effects of feedback about processing status during waits. Nah (2007) showed that presenting progress information increases tolerance for waiting time, while Sheng and Lockwood (2011) found that providing feedback can increase satisfaction and behavioral motivation. Additional research has addressed acceptable waiting times (Galletta et al., 2004) and the effects of indicators that reduce subjectively perceived waiting duration (Willermark et al., 2021). Studies on visual feedback report that the shape and animation of progress bars Received February 19, 2026; Revised April 9, 2026; Accepted April 25, 2026; Available online July 20, 2026
Relationship Between Feedback in Information Processing and Online Shopping 133 affect perceptions of waiting time (Ohtsubo and Yoshida, 2016; Chen and Li, 2020). Amer and Johnson (2016) described progress bars as UI elements that show progress toward task completion, suggesting that feedback during waiting is not only a display of time but also helps users cognitively perceive processing progress. Presenting such information is thought to reduce anxiety and stress and to improve interface evaluation (Conrad et al., 2010). During online shopping, users continuously process information, including product exploration, comparison, and decision-making, and the waiting experience during screen transitions becomes part of the overall purchasing experience. However, most existing research has focused on the effects of processing speed and visual feedback on subjective time perception, without adequately examining how specific feedback presented during waiting time contributes to the overall evaluation of the experience.
This research examines waiting time during screen transitions in online shopping and aims to clarify how processing speed and visual feedback influence the purchasing experience.
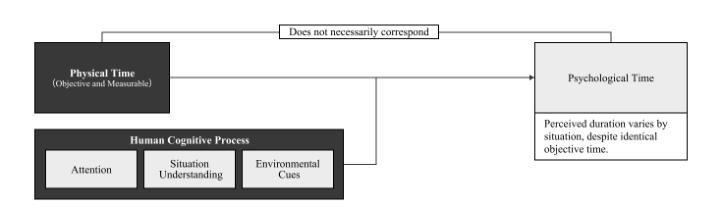
Effects of Information Presented During Waiting on Subjective Time Perception Time has two distinct aspects: objectively measurable physical time and psychological time, which humans perceive subjectively based on surrounding information and personal sensations (Murakami, 2016). The length of subjective time perceived by humans does not always correspond to the objectively elapsed physical time. Subjective time depends on factors such as attention allocation, situational understanding, and environmental cues (Hornik, 1984). Therefore, even when objective time remains the same, individuals may perceive it as shorter or longer depending on the situation. During “waiting,” users often struggle to understand processing progress or predict completion, which increases their focus on the passage of time. As a result, they tend to perceive subjective time as longer (Ehret, 2021). When external information about processing status, such as progress or state changes, is provided, users can more easily understand the situation, and their attention shifts away from the passage of time. Therefore, even when the objective duration remains the same, differences in users’ understanding of processing status and how this information is presented can lead to variations in subjective time perception.
Figure 1: Conceptual framework of psychological time.
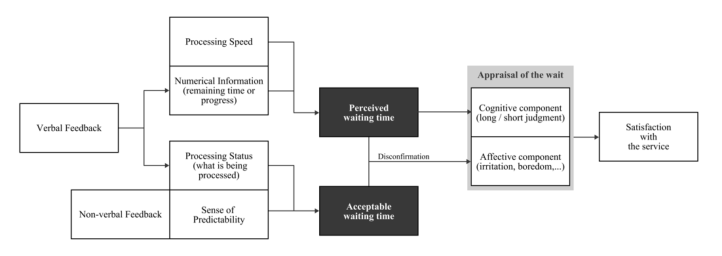
Structure of Service Evaluation for Waiting Time in Online Shopping When people evaluate an experience, they base their assessment on the difference between their prior expectations and the actual experience (Oliver, 1980). Pruyn and Smidts (1998) structured the expectation–disconfirmation– based evaluation process specifically for the purchasing experience. Their framework indicates that waiting time does not directly affect service satisfaction. Instead, the difference between perceived waiting time and acceptable waiting time influences emotional evaluation, which then shapes overall service satisfaction. Thus, both the perception of waiting time and its acceptability are critical in forming evaluations. In online shopping, providing information about processing progress and predictability during waiting periods can help users accept the wait and affect their assessment of acceptable waiting time, or how long they can tolerate waiting (Guillaume, 2019). Based on these considerations, this research organizes the structure of service evaluation for waiting time in online shopping as shown in Figure 2. The presence or absence of predictability regarding processing status, along with visual feedback that intuitively conveys progress, is considered to influence acceptable waiting time because these elements relate to users’ acceptance of waiting. In contrast, information that linguistically presents the remaining time or numerically indicates elapsed processing time directly affects the perception of time duration and is therefore categorized as influencing perceived waiting time. Based on this evaluation structure, this Research examines how Waiting time influences the Purchasing experience in Online shopping.
Figure 2: Service satisfaction evaluation model considered in this research (Pruyn and Smidts, 1998).
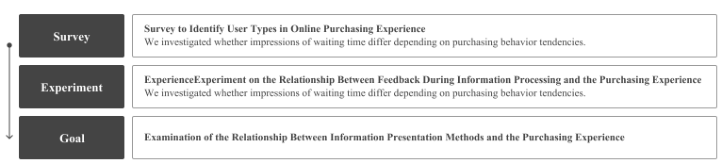
RESEARCH METHOD In this Research, in order to clarify how feedback indicating information processing during Waiting time influences the Purchasing experience, the investigation was conducted according to the following procedure (see Figure 3).
Figure 3: Research process.
Step 1: Survey to Identify User Types in Online Purchasing Experience First, in order to identify user behavioural tendencies in Online shopping, a questionnaire survey was conducted with 226 participants who had prior experience using EC websites. As the procedure, participants were asked to name one shopping site they frequently use in their daily lives and to select, in sequence from options provided by the researchers, the behavioural items that constitute their own purchasing flow. Based on these results, users in Online shopping were classified into two types.
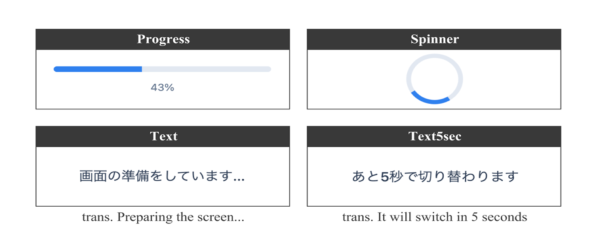
Step 2: Experiment on the Relationship Between Feedback During Information Processing and the Purchasing Experience In this experiment, the objective was to clarify how feedback presented during information processing influences satisfaction in the Purchasing experience. Based on UI samples modelled after an EC website, a total of seven types of UI samples were created (see Table 1): three conditions in which processing speed was varied, and four conditions in which processing speed was fixed while Visual feedback was varied. Evaluations were conducted using these samples. The specific feedback UI used in the experiment is shown in Figure 4.
Figure 4: Examples of feedback UI used in the experiment.Table 1: UI sample.
Table available in the original PDF paper.
Name Feedback Requirements Display Duration(s) 1_basic All speeds are the same. No changes. 5
2~10 1_fast Fast during the product exploration phase. Slows down as it approaches purchase confirmation.
8~2 1_slow Slow during the product exploration phase. Speeds up as it approaches purchase confirmation.
2_progress Provides a sense of progress. Non-verbal expression. 5
5
2_spinner Does not provide a sense of progress. Non-verbal expression.
5
2_text Does not provide a sense of progress. Verbal expression.
2_text5sec Provides a sense of progress. Verbal expression. 5 Participants performed tasks for each UI sample under one of two purchasing scenarios established based on the Step 1 survey results: Scene 1 (product undecided) and Scene 2 (product decided). The number of valid responses was 67 for Scene 1 and 68 for Scene 2. Upon completing each task, participants evaluated their purchasing experience using a questionnaire adapted from the Web Usability Scale (Nakagawa et al., 2001). The scale items were modified to align specifically with the objectives of this study.
Table 2: Survey questions.
Table available in the original PDF paper.
Category Question Favourability 1. The overall user experience of this e-commerce website is satisfactory. 2. I would like to use this e-commerce website again. 3. The purchasing experience feels very quick.
Usability 1. The operation of this e-commerce website is easy to understand. 2. The operation method of this e-commerce website feels intuitive. 3. I can proceed with operations on this e-commerce website without getting confused.
Information Structure
4. It is easy to understand what to do next on this e-commerce website. 1. It is easy to understand which stage of the operation process I am currently in. 2. The operation procedure of this e-commerce website is simple and easy to understand.
Visual Clarity 1. The text on this e-commerce website is easy to read. 2. The information layout on this e-commerce website is difficult to see. 3. When using this e-commerce website, it is difficult to grasp the content displayed on the screen.
System Responsiveness
I feel bored while waiting. This e-commerce website responds quickly to user actions. I do not feel that screen transitions on this e-commerce website are slow.
(Continued)
Table 2: Continued.
Table available in the original PDF paper.
Category Question Perceived Usefulness
1. I feel inclined to leave the website without making a purchase. 2. I feel uncertain about when the screen will change. 3. I have a clear sense of the expected waiting time.
Perceived Reliability
1. I feel that this e-commerce website can be used with confidence. 2. I feel that the operation of this e-commerce website is stable. 3. I think that this e-commerce website is a trustworthy service.
Additional Questions
I feel stress or impatience while waiting. I am willing to wait until the screen changes.
RESULTS
Results of the User Type Survey in Online Purchasing Experience The results of clustering the purchasing behaviour sequences of 211 participants are shown in Table 3.
Table 3: Cluster classification of purchasing behaviour.
Cluster 1 (lowest step count, high fixation) represented users with clear intentions, or “linear behavior.” In contrast, Cluster 2 (highest step count, frequent back-navigation) was identified as “exploratory behavior,” involving extensive information search. Cluster 0 showed intermediate traits. However, a low Silhouette coefficient (approx. 0.2) indicated undefined boundaries between clusters, suggesting that purchasing behavior follows a continuous distribution rather than distinct categories. Therefore, subsequent analyses prioritized the behavioral tendencies of “linear” and “exploratory” behaviors over rigid cluster assignments.
Experimental Results on the Relationship Between Feedback During Information Processing and the Purchasing Experience The results obtained from the survey were analysed as described below (see Figure 5).
Figure 5: Analysis contents.
Figure available in the original PDF paper.
To clarify the relationship between feedback during information processing and perceived time reduction in the Purchasing experience, statistical analyses were conducted. First, a Shapiro–Wilk test was performed to examine the normality of each sample. The results indicated significant deviations from a normal distribution under all conditions. Therefore, in this analysis, the questionnaire evaluation scores were set as the dependent variable and the feedback patterns as the independent variable, and the non-parametric Kruskal–Wallis test was applied.
1. Feedback Influencing Time Perception During the Purchasing Experience
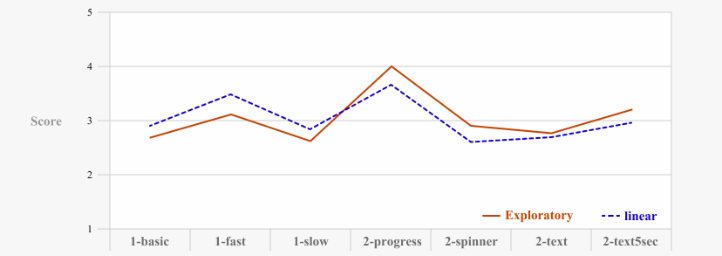
First, for the questionnaire item “The purchasing experience feels very quick.”, significant differences were observed between feedback patterns in both exploratory behaviour and linear behaviour (see Table 4). The mean trends for each condition are shown in Figure 6.
Table 4: The relationship between perceived time brevity in the purchasing experience and behavioural scenes.
Table available in the original PDF paper.
Scene Chi-Square Value Degrees of Freedom P (Prob > ChiSq) Exploratory 34.1722 6 < 0.001
linear 15.6592 6 0.0157
Figure 6: Comparison across feedback types for “the purchasing experience feels very quick”.
In exploratory behaviour, progress consistently showed higher evaluations compared with the other UI conditions. Even in comparison with the processing speed conditions, progress demonstrated an overall superior tendency. Furthermore, the results of the Dunn test confirmed a significant difference between basic and progress under the same processing speed condition (Table 5). These findings suggest that, in exploratory behaviour, presenting Visual feedback that provides predictability during Waiting time, rather than shortening processing time itself, may contribute to the perception of time within the Purchasing experience. In linear behaviour, although progress showed the highest mean rank, multiple comparisons
Relationship Between Feedback in Information Processing and Online Shopping 139 using the Dunn test did not reveal significant differences between progress and the other conditions. Meanwhile, spinner and text exhibited relatively lower evaluation tendencies. These results indicate that, in linear behaviour, although a certain degree of perceived time reduction through progress display can be observed, the effect is not as pronounced as in exploratory behaviour.
Table 5: Pairs of patterns showing significant differences in the item “the purchasing experience feels very quick”.
2. Impressions of Waiting Time During Screen Transitions
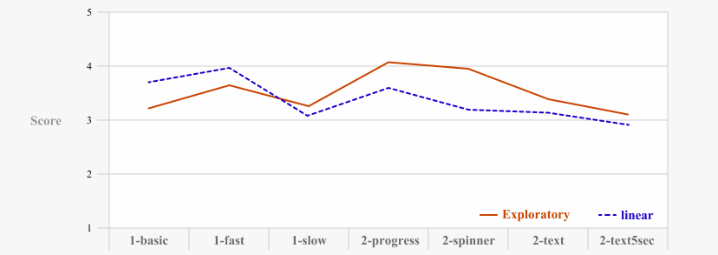
Next, for the questionnaire item “I am willing to wait until the screen changes.”, significant differences were observed between feedback patterns in both exploratory behaviour and linear behaviour (see Table 6). The mean trends for each condition are shown in Figure 7.
Table 6: Relationship between waiting time during screen transitions and behavioural scenarios.
Table available in the original PDF paper.
P (Prob > ChiSq)
Scene Chi-Square Value Degrees of Freedom Exploratory 18.9666 6 0.0042
linear 25.9139 6 0.0002
Figure 7: Feedback-based comparison for “willingness to wait until the screen changes”.
With regard to impressions of Waiting time during screen transitions, progress was found to be effective in exploratory behaviour. Observing the overall tendency, evaluations of the UI conditions were higher than those related to processing speed. This suggests that, in exploratory behaviour, introducing a non-verbal progress bar that enables users to grasp processing status may enhance tolerance towards Waiting time during screen transitions. In contrast, in linear behaviour, the effective conditions were fast and basic. When comparing the basic condition, which had the same processing speed, with the UI conditions, the basic condition showed relatively higher evaluations. This indicates that, in linear behaviour, processing speed itself has a stronger influence on impressions of Waiting time than UI-based supplementation. These findings suggest that, compared with exploratory behaviour, linear behaviour demonstrates a greater overall sensitivity to processing speed.
3. Effects of Waiting Time Predictability on the Purchasing Experience
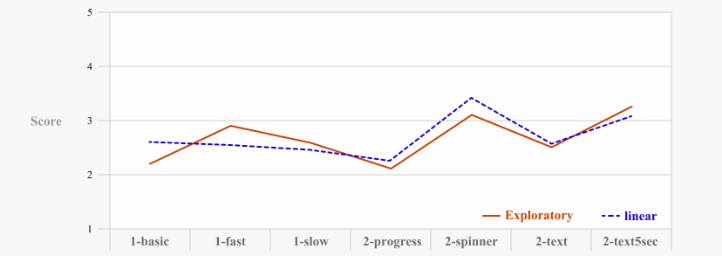
Finally, for the questionnaire item “I have a clear sense of the expected Waiting time,” significant differences were observed between feedback patterns in both exploratory behaviour and linear behaviour (see Table 7). The mean trends for each condition are shown in Figure 8.
Table 7: The relationship between perceived predictability of waiting time and behavioral contexts.
Table available in the original PDF paper.
P (Prob > ChiSq)
Scene Chi-Square Value Degrees of Freedom Exploratory 22.4215 6 0.0010
linear 19.3215 6 0.0037
Figure 8: Feedback-based comparison for “perceived predictability of waiting time”.
Overall, there were no substantial differences in evaluation trends between exploratory and linear behavior; both types showed similar patterns. For both behaviors, the spinner condition and the text5sec condition received relatively high evaluations, indicating that these conditions similarly enhance predictability regarding waiting time. These results indicate that predictability
Relationship Between Feedback in Information Processing and Online Shopping 141 does not arise from a single factor; instead, at least two interpretations are possible. One interpretation is endpoint-based predictability, which comes from understanding the endpoint of processing through explicit information, such as remaining time or progress. The other is progress-state predictability, which comes from perceiving that processing is ongoing rather than stalled. The text5sec condition is thought to strongly evoke endpoint- based predictability, while the spinner condition is thought to strongly evoke progress-state predictability. These results showed that, for both exploratory and linear behavior, presenting information that linguistically clarifies the endpoint and providing animation-based feedback that conveys ongoing processing increase predictability regarding waiting time. In contrast, for overall WUS evaluation in linear behavior, the mean evaluations for the spinner and text5sec conditions were lower than those for the speed conditions (see Table 8). This finding indicates that, in linear behavior, forming predictability about waiting time does not strongly enhance the overall evaluation of the purchasing experience. Instead, in linear behavior, processing speed appears to have a greater influence on the evaluation of the purchasing experience than understanding the processing endpoint or progress status.
Table 8: Mean WUS scores by sample.
Table available in the original PDF paper.
Sample Favorability Usability Information Structure
This research examined waiting time in online shopping, specifically how processing speed and visual feedback during waiting affect the purchasing experience, based on two behavioral tendencies: exploratory behavior and linear behavior. The results showed that perceived evaluations of the purchasing experience vary according to behavioral tendencies, and that the effectiveness of processing speed and visual feedback differs among users. For exploratory behavior, visual feedback that displays progress during waiting time significantly improves the evaluation of the purchasing experience. Even when processing speed remained constant, feedback showing progress received more positive evaluations. These results indicate that, for exploratory behavior, presenting information that offers predictability during waiting may influence perceived time and tolerance of waiting more than reducing processing time. In contrast, for linear behavior, processing speed had a greater effect on the evaluation of the purchasing experience, and predictability had only a limited effect on overall satisfaction. Furthermore, this research
presents findings that expand on existing studies of predictability in waiting time. Previous research has mainly considered predictability as the ability to identify the endpoint of processing or the remaining time (Nakanishi et al. 2011). The results show that predictability may depend on at least two factors: the ability to recognize the endpoint of processing and the perception that processing is ongoing and not stalled. These findings indicate that waiting time experiences in online shopping should not follow a uniform design. Instead, designers should differentiate between optimizing processing speed and providing visual feedback, depending on users’ behavioral tendencies.
REFERENCES
Amer, T. and Johnson, R. (2016). Information technology progress indicators: Temporal expectancy, user preference, and the perception of process duration, International Journal of Human–Computer Interaction, 12(4), pp. 1–14. Chen, H. and Li, S. (2020). The effect of visual feedback types on the wait
indicator interface of a mobile application, Displays, 61, 101932. Conrad, F.G., Couper, M.P., Tourangeau, R. and Peytchev, A. (Sep 1, 2010).
The impact of progress indicators on task completion, Interact Comput, 22(5), pp. 417–427. Ehret, S., Trukenbrod, A. K., & Thomaschke, R. (2021). Dynamics of temporal experience in active and passive waiting situations, Applied Cognitive Psychology, 35(4), pp. 900–908. Galletta, D.F., Henry, R., McCoy, S. and Polak, P. (2004). Web site delays:
How tolerant are users?, Journal of the Association for Information Systems, 5(1). Gronier, G. and Baudet, A. (2019). Does progress bars’ behavior influence the user experience in human-computer interaction?, Proceedings of the 2019 International Conference on Human–Computer Interaction, pp. 1–10. Hornik, J. (1984). Subjective vs. objective time measures: A note on the
perception of time in consumer behavior, Journal of Consumer Research, 11(1), pp. 615–618. Murakami, K. (2016). Psychological research on time evaluation: Gender differences in adolescencec [Translated from Japanese.], Doctoral dissertation, Kibi International University, p. 87. Nah, F.F.-H. (2007). A study on tolerable waiting time: How long are Web
users willing to wait?, Behaviour & Information Technology, 23(3), pp. 153–163. Nakagawa, K. (2001). Development of a website usability questionnaire evaluation method [Translated from Japanese.], Transactions of the Human Interface Society: Proceedings of the 10th Annual Conference, pp. 421–424. Nakanishi, M., Koyama, F. and Iwanaga, K. (2011). The effect of GUI wait-
time information on users’ perception of time: Evaluation using the point of subjective equality (PSE) [Translated from Japanese.], Journal of the Japanese Society for the Science of Design, 58(1), pp. 25–30.
Relationship Between Feedback in Information Processing and Online Shopping 143 Nielsen, J. (June 20, 2010). Website response times. Nielsen Norman Group.
Available at: https://www.nngroup.com/articles/website-response-times/ Ohtsubo, M. and Yoshida, K. (2016). The effect of progress bar shape on time evaluation [Translated from Japanese.], Journal of Biomedical Fuzzy Systems Association, 18(2), pp. 31–39. Oliver, R.L. (1980). A cognitive model of the antecedents and consequences of
satisfaction decisions, Journal of Marketing Research, 17(4), pp. 460–469. Pruyn, A. and Smidts, A. (1998). Effects of waiting on the satisfaction with the service: Beyond objective time measures, International Journal of Research in Marketing, 15(4), pp. 321–334. Sheng, H. and Lockwood, N. (2011). The effect of feedback on web site
delay: A perceptual and physiological study, Proceedings of SIGHCI 2011, pp. 1–10. Taylor, S. (1994). Waiting for service: The relationship between delays and evaluations of service, Journal of Marketing, 58(2), pp. 56–69. Willermark, S., Pantić, N., & Pehrson, H. (2021). Subjectively Experienced
Time and User Satisfaction: An Experimental Study of Progress Indicator Design in Mobile Application. Hawaii International Conference on System Sciences.
LISTED IN THE AHFE DIGITAL BOOKSTORE CATALOGUE
Explore the complete digital volume
Interdisciplinary Practice in Industrial Design
Read this individual research paper free through the original publisher, or explore the full digital proceedings book.
ISBN 978-1-964867-98-4
Explore this ISBN in the AHFE Bookstore ↗Listed in the July 2026 bookstore catalogue; search by ISBN to confirm current availability · Digital book purchase optional