Deteng Huang, Chao Sun, Changhua Gao, Tian Liu, Jiaqi Zhou, Siyuan Guo, DING Li, Qin Yang (2026). Investigating the Regulation of the Circulatory System during Acute Hypobaric Hypoxia Exposure. In: Physical Ergonomics and Human Factors. AHFE Open Access, vol. 223, pp. 8–19. https://doi.org/10.54941/ahfe1007791
To support sustainable lunar exploration, future lunar habitats are proposed to utilize hypobaric hypoxic (HH) internal atmospheres, such as 8.2 psia with 34% O₂ or 7.6 psia with 32% O₂, to optimize crew health and extravehicular activity (EVA) efficiency. However, both chronic adaptation and potential acute exposure due to system leaks pose significant physiological risks, particularly concerning cardiovascular compensation and tissue oxygen utilization, which are not yet fully understood.This study investigated the physiological responses to acute HH exposure by monitoring real-time cardiovascular parameters and skeletal muscle oxygenation in healthy participants. Experiments were conducted under three conditions: normobaric normoxia (simulated 40 m altitude) and acute HH at simulated altitudes of 3500 m and 4500 m.HH exposure induced significant decreases in arterial oxygen saturation, triggering compensatory increases in heart rate, respiratory rate, and tidal volume. Cardiovascular dynamics and skeletal muscle oxygen extraction and consumption exhibited distinct altitude-dependent patterns. These findings clarify the immediate physiological trade-offs between oxygen delivery and utilization under acute hypoxia.This study elucidates the key mechanisms of human cardiovascular and muscular metabolic adaptation to acute HH. The results provide critical physiological data for assessing crew health risks during lunar habitat operations and EVAs, informing the development of environmental control systems, safety protocols, and predictive health models for future deep space missions.
Lunar research stations are a prerequisite for crewed lunar landings and sustained human exploration of the Moon. To support long-duration planetary missions, the NASA Exploration Atmospheres Working Group has proposed the use of hypobaric hypoxic (HH) cabin atmospheres, such as 8.2 psia with 34% O2 (equivalent air altitude of approximately 1213m), as the baseline operating environment for future lunar and Martian habitats. Further depressurization to 7.6 psia with 32% O2 (equivalent air altitude of approximately 2100m) has also been recommended to improve Received February 5, 2026; Revised April 3, 2026; Accepted April 21, 2026; Available online July 20, 2026
Investigating the Regulation of the Circulatory System 9 extravehicular activity (EVA) efficiency and reduce the risk of decompression sicknessLaw, (Jsc, 2013). Consequently, astronauts engaged in future planetary exploration missions will inevitably experience prolonged exposure to hypobaric hypoxic environments. Moreover, in the event of accidental cabin leakage or system failure, crew members may be subjected to more severe acute hypoxic conditions. Both chronic and acute hypoxia pose potential risks to physiological health.
During initial exposure to hypobaric hypoxia, the reduction in inspired oxygen partial pressure leads to corresponding decreases in arterial oxygen partial pressure and arterial oxygen saturation (SpO2) (Norcross, J. R., Conkin, J., Wood, J. H. Iii, et al., 2015). In response, the autonomic nervous system rapidly modulates cardiopulmonary function by increasing heart rate, respiratory rate, and tidal volume to maintain adequate oxygen delivery to tissues(Brierley, G., Parks, T., Wolff, C. B. 2012). Given that future planetary habitats, including lunar research stations, are likely to operate under hypobaric hypoxic atmospheric conditions—such as the 8.2 psia with 34% O2 or 7.6 psia with 32% O2 environments proposed by NASA—and that unplanned system failures may result in more extreme acute hypoxic exposure, a comprehensive understanding of human physiological responses to hypobaric hypoxia is essential.
To investigate the mechanisms by which acute hypobaric hypoxia affects key physiological systems, particularly cardiovascular regulation and local tissue oxygen utilization, the present study continuously monitored cardiovascular parameters and skeletal muscle oxygenation in healthy participants under three environmental conditions: normobaric normoxia (equivalent altitude of 40 m) and acute hypobaric hypoxia at simulated altitudes of 3500 m and 4500 m. By characterizing cardiovascular compensatory responses and adaptive changes in skeletal muscle oxygen metabolism following acute exposure, this study aims to provide direct physiological evidence for assessing acute hypoxia-related health risks faced by astronauts during planetary habitat operations and EVA activities.
PARTICIPANTS Eight healthy male participants were recruited from Beihang University (age: 23.0 ± 1.9 years; height: 178.6 ± 4.3cm; body mass: 70.1 ± 4.3kg). All participants had no history of cardiovascular, pulmonary, or musculoskeletal disorders.The study protocol was approved by the Ethics Committee of the School of Biological Science and Medical Engineering, Beihang University (Approval No. BM20210149), and was conducted in accordance with the principles of the Declaration of Helsinki.
Experimental Environment All experiments were conducted in a high-altitude composite environmental simulation chamber (hypobaric chamber) located in Beijing, as shown in Fig. 1. The internal dimensions of the chamber were 3.0 × 2.0 × 2.7 m (length × width × height).
Experimental Instrumentation Electrocardiogram (ECG) signals were recorded using a 12-lead ambulatory ECG Holter system (TH12, Lepu Medical Technology Co., Ltd., China).
Heart rate (HR) and arterial oxygen saturation (SpO2) were continuously monitored via fingertip pulse oximetry using a multiparameter medical monitor (PC-3000, Likang Bio-Medical Technology Holding Co., Ltd., China).
Skeletal muscle oxygen saturation was assessed using a portable muscle oxygenation monitor (Moxy Monitor, Minnesota, USA) placed over the biceps brachii and gastrocnemius muscles.
Brachial rterial blood pressure was measured using an automated electronic sphygmomanometer (U701, Omron Dalian Co., Ltd., China).
Experimental Procedure Each participant completed three experimental sessions in the hypobaric environmental simulation chamber: normobaric normoxia (40 m), moderate hypobaric hypoxia (3500 m), and severe hypobaric hypoxia (4500 m). To prevent acclimatization to hypobaric hypoxia,a minimum interval of one week was maintained between consecutive sessions. The study employed a randomized single-blind design:participants were fully informed of the experimental procedures but were unaware of the pressure condition during each session.
The overall experimental protocol consisted of a ground preparation phase and an experimental phase. The experimental phase included four consecutive stages: baseline rest at sea level, ascent, hypoxic rest, and descent.
Ground Preparation Phase: Upon arrival, participants performed a 10-minute warm-up. Subsequently, the following monitoring devices were attached: 12-lead ECG, muscle oxygen saturation monitors, multiparameter physiological monitors, and a blood pressure cuff. ECG signals were acquired using a 12-lead configuration as illustrated in Fig. 2. Electrodes were further secured with medical tape to prevent detachment during testing.
LA RA V1 V2
V3
V4 V5 V6
RL LL
Figure 2: Placement of 12-lead ECG electrodes on the participant’s body.
Figure available in the original PDF paper.
Muscle oxygen saturation was measured at the biceps brachii of the left arm and the gastrocnemius of the left leg using near-infrared spectroscopy sensors.
The fingertip pulse oximeter of the multiparameter monitor was placed on the participant’s left index finger for continuous SpO2 measurement. The blood pressure cuff was wrapped around the right upper arm, ensuring that the center of the bladder aligned with the point of maximal brachial artery pulsation, with the lower edge approximately 2.5 cm above the cubital crease, for accurate blood pressure measurement.
Experimental Phase Baseline Rest at Sea Level: Participants, accompanied by one researcher, entered the chamber and were equipped with the fingertip pulse oximeter and 12-lead ECG. Safety instructions and operational precautions were explained prior to data collection. Participants then remained seated at rest for 10 minutes. Immediately following the baseline rest, brachial arterial blood pressure was measured.
Ascent Phase: After the 10-minute baseline, a chamber operator outside the chamber adjusted the pressure to simulate ascent at a rate of 5 m/s until the target hypobaric altitude (3500 m or 4500 m) was reached. For the normobaric normoxia condition, the baseline rest period was extended by 10 minutes, during which the chamber’s fresh air circulation system operated, generating ambient noise to prevent participants from distinguishing the experimental condition.
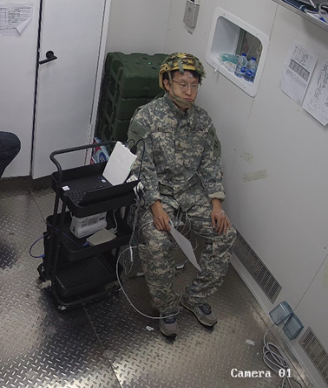
Hypoxic Rest Phase: Upon reaching the target altitude, one researcher verified the quality of ECG, SpO2, muscle oxygen saturation, and heart rate signals. Participants then remained seated at the target hypobaric hypoxic environment for 50 minutes. Brachial arterial blood pressure was measured every 10 minutes. During this period, participants were instructed to avoid any physical activity, as illustrated in Fig. 3.
Figure 3: Schematic of the hypobaric hypoxic rest phase.
Descent Phase: A chamber operator outside the chamber gradually reduced the pressure at a rate of 3 m/s until sea-level conditions were restored. During descent, the accompanying researcher reminded participants to swallow or drink water as needed to prevent ear discomfort. In the normobaric normoxia condition, no descent phase was performed; however, participants were continuously monitored, and the rest period was extended to match experimental duration. Upon reaching the ground, participants exited the chamber and all physiological monitoring devices were removed, marking the end of the experimental session.
Throughout all experimental phases, ECG, SpO2, and muscle oxygen saturation signals were continuously recorded.
Termination Criteria: The experiment was immediately terminated, and participants were provided with 100% oxygen if any of the following criteria were met: (1) SpO2 dropped below 75%, (2) heart rate exceeded 150 bpm accompanied by arrhythmia, (3) sudden decrease in heart rate, or (4) onset of presyncope symptoms such as chest tightness, chest pain, dizziness, or transient visual blackout.
Data Processing HRV analysis included both time-domain and frequency-domain metrics. Time-domain indices comprised the root mean square of successive differences (RMSSD), the standard deviation of normal-to-normal intervals (SDNN), and the mean heart rate (meanHR). Frequency-domain analysis included low-frequency power (LF), high-frequency power (HF), and the LF/ HF ratio. Mean heart rate was calculated as the reciprocal of the interbeat interval, as described in Equation (1).
1 60 N
Equation available in the original PDF paper.
n n meanHR N RR (1)
where, Nrepresents the total number of interbeat intervals (IBIs), and n RR denotes the duration of the n-th IBI in seconds (s).
The root mean square of successive differences (RMSSD) reflects the short- term variability between consecutive heartbeats and serves as a time-domain HRV metric indicative of parasympathetic nervous system (PNS) activity. RMSSD is calculated as follows Equation (2):
− N ( )
1 1
Equation available in the original PDF paper.
n n n RMSSD RR RR N (2)
1 2 1 1
where, +1 n RR and n RR represent two consecutive interbeat intervals (IBIs), expressed in seconds (s).
The standard deviation of normal-to-normal intervals (SDNN) reflects the overall variability of the interbeat interval (IBI) time series and is calculated as the standard deviation of IBIs relative to their mean. SDNN is computed as follows Equation (3):
2
1 N
( )
Equation available in the original PDF paper.
n n SDNN RR meanRR N (3)
1
Where, meanRR represents the mean interbeat interval, expressed in seconds (s).
HRV time-domain and frequency-domain metrics were calculated using 5-minute analysis windows. For the 10-minute baseline rest at sea level, the last 5 minutes of HRV data were used for metric computation. During the 50-minute hypoxic rest phase at the target altitude, two time windows were selected: 5–10 minutes (early phase) and 45–50 minutes (late phase) after the onset of hypoxic exposure.
Because the interval between consecutive experimental sessions for each participant was substantial, baseline HRV parameters varied across sessions, potentially confounding the analysis of acute hypobaric hypoxia effects. To address this, HRV metrics were expressed as relative changes from the corresponding sea-level baseline, providing a more accurate assessment of the effects of different hypobaric hypoxic environments. The relative change was calculated as follows Equation (4): − = *100% HRV HRV HRV BMA SLR RC SLR (4)
HRV
where RC_HRV represents the relative change of the HRV parameter, BMA_ HRV denotes the absolute HRV value during the hypoxic rest phase at the target altitude, and SLR_HRV denotes the absolute HRV value during the baseline rest at sea level.
SpO2 and Muscle Oxygen Saturation (SmO2): During data acquisition, partial data loss occurred due to finger movement or transmission issues. Missing segments were interpolated using linear interpolation to allow subsequent feature computation. For both SpO2 and SmO2 signals, feature
values were calculated as the mean within 5-minute analysis windows. For the 10-minute baseline rest at sea level, the last 5 minutes of data were used. During the 50-minute hypoxic rest phase at the target altitude, two time windows were selected: 5–10 minutes after the onset of hypobaric hypoxia to represent early exposure, and 45–50 minutes to represent short-term exposure.
Because baseline values of SpO2 and SmO2 varied between sessions for each participant, relative changes from the corresponding sea-level baseline were calculated to account for inter-individual differences and to more accurately evaluate the effects of different hypobaric hypoxic conditions on systemic and muscular oxygenation.
Blood Pressure: Systolic (SBP) and diastolic blood pressure (DBP) were analyzed at three time points: baseline rest at sea level, 10 minutes after the onset of hypobaric hypoxia, and 50 minutes after exposure. These measurements were used to assess acute and short-term cardiovascular responses to hypobaric hypoxic environments.
Statistical Analysis All statistical analyses were performed using SPSS 25.0 (IBM Corp., Armonk, NY, USA). Data are presented as mean ± standard deviation (SD).
For SpO2 and muscle oxygen saturation (SmO2), both absolute values and changes from baseline at 10 and 50 minutes of hypobaric hypoxia were first tested for normality using the Shapiro–Wilk test. Two-way repeated measures analysis of variance (RM-ANOVA) was then conducted to evaluate the effects of time (baseline, 10 minutes, and 50 minutes) and altitude (40 m, 3500 m, 4500 m) on SpO2 and SmO2, including main effects and interaction effects. Post hoc pairwise comparisons were performed using the Bonferroni correction to identify specific differences.
For the relative changes in HRV parameters at 10 and 50 minutes of hypobaric hypoxia compared with baseline, normality was assessed with the Shapiro–Wilk test. Two-way RM-ANOVA was applied to examine the effects of time (10 minutes and 50 minutes) and altitude (40 m, 3500 m, 4500 m) on HRV relative changes, including main effects and interaction effects. Bonferroni-adjusted post hoc tests were conducted for pairwise comparisons.
For systolic (SBP) and diastolic blood pressure (DBP), normality was assessed using the Shapiro–Wilk test. Two-way RM-ANOVA was applied to analyze the effects of time (baseline, 10 minutes, and 50 minutes) and altitude (40 m, 3500 m, 4500 m) on SBP and DBP, with main effects and interaction effects evaluated. Bonferroni-corrected post hoc comparisons were performed to identify specific differences.
RESULT
Absolute values of SpO2 and muscle oxygen saturation (SmO2) at all altitudes and time points, as well as the changes from baseline at 10 and 50 minutes of hypobaric hypoxia, were normally distributed.
Analysis of absolute values using two-way repeated measures ANOVA revealed the following:
Investigating the Regulation of the Circulatory System 15 SpO2 exhibited significant main effects of time (F = 296.189, p < 0.001), altitude (F = 126.410, p < 0.001), and a significant time × altitude interaction (F = 96.486, p < 0.001).
Biceps brachii SmO2 showed a significant main effect of time (F = 23.899, p < 0.001) and a significant time × altitude interaction (F = 8.256, p < 0.001), but no main effect of altitude.
Gastrocnemius SmO2 exhibited significant main effects of time (F = 32.082, p < 0.001) and a significant time × altitude interaction (F = 13.155, p < 0.001), with no main effect of altitude.
Post hoc pairwise comparisons with Bonferroni correction are presented in Fig. 4(a–c). After 10 and 50 minutes of acute exposure at 3500 m and 4500 m, SpO2, biceps brachii SmO2, and gastrocnemius SmO2 were all significantly lower than at baseline (all p < 0.001). At 4500 m, gastrocnemius SmO2 further decreased at 50 minutes, significantly lower than at 10 minutes (p = 0.033). Significant differences in SpO2 were observed between altitudes at both 10 and 50 minutes (all p < 0.001).
Analysis of the change-from-baseline data showed the following: SpO2 exhibited a significant main effect of altitude (F = 125.26, p < 0.001). Biceps brachii SmO2 showed a significant main effect of altitude (F = 11.359, p < 0.001).
Gastrocnemius SmO2 exhibited significant main effects of time (F = 8.477, p = 0.009) and altitude (F = 17.034, p < 0.001).
Post hoc pairwise comparisons with Bonferroni correction are presented in Fig. 4(d–f). For SpO2, biceps brachii SmO2, and gastrocnemius SmO2, the changes from baseline at 3500 m and 4500 m after 10 and 50 minutes were significantly greater than at 40 m (all p < 0.001). SpO2 changes at 4500 m were also significantly greater than at 3500 m at both 10 and 50 minutes (p < 0.001). Furthermore, the changes in SpO2 and gastrocnemius SmO2 at 4500m after 50minutes were further increased, significantly differing from the 10-minute values (SpO2: p = 0.05; gastrocnemius SmO2: p = 0.011).
Figure 4: Blood oxygen saturation (SpO2) and muscle oxygen saturation (SmO2) at different altitudes across experimental phases.
Figure available in the original PDF paper.
Relative changes from baseline at 10 and 50 minutes of hypobaric hypoxia at all altitudes were normally distributed across all HRV metrics. Two-way repeated measures ANOVA for time-domain HRV indices revealed the following: lnRMSSD exhibited a significant main effect of altitude (F = 9.741, p = 0.001), with no significant main effect of time or time × altitude interaction.
meanHR also showed a significant main effect of altitude (F = 43.040, p < 0.001), with no significant main effect of time or interaction effect. SDNN showed no significant main or interaction effects. Post hoc pairwise comparisons with Bonferroni correction are presented in Fig. 5(a–c). The relative changes in meanHR at 4500 m after 10 and 50 minutes of exposure were significantly greater than at 40 m and 3500 m. Similarly, lnRMSSD relative changes at 4500 m after 10 and 50 minutes were significantly larger than those at 40 m and 3500 m. At 3500 m, lnRMSSD relative changes at 50 minutes were significantly smaller than at 10 minutes (p = 0.043), indicating a partial recovery of parasympathetic activity over time.
Two-way repeated measures ANOVA for frequency-domain HRV indices revealed the following: lnHF exhibited a significant main effect of altitude (F = 3.708, p = 0.049), with no significant main effect of time or time × altitude interaction.
10min habituation
50min habituation ✱✱✱ (a) (b) (c) ✱✱
30
✱✱✱
10
✱✱
20
0
0
✱
0
✱✱✱
✱✱
✱✱✱
✱✱✱
Relative change of SDNN (%)
Relative change of meanHR(%)
Relative change of lnRMSSD(%)
Altitude(m)
Altitude(m)
Altitude(m) (d) (e) (f) ✱
5
0
0
5
0
-5 ✱
Relative change of lnHF(%)
Relative change of lnLF(%)
Relative change of lnLF/lnHF(%)
Altitude(m)
Altitude(m)
Altitude(m)
Figure 5: Relative changes in time-domain (lnRMSSD, SDNN, meanHR) and frequency- domain (lnLF, lnHF, lnLF/lnHF) heart rate variability (HRV) indices during hypobaric hypoxia at 10 and 50 minutes compared with sea-level baseline.
Figure available in the original PDF paper.
lnLF and lnLF/lnHF showed no significant main or interaction effects. Post hoc pairwise comparisons with Bonferroni correction are presented in Fig. 5(d–f). The relative changes in lnHF at 4500 m after 10 and 50 minutes of hypobaric hypoxia were significantly greater than at 40 m at 10 minutes
Investigating the Regulation of the Circulatory System 17 (p = 0.048) and 50 minutes (p = 0.046), indicating reduced parasympathetic modulation with increasing altitude.
Systolic (SBP) and diastolic blood pressure (DBP) data at all altitudes and time points were normally distributed. Two-way repeated measures ANOVA revealed the following: SBP exhibited a significant time × altitude interaction (F = 4.724, p = 0.004), with no significant main effects of time or altitude.
DBP showed no significant main or interaction effects. Post hoc pairwise comparisons with Bonferroni correction are presented in Fig. 6(a). Acute exposure at 3500 m and 4500 m for 10 minutes resulted in significant reductions in SBP (3500 m: p = 0.009; 4500 m: p = 0.05). At 3500 m after 50 minutes, SBP returned to levels not significantly different from sea-level baseline, whereas at 4500 m after 50 minutes, SBP decreased further and was significantly lower than baseline (p = 0.01). Additionally, SBP at 3500 m after 10 minutes was significantly lower than at 40 m at the same time point (p = 0.015).
✱✱
4500 (a) (b)
Diastolic pressure(mmHg)
Systolic blood pressure(mmHg)
Ground
Ground
rest
10min habituation
50min habituation
rest
10min habituation
50min habituation
Figure 6: Systolic (SBP) and diastolic (DBP) blood pressure at different altitudes and experimental phases.
Figure available in the original PDF paper.
DISCUSSION
This study compared the physiological responses of healthy participants under normobaric normoxia (40 m) and acute moderate (3500 m) and severe (4500 m) hypobaric hypoxia (HH), focusing on SpO2, muscle oxygen saturation (SmO2), heart rate variability (HRV), and blood pressure (BP) (Lang, M., Bilo, G., Caravita, S., et al., 2021).
Acute moderate hypoxia (3500 m) induced modest decreases in SpO2 and SmO2, while cardiovascular and autonomic parameters remained largely stable, indicating that compensatory mechanisms were sufficient to maintain oxygen delivery. In contrast, acute severe hypoxia (4500 m) exceeded the compensatory capacity (Guzik, P., Piskorski, J., Krauze, T., et al., 2007), leading to pronounced increases in heart rate and sympathetic nervous system (SNS) activity, reduced parasympathetic activity, and further declines in SpO2 and calf muscle oxygenation, reflecting a transient decompensated state.
Exposure to hypobaric hypoxia rapidly reduced arterial oxygen saturation, causing a corresponding decline in local muscle oxygenation. Proximal muscles, such as the biceps, were less affected due to higher blood perfusion,
whereas distal muscles, like the gastrocnemius, showed greater decreases over time, especially under severe hypoxia. These changes indicate that tissue oxygen supply during acute HH is primarily limited by arterial oxygen content and local perfusion rather than metabolic demand.
Autonomic responses were characterized by increased SNS activity and reduced parasympathetic (PNS) modulation. Time-domain HRV (lnRMSSD) and high-frequency components (lnHF) decreased with increasing altitude, indicating vagal suppression, while mean HR increased significantly under severe hypoxia (Billman, G. E. 2013). LF/HF ratios shifted toward sympathetic dominance, consistent with a compensatory response to maintain oxygen delivery to vital organs.
Systolic blood pressure (SBP) initially decreased under acute HH, likely due to enhanced vasodilatory effects of endothelial factors, and recovered partially at 3500 m but continued to decline at 4500 m, reflecting the limits of short-term cardiovascular compensation.
Overall, acute HH triggers a coordinated response involving increased heart rate, selective redistribution of blood flow, and modulation of autonomic activity to maintain tissue oxygenation, with severity and exposure duration determining the balance between compensation and decompensation.
CONCLUSION
Acute exposure to hypobaric hypoxia caused dose-dependent decreases in SpO2 and SmO2, accompanied by rapid autonomic adjustments. Moderate hypoxia (3500 m) was well compensated, while severe hypoxia (4500 m) led to partial decompensation, characterized by persistent reductions in calf muscle oxygenation, elevated HR, sympathetic dominance, and transient SBP decline. These findings provide direct physiological evidence for assessing crew health risks during lunar habitats and extravehicular activities (EVA) and offer a foundation for optimizing predictive models of human adaptation to hypobaric hypoxia in planetary environments.
REFERENCES
Billman, G. E. (2013). The LF/HF Ratio Does Not Accurately Measure Cardiac Sympatho-Vagal Balance, Frontiers in Physiology, Volume 4, No. 1, 26. https:// doi.org/10.3389/fphys.2013.00026. Bilo, G., Villafuerte, F. C., Faini, A., et al. (2015). Ambulatory Blood Pressure in
Untreated and Treated Hypertensive Patients at High Altitude: The High Altitude Cardiovascular Research–Andes Study, Hypertension, Volume 65, No. 6, 1266- 1272. https://doi.org/10.1161/HYPERTENSIONAHA.114.05003. Brierley, G., Parks, T., Wolff, C. B. (2012). The Relationship of Acute Mountain Sickness to Arterial Oxygen Saturation at Altitudes of 3,324 to 5,176 m, Oxygen Transport to Tissue XXXIII Volume 737, Springer New York, 207–212. https:// doi.org/10.1007/978-1-4614-1566-4_30. Conkin, J. (2023). Previous Contributing Authors – DCS Evidence Report, National
Aeronautics and Space Administration, Johnson Space Center, Volume 2023, No. 1.
Investigating the Regulation of the Circulatory System 19 Guzik, P., Piskorski, J., Krauze, T., et al. (2007). Correlations Between the Poincaré
Plot and Conventional Heart Rate Variability Parameters Assessed During Paced Breathing, The Journal of Physiological Sciences, Volume 57, No. 1, 63–71. https://doi.org/10.2170/physiolsci.RP005506. Kanai, M., Nishihara, F., Shiga, T., et al. (2001). Alterations in Autonomic Nervous Control of Heart Rate Among Tourists at 2700 and 3700m Above Sea Level, Wilderness & Environmental Medicine, Volume 12, No. 1, 8–12. https://doi. org/10.1580/1080-6032(2001)012[0008:AIANCO]2.0.CO;2. Khandoker, A. H., Karakar, C., Brennan, M., et al. (2013). Poincaré Plot Methods
for Heart Rate Variability Analysis, Springer US, Volume 1, No. 1. https://doi. org/10.1007/978-1-4614-7375-6. Lang, M., Bilo, G., Caravita, S., et al. (2021). Blood Pressure and High Altitude: Physiological Response and Clinical Management, Medwave, Volume 21, No. 4, e8194. https://doi.org/10.5867/medwave.2021.04.8194. Law, J. Jsc, S. (2013). Effects of the 8 psia / 32% O2 Atmosphere on the Human in
the Spaceflight Environment. Marshall, J. M. (1994). Peripheral Chemoreceptors and Cardiovascular Regulation, Physiological Reviews, Volume 74, No. 3, 543–594. https://doi.org/10.1152/ physrev.1994.74.3.543. McCrathy, R., Shaffer, F. (2015). Heart Rate Variability: New Perspectives on
Physiological Mechanisms, Assessment of Self-Regulatory Capacity, and Health Risk, Global Advances in Health and Medicine, Volume 4, No. 1, 46–61. https:// doi.org/10.7453/gahmj.2014.073. Norcross, J. R., Conkin, J., Wood, J. H. Iii, et al. (2015). Risk of Hypobaric Hypoxia from the Exploration Atmosphere, Aviation, Space, and Environmental Medicine, Volume 86, No. 10. Olshansky, B., Sabbah, H. N., Hauptman, P. J., et al. (2008). Parasympathetic
Nervous System and Heart Failure: Pathophysiology and Potential Implications for Therapy, Circulation, Volume 118, No. 8, 863–871. https://doi.org/10.1161/ CIRCULATIONAHA.107.760405. Pollock, N. W. (2021). Advanced Environmental Exercise Physiology, 2nd Edition, Wilderness & Environmental Medicine, Volume 32, No. 3, 419. https://doi. org/10.1016/j.wem.2021.04.006. Richard, N. A., Koehle, M. S. (2012). Differences in Cardio-Ventilatory Responses
to Hypobaric and Normobaric Hypoxia: A Review, Aviation, Space, and Environmental Medicine, Volume 83, No. 7, 677–684. https://doi.org/10.3357/ ASEM.3182.2012. Torlasco, C., Bilo, G., Giuliano, A., et al. (2020). Effects of Acute Exposure to Moderate Altitude on Blood Pressure and Sleep Breathing Patterns, International Journal of Cardiology, Volume 301, No. 1, 173–179. https://doi.org/10.1016/j. ijcard.2019.09.034.
LISTED IN THE AHFE DIGITAL BOOKSTORE CATALOGUE
Explore the complete digital volume
Physical Ergonomics and Human Factors
Read this individual research paper free through the original publisher, or explore the full digital proceedings book.
ISBN 978-1-964867-99-1
Explore this ISBN in the AHFE Bookstore ↗Listed in the July 2026 bookstore catalogue; search by ISBN to confirm current availability · Digital book purchase optional