Siyuan Guo, Bingqian Li, Yuanyuan Liu (2025). Exploring Cross-Sensory Perception in Dining Environments: The Role of Tactile Surface Properties on Users’ Visual and Gustatory Experiences. In: Affective and Pleasurable Design. AHFE Open Access, vol. 164, pp. 64–75. https://doi.org/10.54941/ahfe1006061
Sensory experiences within dining environments play a crucial role in shaping users behavior and emotional responses. This research explores the impact of tactile surface properties on users’ cross-sensory perception of vision and taste within the specific context of dining environments. A controlled experimental design was employed, categorizing material samples based on two tactile dimensions—surface roughness and hardness—resulting in four distinct groups. 24 participants engaged in blind tactile exploration of these materials while completing a cross-sensory perception questionnaire. Analysis of subjective evaluation data revealed that tactile surface properties significantly influenced both visual and taste perception, as well as emotional responses. For instance, materials with higher roughness were associated with heavier and warmer visual impression and specific flavor taste experiences such as saltiness or bitterness, evoking sensations of richness and depth. In contrast, smoother materials were associated with lighter and cleaner visual impressions, often linked to sensations of coolness and sweet-sour flavor profiles, thus fostering a more refreshing and pleasant emotional experience. Similarly, materials exhibiting greater hardness were perceived as more formal and reliable, intensifying the perception of stronger and richer taste. Electroencephalogram (EEG) data further demonstrated that variations in tactile properties activated distinct brain regions related to emotion and sensory integration, such as the prefrontal cortex and parietal lobe. By integrating both subjective and objective measures, this study reinforces the influence of tactile properties on cross-sensory perception. These findings offer valuable insights for designers in selecting materials for products in dining environments, such as tableware and kitchenware. By aligning tactile feedback with users’ visual and gustatory expectations, designers can create more harmonious, immersive, and emotionally fulfilling dining experiences.
Exploring Cross-Sensory Perception in Dining Environments 65
not merely spaces for food consumption but immersive environments where multiple sensory modalities interact to influence perception and emotional responses (Liu et al., 2022). Most people are familiar with vision as the sense dominating the perceptual experience (Huang et al., 2015), thus it has been skillfully utilized to enhance the experience design of dining spaces. For instance, studies have shown that vibrant colors are often associated with sweetness, while muted tones are linked to bitterness (Charles, 2015).
Among the senses, touch stands out as a fundamental and proactive human sense, has the unique advantages of immediacy and low cognitive load (Hayward, 2004). Tactile perception through finger touch plays an essential role in our interaction with products and can significantly impact user experience (Gueorguiev et al., 2016). The diverse materials used in dining spaces possess distinct tactile properties that evoke varying physical sensations and emotional associations.
Surface roughness and hardness are two of the basic properties of materials and the main way we recognize materials by touch (Ding et al., 2017). It has been found that surface roughness—whether rough or smooth—have been shown to elicit specific emotional and affective responses, thereby shaping visual impressions and taste perception (Kosuke et al., 2023). However, the role of tactile properties in cross-sensory perception within dining contexts remains underexplored.
This research aims to bridge this gap by investigating how the tactile properties of material surfaces—specifically surface roughness and hardness—affect users’ visual and gustatory perception through cross- sensory integration. By focusing on the interaction between tactile feedback and other sensory modalities, this research provides valuable insights into the underlying mechanisms of cross-sensory experiences and offering practical guidance for designers in creating dining environments that align tactile properties with users’ visual and gustatory expectations to enhance the overall experience.
METHODS
As shown in Figure 1, the study was conducted in three steps: i) Preparation; ii) Experiment; and iii) Analysis. In the preparation step, we prepared the experimental equipment, including measuring samples, subjective experience scales and designing EEG measurement devices. During the Experiment step, specific experiments were conducted, including pre-experiment, subject recruitment and the formal experiment. In the Analysis step, the experimental results were analyzed to find out the correlation between surface haptic properties and users’ cross-sensory perceptual experience.
Figure 1: Study design.
Figure available in the original PDF paper.
STEP 1: PREPARATION Selection of Material Samples
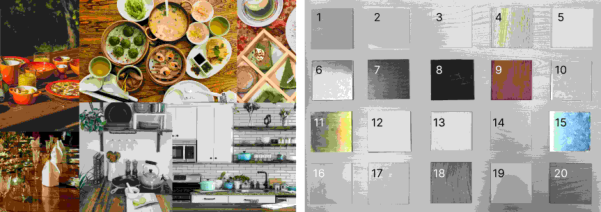
Using keywords such as “dining space”, “tableware”, “eating” and “restaurant”, we collected images from image platforms. By analyzing the main interaction points and frequently used materials, we identified five material categories, metal, wood, ceramics, plastics, and glass, to represent the range of samples. Based on this analysis, we acquired 20 kinds of material samples as listed in Figure 2. To maintain consistency and control for irrelevant variables, all samples were standardized to 100mm × 100cm × 3mm.
Figure 2: Dining environment intentions (left) and 20 kinds of material samples (right).
Measurement of Material Surface Parameters The tactile properties of the materials were assessed based on two key parameters: roughness and hardness, both perceived through tactile interactions (e.g., touch or pressure). A Shore hardness tester and a surface roughness tester were used to measure these properties for each sample. Each material was measured three times, and the average value was calculated after excluding data with significant errors. The final results are shown in Table 1.
To facilitate material categorization, roughness and hardness were classified into three levels: low, moderate and high. This categorization ensured that materials within the same category had comparable perceptual impact. For instance, materials with low roughness (Ra ≤0.1 µm) were perceived as smooth, those with moderate roughness (Ra = 0.1 to 1 µm) felt slightly textured, and those with high roughness (Ra > 1 µm) were distinctly rough to the touch.
Table 1: Measurement results (roughness and hardness) & interval division.
Low Moderate High Low Moderate High < 0.100 0.100 ∼1.000 >1.000 <40.00 40.00 ∼80.00 >80.0 Design of Subjective Evaluation Scales
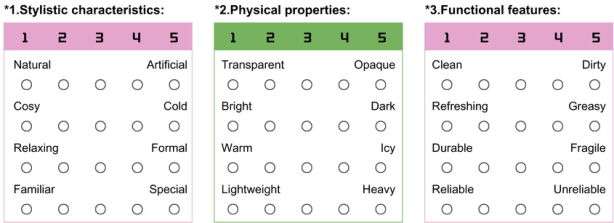
For the visual dimension of the cross-sensory perception, we adopted Likert scale, a widely used psychometric scale that allows participants to express their level of agreement with specific statements (Yang, 2010). Based on previous research points on sensory experiences, we identified the visual perception associated with tactile experiences in dining environments. Since different physical properties engage distinct sensory modalities, exploring cross-sensory associations between these properties became a key focus. Additionally, functionality and aesthetic preferences are critical factors in selecting products. Consequently, we established three evaluation dimensions: style characteristics, physical properties, and functional attributes. Keywords for these dimensions were first gathered from literature reviews, supplemented by focus group discussions, and finalized through confirmatory categorization. Each dimension includes four opposing keyword pairs placed at opposite ends of the Likert scale as shown in Figure 3, enabling the collection of subjective evaluation data under specific experimental conditions.
Figure 3: Visual evaluation vocabulary.
As the material samples in this study could not directly provide gustatory experiences, participants relied on associations or prior knowledge to perceive taste. Inspired by the Self-Assessment Manikin (SAM) scale (Bradley and Lang, 1994), we developed an innovative taste perception evaluation method. Participants first answered three qualitative questions regarding the taste sensations, temperate and food states they associated with each material. These were followed by a quantitative evaluation of the activation level
of their taste experience using 5-level A-value (Arousal) scale. The specific questions included associations with taste sensations (e.g., sour, sweet, salty), perceived temperature (e.g., cold, ambient, hot), and food states (e.g., solid, liquid). Finally, participants rated the intensity of their experience from “Very inactive” to “Very active”.
Determining EEG Measurement Protocols EEG signals, generated by brain activity, are closely associated with cognitive process such as perception, memory, emotion, language, and decision- making. It reflects activities of different cortical regions and can monitor physiological states as well as interactions between functional brain areas (Buzsáki et al., 2012). For this study, we used the ErgoLAB portable water- electrode EEG system to collect signals during experiment which employs a 32-channel electrode configuration.
STEP 2: EXPERIMENT Participants
We recruited 24 students from various academic majors, including both undergraduates and graduate students. The group comprised 14 males and 10 females, with an average of 22.3 years old and all were right-handed. Each participant completed the experiment in approximately 40 minutes and received an experimental grant for their participation.
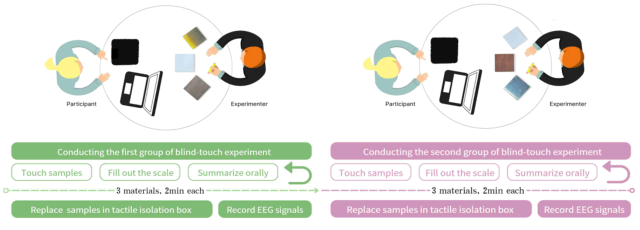
Experimental Procedure As shown in Figure 4, before the experiment, we would explain the experimental procedure and help the participants to put on the electrode caps to ensure that the EEG signals are properly acquired. Participants were informed that the materials they would experience were representative and all from the restaurant environment. They were shown a series of intentional maps of the restaurant space to align their cross-sensory perceptual experiences with the intended context.
The experiment was divided into two sessions: one focusing on surface roughness and the other on hardness. In each session, participants engaged in blind tactile exploration of three different material samples. They used their left hand to feel the materials inside a tactile isolation box, while simultaneously completing a cross-sensory perception questionnaire on a computer with their right hand. The tactile isolation box (220mm × 220mm × 150mm) was special designed to create blind touch conditions, with materials being replaced on the back side of the box by the experimenter. The order of material presentation was randomized to reduce potential sequence effects and improve data reliability.
After completing the questionnaire for each material, participants were asked to provide short verbal description of their associations and impressions. This step allowed for the collection of qualitative data and helped maintain the participants’ sensory engagement throughout the
Exploring Cross-Sensory Perception in Dining Environments 69
experiment. A one-minute break was provided between sessions to mitigate any potential learning effects.
Figure 4: Experimental procedure.
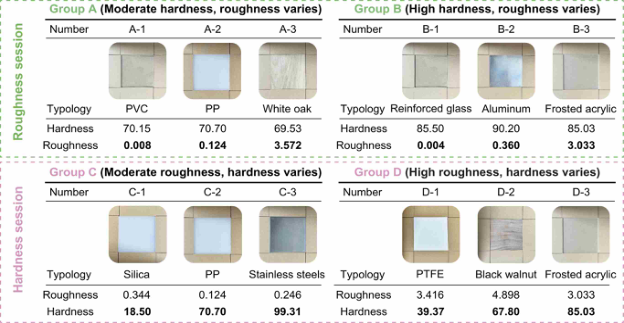
Task Contents Design During the blind-touch experiment, two separate sessions were conducted to isolate different tactile properties (roughness and hardness). Each session had two material combinations as presented in Figure 5.
Figure 5: Four groups of materials for experiment.
In the first session, 2 material combinations (Group A & B) were delineated based on previous measurements. 3 materials in the same group had similar hardness levels but varied in surface roughness (low, moderate, high), mainly exploring the effect of roughness on cross-sensory perception. While in the second session, there were also 2 material combinations (Group C & D). 3 materials in the same group had similar roughness levels but varied in hardness (low, moderate, high), enabling the exploration of hardness effects on cross-sensory perception.
To avoid participants experiencing the same material and to maintain data reliability, 12 participants (including 6 with EEG data) were assigned to the
group A+D design; while the remaining 12 participants (also including 6 with EEG data) were assigned to the group B+C design. Figure 6 shows a photographic record of some of the experiments.
Figure 6: Photographs of some experiments.
STEP 3: ANALYSIS The data collected in this experiment can be categorized into two types: subjective evaluation data and objective physiological data. Different data types required the use of distinct analytical tools and methods as shown in Table 2.
Subjective Data Analysis To evaluate how tactile properties (roughness and hardness) influenced visual perception, we conducted one-way ANOVA (λ=0.05). The analysis revealed that roughness significantly impacted dimensions such as Natural-Artificial, Cosy-Cold, Relaxing-Formal and others, while hardness significantly influenced dimensions like Warm-Icy and Clean-Dirty (as shown in Table 3). For gustatory perception, cross-covariance analysis showed that roughness significantly influenced specific flavor, perceived temperature, and food status, while hardness influenced Arousal value (see Table 4).
Table 3: Data analysis results of visual perception.
Table available in the original PDF paper.
Session 1 (Average Value ± Standard Deviation) F P Low Moderate High Natural-Artificial 4.42±1.02 4.29±1.12 2.50±1.67 3.429 0.038* Cosy-Cold 3.67±1.09 3.83±1.17 1.96±1.12 19.542 0.000** Relaxing-Formal 3.17±1.24 3.00±1.38 2.29±1.40 25.427 0.000** Familiar-Special 2.25±1.19 2.58±1.14 3.21±1.50 30.488 0.000** Transparent-
To complement the quantitative data, thematic coding of participants’ descriptive statements provided deeper insights. For roughness correlations, participants provided descriptions such as “It feels like an iron spoon or fork in a Western restaurant, touches icy, rather silky.” “Pretty smooth, associate with the coating of a pot, or the glaze of a plate.” “Very natural and primitive, think of a barrel meal.” “Like eating in a cabin, cosy and relaxing.” For hardness associations, typical descriptions included “A dessert wrapping material that is lighter and brighter.” “Like soft spoons, plates, bowls, and such that won’t break.” “A little crunchy and tough, might make a knife for cutting cakes.” By integrating these qualitative insights with the statistical analyses, a more nuanced understanding of how tactile properties (roughness and hardness) shape users’ visual and gustatory experiences is achieved.
Objective Data Analysis The objective data in this study consist of EEG signals recorded as participants touched different materials and completed subjective evaluation questionnaires, resulting in a total of 12×6×16×32 data segments. Using the recording playback function in the ErgoLAB software, 12-second intervals were marked, and the data were exported to EEGLAB 2022.1 in MATLAB R2020a for further analysis. Due to variations in data quality, an initial analysis was conducted to assess differences in EEG activity across participants. By extracting the average cortical activity values for the same time intervals in the roughness and hardness sessions, and calculating the mean variance, no correlation was found between individual differences and cortical activity. Therefore, the analysis focused on aggregated EEG data rather than individual signals.
Pre-processing steps included electrode localization, filtering, independent component analysis (ICA), and artifact removal (Sun, 2012). EEG signals were subsequently transformed from the time domain to the frequency domain using fast Fourier transform (FFT) for spectral analysis. Event-related spectral perturbation (ERSP) plots were then generated to illustrate spectral power across different electrodes and frequency bands.
Cross-sensory perception involves complex brain activity (Jon Driver et al., 2008). The tactile-induced visual and gustatory perception are mainly
Exploring Cross-Sensory Perception in Dining Environments 73
associated with the activation of the frontal, parietal, and occipital lobes and are primarily reflected in three frequency bands: alpha (8–14 Hz), beta (14–30 Hz), and gamma (30–40 Hz) (Aamir et al., 2018). Therefore, EEG signals from 7 electrodes—P3, P4, POZ, PZ, FP1, FP2, and FPZ—were selected for analysis. Bandpass filtering was applied to isolate the signals into alpha, beta, and gamma bands. By comparing the spectral energy of significant questionnaire items with non-significant items, the validity of the subjective evaluation data was preliminarily verified.
DISCUSSION
This research investigated how the tactile properties of materials, specifically surface roughness and hardness, influence cross-sensory perception in dining environment. Our findings indicated that participants often associate tactile sensations with their own familiar products or prior experiences, leading to visual and gustatory perception. This suggests that cross-sensory perception variations relate to individual environmental backgrounds (Zuo, 2010). Overall, the influence of tactile properties on cross-sensory perception is reflected in four key aspects: i) Materials with higher roughness are perceived as more natural, warm, and relaxing, aligning with traditional or rustic dining environments. Conversely, smoother materials are associated with transparency, brightness, and coolness, conveying a sense of cleanliness and modernity. ii) Materials with higher hardness are perceived as formal, cool, and reliable, suitable for functional or formal settings. Softer materials, on the other hand, evoke warmth and relaxation, making them appropriate for casual scenarios. iii) Lower roughness materials are more likely to be associated with sweet, cold, and liquid food items (chilled drinks or ice cream), while higher roughness materials are linked to salty, room temperature, and solid foods (bread or nuts). iv) Increased hardness enhances the activation of taste associations, particularly intensifying perception of strong flavors such as saltiness or sourness.
These results are consistent with previous research on cross-modal sensory interactions. For instance, studies have demonstrated that tactile features of food can influence taste perception, with smoother textures often associated with sweetness and rougher textures with bitterness or saltiness (Slocombe et al., 2016). Moreover, analysis of EEG signals revealed that tactile perception elicits activity in brain regions associated with both gustatory and visual processing, possibly providing insights into the mechanisms underlying cross-sensory integration. This finding aligns with existing literature indicating that cross-modal stimuli are represented in the primary gustatory cortex according to their sensory identity, associability, and predictive value (Roberto, 2016).
Our findings offer practical guidance for designers and manufacturers in the dining industry. Selecting materials with specific tactile properties
enables the creation of targeted sensory and emotional experiences. For instance, rougher and softer materials evoke warmth and relaxation, which are ideal for family-oriented dining settings. Conversely, smoother and harder materials convey cleanliness and formality, making them better suit upscale dining aesthetics. With sensible cross-sensory perception, designers can create more harmonious dining environment.
A strength of this study is the combination of subjective evaluations with objective physiological data, highlighting the critical role of tactile properties in dining spaces and providing relatively comprehensive understanding of how tactile properties influence cross-sensory perception. However, the study has certain limitations, including a limited range of tactile properties examined and a sample that may not represent the broader population. Future research should develop more refined manipulations of independent variables and explore a wider array of tactile characteristics to extend existing findings. Including more diverse participant samples would also help further investigate optimal approaches to enhancing user experiences.
CONCLUSION
This study demonstrates that surface roughness and hardness profoundly affect cross-sensory perception of vision and taste in dining contexts. Rough, hard materials evoked richer, more formal impressions, while smooth, soft materials fostered lighter, more casual experiences. By integrating subjective evaluation with EEG, we validated the substantial role of tactile cues in shaping both emotional responses and sensory expectations.
These findings offer actionable strategies for designers, emphasizing the alignment of tactile properties with specific dining scenarios—from formal, upscale events to relaxed family gatherings. While additional research is needed to explore broader demographic groups and more varied tactile features, our results affirm that thoughtful material selection can significantly enhance the multisensory quality of dining environments.
ACKNOWLEDGMENT
This work was supported by the National Science Foundation Support Project (Grant No. 52305245) and the Educational Reform Project of Beihang University (Curriculum Reform and Practice of Human Factors Engineering Based on Frontier Interdisciplinary Research).
REFERENCES
B. G. Slocombe, D. A. Carmichael, J. Simner, Cross-modal tactile–taste interactions in food evaluations, Neuropsychologia, Volume 88, 2016, Pages 58–64. Bradley MM, Lang PJ. Measuring emotion: The Self-Assessment Manikin and the
Semantic Differential. J Behav Ther Exp Psychiatry. 1994 Mar; 25(1): 49–59. Buzsáki, Anastassiou, & Koch (2012). The origin of extracellular fields and currents EEG, ECoG, LFP and spikes. Nature Reviews Neuroscience, 13(6), 407–20. Charles Spence, Multisensory flavor perception. Cell, 161(1), 24–35, 2015.
Exploring Cross-Sensory Perception in Dining Environments 75
Chyong-Ru Liu et al. Memorable dining experiences with five senses: Conceptualization and scale development, Journal of Hospitality and Tourism Management, 2022. Ding S, Pan Y, Tong M, Zhao X. Tactile Perception of Roughness and Hardness to Discriminate Materials by Friction-Induced Vibration. Sensors. 2017; 17(12):2748. Gueorguiev, D., Bochereau, S., Mouraux, A. et al. (2016). Touch uses frictional cues
to discriminate flat materials. Sci Rep 6, 25553. Havward V et al. Haptic Interfaces and Devices[J]. Sensor Review, 2004, 24(1): 16–29. Huang S, Li Y et al. (2015). Multisensory Competition Is Modulated by Sensory
Pathway Interactions with Fronto-Sensorimotor and Default-Mode Network Regions. Journal of Neuroscience, 35(24), 9064–9077. Jon Driver, Toemme Noesselt. Multisensory Interplay Reveals Cross-modal Influences on ‘Sensory-Specific’ Brain Regions, Neural Responses, and Judgments. Neuron, Volume 57, Issue 1, 11–23, 2008. Kosuke Motoki, Charles Spence, Carlos Velasco. When visual cues influence taste/ flavor perception: A systematic review, Food Quality and Preference, Volume 111, 2023. Roberto Vincis, Alfredo Fontanini et al (2016). Associative learning changes cross-
modal representations in the gustatory cortex eLife 5: e16420. Sun Y. Research of EEG processing Algorithms in Brain-Computer Interface System,
2012. Yang C., Yang Q. Application of SPSS item analysis in questionnaire design. Journal of Advanced Correspondence Education (Natural Science Edition), 23(03): 107–10, 2010. Zuo H. The Selection of Materials to Match Human Sensory Adaptation and
Aesthetic Expectation in Industrial Design. Metu Journal of The Faculty of Architecture, 27 (2010): 301–319.
LISTED IN THE AHFE DIGITAL BOOKSTORE CATALOGUE
Explore the complete digital volume
Affective and Pleasurable Design
Read this individual research paper free through the original publisher, or explore the full digital proceedings book.
ISBN 978-1-964867-40-3
Explore this ISBN in the AHFE Bookstore ↗Listed in the July 2026 bookstore catalogue; search by ISBN to confirm current availability · Digital book purchase optional