Yuhe Wei, Yuanyuan Liu (2025). The Effect of Pressure Levels on Comfort in Ankle Wearable Devices: A Human-Centered Ergonomics Approach. In: Human Factors and Wearable Technologies. AHFE Open Access, vol. 175, pp. 61–71. https://doi.org/10.54941/ahfe1006359
This study investigates the relationship between pressure levels and user comfort in ankle wearable devices, with a focus on the interplay between pressure levels and individual physiological characteristics. A two-phase experimental design was employed, including a preliminary study to determine pressure thresholds and a formal experiment to evaluate comfort under various pressure levels (350g–750g). Using modified evaluation tools tailored for lower limb devices, we examined nine dimensions of comfort through subjective rating scales. The results revealed that comfort responses to pressure levels exhibit non-linear trends, with specific pressure ranges optimizing attachment and lightness, while others induce discomfort and restricted mobility. Individual factors such as BMI and lower leg circumference were found to significantly modulate these effects, underscoring the necessity of personalized designs for wearable devices. This study provides methodological advancements in comfort assessment and offers actionable insights for optimizing wearable device design in healthcare and rehabilitation applications.
Ankle braces are widely used in medical rehabilitation and sports to reduce injury risk and promote recovery. However, prolonged use may cause discomfort due to excessive pressure or poor fit, affecting user compliance and device effectiveness (Attig and Franke, 2020). Balancing support performance and wear comfort in ankle brace design is a critical issue in the field of human factors engineering (Ma et al., 2024).
Existing research indicates that moderate pressure can improve device stability and user satisfaction (Xu et al., 2024), but excessive pressure may lead to pain and skin injury, while insufficient pressure may weaken functionality (Park, 2020). Moreover, physiological characteristics such as gender and body mass index (BMI) significantly influence pressure perception, highlighting the importance of personalized pressure adjustment (Dueñas et al., 2021).
While previous studies focus on optimizing pressure distribution or material selection (Ma et al., 2024), less attention has been given to the dynamic interaction between user characteristics and pressure perception (Wang, Jiang and Gao, 2024). Therefore, this study investigates how pressure levels at key load-bearing points of ankle braces affect comfort and how physiological characteristics modulate this relationship, aiming to answer two main questions: (1) How do pressure levels affect comfort? (2) How do user characteristics influence the pressure-comfort relationship?
RELATED WORK
Theoretical Framework and Experimental Design for Wearable Device Comfort Assessment The Comfort Rating Scale (CRS), developed by Knight and Baber, comprehensively assesses comfort across six dimensions: Emotion, Attachment, Harm, Perceived Change, Movement, and Anxiety. This framework provides a theoretical foundation for multidimensional comfort perception (Knight et al., 2005). In addition, Borg introduced the Borg CR-10 Scale and the Borg Rating of Perceived Exertion (RPE) Scale, which are used to self-report exertion levels and quantify the impact of device wear on the body (Williams, 2017).
The application of these methods has expanded from large devices like helmets to wearable devices such as AR glasses and smartwatches (Smith et al., 2021). Furthermore, methods based on material properties of devices have also advanced (Tadesse et al., 2019).
Simulating real-life tasks (e.g., walking, running) has become crucial in studying the pressure-comfort relationship (McNamara et al., 2016). Pressure discomfort threshold (PDT) testing, which gradually increases pressure until discomfort is reported, is widely used to measure pressure sensitivity (Du et al., 2024).
Research Gap and Contribution While existing studies mostly focus on upper-body devices, research on lower- limb devices, such as ankle braces, is limited. This study builds on pressure threshold testing and task simulations, incorporating user physiological characteristics to provide a more comprehensive understanding of comfort, thus offering a new perspective for personalized ankle brace design.
METHOD
This study consists of two phases: the preliminary phase determines the pressure range and comfort threshold, while the formal phase evaluates the impact of different pressure levels on comfort. The experiment involves pressure adjustment, task simulation, and comfort evaluation, considering individual physiological characteristics.
The Effect of Pressure Levels on Comfort in Ankle Wearable Devices 63
Participants Participants were recruited from a local university. The preliminary study involved 6 participants (3 males, 3 females), while the formal study included 20 participants (11 males, 9 females). Participants in the formal study were categorized into three BMI groups: underweight, normal weight, and overweight (see Table 1), to ensure a diverse range of body types.
Table 1: Participant demographics for the formal experiment.
Table available in the original PDF paper.
Gender Sample Size BMI
kg/m2 Category Sample Size Male 11 Underweight 4 Normal weight 4 Overweight 3 Female 9 Underweight 2 Normal weight 4 Overweight 3
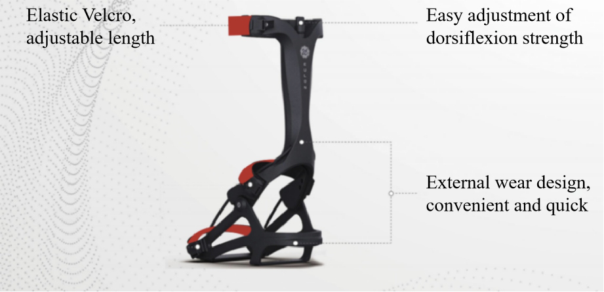
Experimental Equipment The ankle wearable brace used in this experiment (see Figure 1) was provided by a professional manufacturer and designed to balance support performance with wearability comfort. Simulation analysis revealed that the primary pressure points of the brace are located around the calf, which is the key area for comfort evaluation in this study.
Figure 1: Schematic diagram of the ankle wearable brace.
Experimental Design The experiment consists of two phases: the preliminary study to determine the pressure range and threshold for comfort perception, and the formal study to further quantify the impact of different pressure levels on comfort.
In the preliminary study, we established five pressure perception levels— just noticeable, mild, moderate, intense, and unbearable—by gradually
64 Wei and Liu
increasing the pressure at the main load-bearing point of the ankle brace. Participants provided feedback on their perceived comfort, and pressure sensors recorded the values to determine the pressure range for the formal study.
The formal study was based on this pressure range and involved three stages: pressure adjustment, task execution, and comfort evaluation, all conducted in a controlled temperature and humidity environment.
Pressure Adjustment and Recording Pressure was adjusted by altering the straps of the ankle brace, with sensors ensuring that each stage fell within the predefined range. Each stage lasted 5 minutes, with pressure gradually increased while comfort feedback was recorded.
Task Design To simulate real-life activities, two types of tasks were designed:
1. Static Task: Participants performed actions such as transitioning from sitting to standing, turning, and bending over. 2. Movement Task: Participants walked freely within a designated space.
Each task lasted 5 minutes, with a 3-minute rest period between tasks. During the rest period, participants filled out the comfort evaluation scales to record their subjective perceptions.
Comfort Evaluation To comprehensively assess the comfort of participants under different pressure conditions, two evaluation scales were used in this experiment:
1. Comfort Rating Scale (CRS): This scale was modified based on discussions with a focus group composed of users experienced with ankle braces. The group discussed and refined the scale’s dimensions and specific questions to ensure it accurately captured the participants’ perceptions of comfort. The final version includes 8 questions, and a 7-point Likert scale (1 = strongly disagree, 7 = strongly agree) was used to quantify overall comfort perception. 2. Borg Rating of Perceived Exertion (RPE) Scale: Used as the 9th question to assess exertion levels while wearing the brace, with a scale ranging from 6 (no exertion at all) to 20 (maximal exertion), including descriptive labels for each point (e.g., “9 – Very light effort”, “9 – 13 – Somewhat hard” etc.).
The questions on the scales (see Table 2) were randomly arranged during the experiment.
The Effect of Pressure Levels on Comfort in Ankle Wearable Devices 65
Table 2: Content of the scales used in the experiment.
Table available in the original PDF paper.
Dimension Endpoints Description Emotion Strongly Disagree / Strongly Agree Q1 (Emotion): Wearing the brace makes you feel embarrassed. Attachment Strongly Disagree /
Strongly Agree
Q2 (Attachment): The brace fits your body shape (i.e., it doesn’t slide or move). Harm Strongly Disagree / Strongly Agree
Q3 (Pain): The brace causes injury or pain. Q4 (Skin Discomfort): The brace causes discomfort to your skin. Perceived change
Strongly Disagree / Strongly Agree
Q5 (Unnatural Feeling): Wearing the brace makes you feel more unnatural during activities. Movement Strongly Disagree / Strongly Agree
Q6 (Freedom of Movement): The brace allows you to walk and move freely. Q7 (Lightness): Wearing the brace feels light when walking. Anxiety Strongly Disagree / Strongly Agree
Q8 (Anxiety): You feel anxious about your safety while wearing the brace. Perceived Exertion
No exertion at all / Maximal exertion
Q9 (Perceived Exertion): How hard is it to wear the brace, from 6 to 20?
Data Collection and Analysis The data analysis included quantitative analysis. Descriptive statistics were used to calculate the mean and standard deviation for the scale scores at each pressure level. ANOVA was then applied to test differences in comfort perception across different pressure levels, considering factors such as body size, gender, and calf circumference, which could affect comfort.
PRELIMINARY STUDY RESULTS The preliminary study quantified participants’ perceptual feedback to determine an appropriate pressure range for the formal experiment (see Table 3). Some participants did not report discomfort at the “intense” or “unbearable” levels (marked as N/A) because the strap pressure reached the maximum value without eliciting the corresponding perceptual response.
Table 3: Preliminary study results: perceptual feedback at different pressure levels.
Table available in the original PDF paper.
ID Gender Pressure Level g Just Noticeable Mild Moderate Intense Unbearable
1 Male 373.32 473.24 534.71 672.64 N/A 2 Male 365.32 480.24 569.71 853.03 N/A 3 Male 387.24 490.17 621.64 858.42 N/A 4 Female 351.12 451.24 672.10 N/A N/A 5 Female 321.39 476.85 606.78 707.17 N/A 6 Female 336.39 415.85 567.24 676.64 N/A Mean 355.80 464.60 595.36 753.58 Based on feedback from the “just noticeable” to “intense” levels, the pressure range was set between 350g and 750g (3.43 N to 7.35 N). A pressure
66 Wei and Liu
increment of 100g (0.98 N) was chosen, dividing the experiment into five pressure groups (350g, 450g, 550g, 650g, 750g). This increment ensured that pressure variations stayed within the perceptible range while avoiding excessive duration or discomfort during the experiment.
GENERAL RESULTS OF THE FORMAL STUDY To examine participants’ subjective experience with the ankle wearable brace at different pressure levels, the scores from the CRS and Borg RPE scales were analyzed (see Table 4).
Table 4: CRS and Borg RPE scale scores.
Table available in the original PDF paper.
Equations and mathematical formulas are available in the original paper PDF.
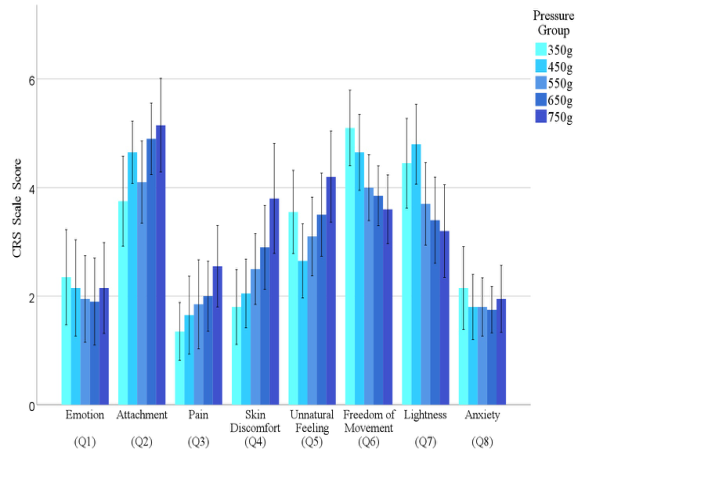
For the CRS scale, there was minimal variation in emotional responses (Q1) across all pressure groups, remaining at low levels (1.90–2.35). As pressure levels increased, attachment (Q2) peaked at 450g (Mean = 4.65, SD = 1.22) and reached its highest value at 750g (Mean = 5.15, SD = 1.84). Pain perception (Q3) and skin discomfort (Q4) significantly increased, especially at 750g, with Q4 reaching its highest value (Mean = 3.80, SD = 2.16). At 450g, unnatural feeling during movement (Q5) was at its lowest (Mean = 2.65, SD = 1.46), even lower than the 350g group (Mean = 3.55, SD = 1.63). However, as the pressure increased, the 750g group (Mean = 4.20, SD = 1.79) showed a significant increase in unnatural feeling compared to the 450g group (p < 0.05). For freedom of movement (Q6) and lightness (Q7), lower pressure groups (350g and 450g) had higher scores, but with increasing pressure, both metrics gradually decreased, with the 750g group showing the lowest scores (Q6 Mean = 3.60, Q7 Mean = 3.20). Anxiety (Q8) scores were consistently low across all pressure groups, with minimal fluctuation (1.75–2.15).
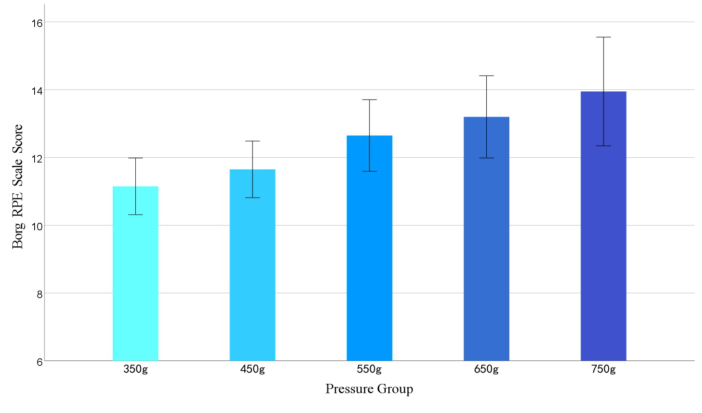
For the Borg RPE scale, perceived exertion (Q9) increased with pressure levels (Mean rising from 11.15 to 13.95). At 750g, the scores were significantly higher than those of the lower pressure groups (350g: p < 0.01; 450g: p < 0.05). To visually depict the trend of scores across pressure groups, clustered bar charts of the CRS and Borg RPE scale scores were plotted (see Figures 2 and 3).
The Effect of Pressure Levels on Comfort in Ankle Wearable Devices 67
Figure 2: Trend of CRS scale scores across pressure groups.Figure 3: Trend of Borg RPE scale scores across pressure groups.
Among the results, emotional response (Q1) and anxiety (Q8) showed little fluctuation, with no significant difference between pressure groups (p > 0.05). Pain (Q3) showed an increasing trend (r = 0.25, p < 0.05), though inter-group differences were not significant (p > 0.05). Skin discomfort (Q4) and freedom of movement (Q6) exhibited opposite trends (r = −0.25, p < 0.05). As pressure increased, skin discomfort increased (r = 0.39, p < 0.001), while freedom of movement decreased (r = −0.37, p < 0.001).
68 Wei and Liu
The scores for freedom of movement (Q6) and lightness (Q7) followed the same trend (r = 0.57, p < 0.001), both showing higher scores in the lower pressure groups and gradually decreasing with increasing pressure (Q7, r = −0.31, p < 0.05). Perceived exertion (Q9) showed a marked increasing trend (r = 0.39, p < 0.001).
RESULTS RELATED TO USER CHARACTERISTICS Gender
The analysis of gender differences in comfort perception across all pressure groups and scale items showed no significant differences (p > 0.05), indicating that, in this sample, gender did not have a significant effect on comfort perception.
BMI In the low-pressure group (350g), participants with low BMI (BMI < 18.5) exhibited significantly higher anxiety (Q1) scores (p < 0.01) compared to normal-weight (BMI 18.5 ≤BMI < 24.9) and overweight participants (BMI ≥25). Skin discomfort (Q4) and unnatural feeling (Q5) were also significantly higher in the low BMI group (p < 0.05). In the 450g pressure group, BMI did not show a significant impact on comfort perception (p > 0.05).
In the medium-pressure group (550g), the low BMI group had significantly lower attachment (Q2) scores compared to normal and overweight participants (p < 0.001). In terms of pain perception (Q3), normal-weight participants reported more pain (p < 0.05), while in lightness (Q7), low BMI participants had significantly lower scores (p < 0.01).
In the high-pressure groups (650g and 750g), overweight participants reported significantly higher pain perception (Q3) scores compared to low and normal BMI participants (p < 0.05). Conversely, in terms of lightness (Q7), low BMI participants reported significantly lower scores (p < 0.05).
Calf Circumference In the lower pressure groups (350g, 450g), no significant differences were observed in comfort perception due to calf circumference (p > 0.05).
In the medium-pressure group (550g), participants with smaller calf circumferences (less than 37 cm) had significantly lower attachment scores (Q2) compared to those with medium (37 cm ≤calf circumference < 41 cm) and larger calf circumferences (p < 0.05).
In the high-pressure groups (650g and 750g), at 650g, participants with medium calf circumferences had significantly higher attachment (Q2) scores compared to both smaller and larger calf circumference groups (p < 0.05). At 750g, no significant differences in attachment scores were observed between calf circumference groups (p > 0.05). In terms of lightness (Q7), medium calf circumference participants consistently reported significantly higher scores than both smaller and larger calf circumference groups (p < 0.05). In the maximum pressure group (750g), participants with medium calf
The Effect of Pressure Levels on Comfort in Ankle Wearable Devices 69
circumferences had significantly higher freedom of movement (Q6) scores than both smaller and larger calf circumference groups (p < 0.05).
DISCUSSION
This study focused on the comfort performance of ankle wearable braces at different pressure levels, exploring the complex relationship between pressure and wearer perception, and examining how individual physiological characteristics modulate this process. The results reveal that comfort is influenced not only by pressure levels but also by the nonlinear characteristics of pressure changes and individual differences among users.
Specifically, in the low-pressure group, freedom of movement (Q6) and lightness (Q7) were relatively higher. However, attachment (Q2) and lightness (Q7) reached a local peak in the 450g pressure group and then decreased as pressure increased, with subsequent higher pressure groups either recovering or continuing to decline. Similarly, unnatural feeling during movement (Q5) reached its lowest value at 450g and significantly increased with higher pressures. These nonlinear changes suggest that the relationship between pressure levels and comfort is a dynamic trade-off, rather than a straightforward linear correlation. While low pressure groups provided a better wearing experience, higher pressures also showed potential for improving attachment; however, these benefits were offset by pain and discomfort.
Compared to existing studies, this research extends the understanding of wearable device comfort and provides a new perspective for the personalized design of ankle braces. Previous studies have predominantly focused on upper-body devices (such as VR glasses and smartwatches), mainly evaluating comfort under static tasks, with relatively limited evaluation dimensions. This study captures dynamic changes in a task scenario, modifying the comfort evaluation framework to better suit the needs of foot and leg wearable devices, thereby enhancing sensitivity to pressure level changes. Across the 350g to 750g pressure range, multiple perceptual dimensions demonstrated significant dynamic changes. This improvement effectively captured the complexity of perceptual effects, offering methodological support for future comfort research and highlighting the necessity of optimizing evaluation tools for different device types.
Furthermore, this study considered the moderating role of individual physiological characteristics, analyzing the influence of BMI and body dimensions at the wearing site on pressure perception. The results indicate that significant differences between pressure groups and evaluation dimensions are highly contextual. The moderating effects of BMI and calf circumference on comfort were not significant in all conditions but were concentrated in specific pressure ranges and perceptual dimensions. These findings suggest that physiological characteristics may either amplify or mitigate perceptual effects under certain pressure conditions, indicating that future brace designs should incorporate dynamic optimization based on individual user characteristics.
70 Wei and Liu
The results of this study offer valuable insights for broader wearable device research. Pressure levels and individual characteristics may also be key factors influencing comfort in other devices, such as knee braces and back supports. Future studies could further validate the universality of these findings, providing theoretical and practical guidance for developing more user-centered devices.
CONCLUSION
This study explored the impact of different pressure conditions on the multi- dimensional perceptions of wearers using ankle wearable braces and analyzed the interaction between pressure levels and user physiological characteristics. The results indicate that pressure level is a core factor influencing comfort, with effects showing multi-dimensional nonlinear characteristics, and that BMI and body dimensions at the wearing site significantly modulate this relationship.
The study emphasizes the necessity of personalized design. Low-weight users are more likely to experience discomfort under low pressure conditions, while high-weight users report significantly increased pain at higher pressures. The impact of body dimensions on attachment and freedom of movement is particularly significant in medium and higher pressure ranges. Design should account for the dynamic interaction between pressure levels and user characteristics to optimize both comfort and fit.
This study also modified the comfort evaluation tool, providing more detailed measurement methods for ankle braces and enhancing sensitivity to pressure changes. Future research could explore how to adjust pressure levels based on individual characteristics and verify the universality of these findings, offering practical guidance for the optimization of medical rehabilitation and sports assistance devices.
ACKNOWLEDGMENT
The authors would like to acknowledge Zhenyue Wu and Hao Cui for their assistance in the investigation of experimental planning materials, which provided valuable insights for this study.
This work was supported by the National Science Foundation Support Project (Grant No. 52305245), the Ministry of Education Industry- University Cooperation Collaborative Education Project (Grant No. CES/Kingfar 202309RYJG32), and the Educational Reform Project of Beihang University (Curriculum Reform and Practice of Human Factors Engineering Based on Frontier Interdisciplinary Research).
REFERENCES
Attig, C. and Franke, T. (2020) ‘Abandonment of personal quantification: A review and empirical study investigating reasons for wearable activity tracking attrition’, Computers in Human Behavior, 102, pp. 223–237. Available at: https://doi.org/ 10.1016/j.chb.2019.08.025.
The Effect of Pressure Levels on Comfort in Ankle Wearable Devices 71
Du, Y. et al. (2024) ‘Effect of prolonged wear and frame tightness of AR glasses on comfort’, Heliyon, 10(16). Available at: https://doi.org/10.1016/ j.heliyon.2024.e35899. Dueñas, L. et al. (2021) ‘Influence of age, gender and obesity on pressure discomfort
threshold of the foot: A cross-sectional study.’ Clinical Biomechanics, 82. Available at: https://doi.org/10.1016/j.clinbiomech.2020.105252. Knight, J. F. and Baber, C. (2005). ‘A Tool to Assess the Comfort of Wearable Computers. Human Factors’, 47(1), 77–91. Available at: https://doi.org/10.1518/ 0018720053653875. Ma, Z. et al. (2024) ‘Comfort of Wrist-Worn Devices: Development of an Assessment Tool and Measurement of Comfort-Discomfort Pressure for Older and Younger Users’, International Journal of Human-Computer Interaction, pp. 1–15. Available at: https://doi.org/10.1080/10447318.2024.2411279. McNamara, R. J. et al. (2016) ‘Measurement of daily physical activity using
the SenseWear Armband’, Chronic Respiratory Disease, 13(2), pp. 144–154. Available at: https://doi.org/10.1177/1479972316631138. Park, E. (2020) ‘User acceptance of smart wearable devices: An expectationconfirmation model approach’, Telematics and Informatics, 47. Available at: https://doi.org/10.1016/j.tele.2019.101318. Smith, E. et al. (2021) ‘A comfort analysis of using smart glasses during “picking”and
“putting” tasks’, International Journal of Industrial Ergonomics, 83. Available at: https://doi.org/10.1016/j.ergon.2021.103133. Tadesse, M. G. et al. (2019) ‘Assessing the comfort of functional fabrics for smart clothing using subjective evaluation’, Journal of Industrial Textiles, 48(8), pp. 1310–1326. Available at: https://doi.org/10.1177/1528083718764906. Wang, X., Jiang, Z. and Gao, Q. (2024) ‘Review and appraisal of approaches to
assess comfort of wearable devices’, in Affective and Pleasurable Design. AHFE International. Available at: https://doi.org/10.54941/ahfe1004684. Williams, N. (2017) ‘The Borg Rating of Perceived Exertion (RPE) scale’, Occupational Medicine. Oxford University Press, pp. 404–405. Available at: https://doi.org/10.1093/occmed/kqx063. Xu, L. et al. (2024) ‘A Qualitative Exploration of a User-Centered Model for Smartwatch Comfort Using Grounded Theory’, International Journal of Human- Computer Interaction, 41(2), pp. 1091–1106. Available at: https://doi.org/ 10.1080/10447318.2024.2313273.
LISTED IN THE AHFE DIGITAL BOOKSTORE CATALOGUE
Explore the complete digital volume
Human Factors and Wearable Technologies
Read this individual research paper free through the original publisher, or explore the full digital proceedings book.
ISBN 978-1-964867-51-9
Explore this ISBN in the AHFE Bookstore ↗Listed in the July 2026 bookstore catalogue; search by ISBN to confirm current availability · Digital book purchase optional