Haocheng Han, Yuanyuan Liu, Lu Haibo, Han Meng (2024). Optimizing Chip Assembly in Laboratories: The Influence of Indicator Color and Lighting on User Experience. In: Usability and User Experience. AHFE Open Access, vol. 156, pp. 392–401. https://doi.org/10.54941/ahfe1005450
Achieving high precision and efficiency is pivotal in a laboratory environment to ensure the seamless progression of experiments. This study delves into the realm of laboratory user experience, focusing on chip assembly in typical lab setting. Our objective is to unravel the effects of varying assembly point indicator colors and lighting conditions on user productivity and comfort. A total of 28 participants were recruited and divided into two groups. One group worked with assembly points that had green edges, while the other worked without this color cue. We explored eight distinct hues (black, white, red, yellow, blue, green, purple, cyan) as variables. After receiving training in chip assembly, participants were tasked with completing eight chip assembly tasks independently and rating their comfort level following each task. An eye tracker measured the time taken to complete each assembly. The data revealed that, except for black (target point without color, average completion time of 3.56s), the completion times for the other seven hues ranged between 2.6s to 2.8s. This implies that while indicator colors under 2000lux lighting boost identification efficiency, the specific hue of these indicators has no significant effect on assembly efficiency. In terms of user comfort ratings, the presence of green color at the assembly point’s edge made the green the most comfortable color, with white ranking third. In the absence of green edges, green fell to sixth in comfort, yet white consistently remained in third place. Other colors did not show significant pattern in comfort scores. This indicates that user comfort is more closely related to the inherent color of the product and the assembly point indicators. The impact of color around the assembly point on user comfort is minimized when white is used as the indicator color.This study provides valuable insights into the influence of lighting and indicator colors on efficiency and comfort in a laboratory setting, contributing to the design of future laboratory products for enhanced user experience and efficiency
Optimizing Chip Assembly in Laboratories: The Influence of Indicator Color 393
it apart from that of consumer goods. Laboratory products prioritize reli- ability and accuracy to ensure stable and efficient output of experimental data (Rastogi et al., 2022). The product’s core technology establishes the limits of reliability and precision for experimental products. Variations in users’ capabilities can lead to errors during experiment, impacting the sta- bility and efficiency of the results (Hao et al., 2023). Similarly, upgrades in the accuracy of core algorithm technologies in the laboratory array magne- torheological instrument have been shown to boost experimental efficiency (Wang et al., 2023). Furthermore, laboratory manufacturing equipment that extracts the data from the industrial environment to optimizes the experi- mental equipment in real-time, ensuring reliability and experimental stability (Stavropoulos et al., 2021). Similarly, the generalization and serialization of laboratory product parts contribute to equipment reliability and exper- iment stability through replaceability (Mai, 2013). While advancements in core technology can enhance the reliability and accuracy of laboratory prod- ucts, they often require extensive time and incur high cost. However, from a user’s perspective, minimizing user errors through thoughtful product can be a more time-efficient and cost-effective approach. For instance, through user experiments, Deng, Tian and Kuai designed an interaction mode that improved recognition rates and greatly enhanced the accuracy of equipment usage (Deng, Tian, and Kuai, 2022). Liu, Cao and Proctor’s research on visual design, in terms of visual search efficiency, led to design recommen- dations for application icons, aiding user cognition and reducing operational errors (Liu, Cao, and Proctor, 2021). These improvements were achieved with lower cost and shorter development cycles, effectively reducing user error rates. Currently, user-oriented research mainly focuses on graphic and display, with a notable lack of comprehensive case studies on specific experimental equipment.
From the users’ perspective, this study examines a specific laboratory prod- uct (Photoelectric tweezers) as a case study. We focus on the stability and efficiency of chip assembly, considering the light intensity and the hue of the assembly point indicator color as variables. This research explores the impact of this variables on chip assembly efficiency. Based on preliminary inter- views and research, we formulated the following hypotheses and designed experiments for investigation:
1. In chips assembly task, the operation efficiency at assembly point with indicator color is higher than at points without.
2. In chips assembly task, the color of the assembly point indicator influences operational efficiency.
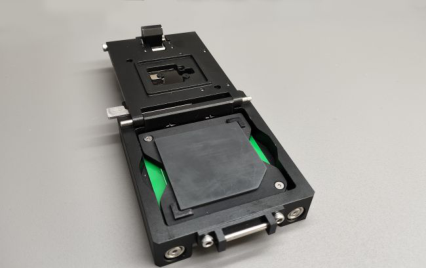
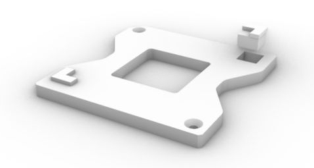
EXPERIMENTAL DESIGN Photoelectric tweezers represent a typical laboratory product. Through user research and analysis of user journey map, we identified a key issue: the assembly efficiency is reduced due to the absence of indicator colors at the assembly points during chip loading with photoelectric tweezers (see Figure 1) Consequently, this experiment focuses on this specific challenge faced by users when assembling chips in the laboratory. Previous research indicates that users recognize different hues of icons at varying speeds (Liu,
Cao and Proctor, 2021), suggesting that the color of indication points may influence chip assembly efficiency. Therefore, we selected the hue of the indi- cator point as our primary stimulus sample for examining chip assembly using photoelectric tweezers.
28 participants were recruited to participate in the experiment, compris- ing an equal number of males and females, all approximately 23 years old with experience in scientific research. Each participant was physically and mentally healthy, and possessed normal or corrected-to-normal vision. All participants were fully informed on the experimental contents and precautions.
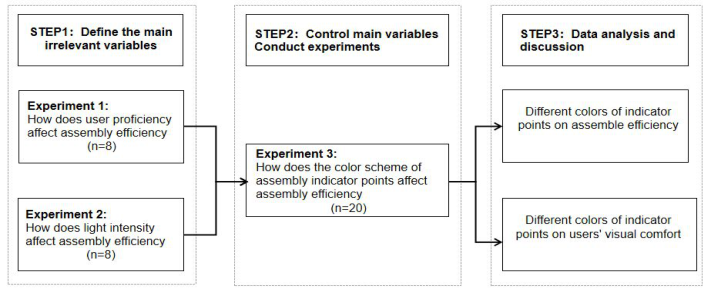
Before commencing the main experiment, it was necessary to control other relevant variables. Interviews with researchers skilled in operating optical tweezers, helped us identify two critical variables: light intensity and user proficiency. Light intensity is known to significantly affect object recogni- tion efficiency (Hvass et al., 2021), and user proficiency markedly influences product operation efficiency (Aydın et al., 2022). Hence, these two variables were chosen for control in this experiment. Experiment 1 and 2 were designed to ascertain the impact of these variables on the study. Experiment 3, the primary experiment, aimed to investigate the effect of indicator points of different colors on assembly efficiency (see Figure 2).
Figure 1: Chip clip to be assembled.Figure 2: Experimental logic diagram.
Optimizing Chip Assembly in Laboratories: The Influence of Indicator Color 395
PRE-EXPERIMENT AND MAIN EXPERIMENT Experiment 1
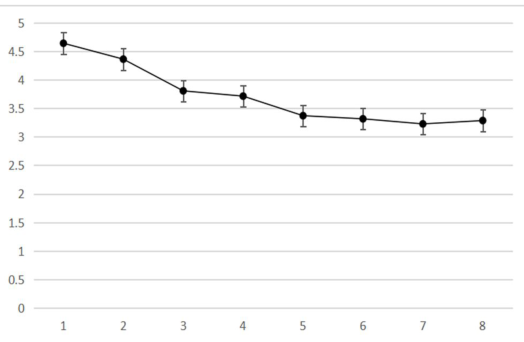
In this preliminary experiment, we invited eight researchers to evaluate the influence of user proficiency on chip assembly efficiency. The setup involved keeping the assembly point indicator color black (lacking indicator color) and setting the light intensity at 2000lux (Standard light source illumination intensity). Participants were asked to perform chip assembly operations eight times, and the duration of each chip assembly was recorded by an eye tracker. As shown in Table1 and Figure3, the average time taken for chip assem- bly reduced significantly over the first trials, indicating a substantial increase in proficiency. After 5–6 repetitions, the average assembly time stabilized between 3 to 3.5 seconds. This pattern demonstrates that user proficiency has a great impact on chip assembly efficiency. Based on these findings, we determined that for the main experiment, participants should have a min- imum experience of 5–6 assembly repetitions to mitigate the influence of varying proficiency levels on the experimental outcomes.
Table 1. Impact of proficiency on assembly time (Seconds).
Figure 3: Correlation between user proficiency and assembly completion time.
Experiment 2 We recruited eight scientific researchers to conduct a preliminary experi- ment examining the effect of light intensity on chip assembly efficiency. The assembly point indicator color was maintained as black (without a dis- tinct color) for this experiment. To minimize the impact of varying levels of operational proficiency on the results, each participant was first required to independently perform the chip assembly task five times prior to the formal experiment.
Subsequently, each researcher carried out chip assembly tasks under two different lighting conditions: in standard light source illumination the 2000lux lighting and in an environment with light intensity less than 2000lux. The duration of each assembly task was recorded. The experiment required participants to perform chip assembly under both lighting condi- tions. The results as shown in Table 2, indicate the average assembly time under the first condition (2000lux) was 3.37seconds, while under the second condition (less than 2000lux), it was 3.80 seconds. These findings suggest that the light intensity has a certain impact on the chip assembly efficiency. Within a certain range, higher the light intensity correlates with increased efficiency in chip assembly. For the main experiment, it is crucial to maintain consistent light intensity across all test to eliminate the variable light intensity affecting the results.
Table 2. Impact of light intensity on assembly completion time (Seconds).
Experiment 3 For the main experiment, we recruited 20 researchers to examine the effect of indicator point colors on chip assembly efficiency. Based on previous experimental results, we maintained the light intensity at a standard light source illumination (2000lux). Prior to the formal tasks, each participant was required to independently complete five chip assembly operations to stan- dardize their operational proficiency. In the formal phase of experiment, we kept the color saturation and brightness of the indicator point constant while varying their hues. The chosen hues were white, red, yellow, green, cyan, blue and purple. Participants performed eight chip assembly tasks, correspond- ing to each of these colors black (indicating no color at the assembly point).
Optimizing Chip Assembly in Laboratories: The Influence of Indicator Color 397
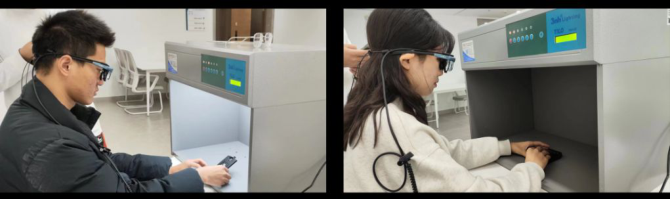
They wore eye trackers while conducting assembly tasks near a 2000lux light source box (see Figure 4).
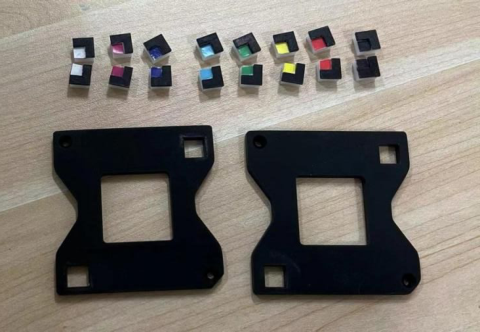
After each assembly task, experimenters changed the color of the indicator point at the chip assembly station (see Figure 5 and Figure 6). After each task, participant was asked to rate the comfort level on a scale from 1 to 5, with 1 being the least comfortable and 5 being the most comfortable. This process was designed to gather subjective user data regarding the comfort levels experienced during the experiment.
Figure 4: Participants conducting tests with head-mounted eye trackers.Figure 5: Indicator points for chip assembly.Figure 6: Color blocks representing chip assembly indicator point replacements in the experiment.
RESULT AND ANALISIS The data were analyzed using SPSS software. Prior to analysis, we normalized the data to mitigate the impact of individual variations on the overall data trend.
Influence of Different Colors of Indicator Points on User Recognition Efficiency We collected a total of 20 valid data sets for the assembly. The experimen- tal data, shown in Table 3, indicate that the assembly time for the black indicator point exceeded 3.5 seconds, while for the other colors, the times ranged between 2.6 and 2.8 seconds. A correlation analysis using SPSS (Table 4) revealed no significant correlation between different hues and assembly time. However, it was observed that recognition of black indicator points (no indicator point color) was significantly lower than that of other hues.
Table 3. Assembly time for different colors.
Table available in the original PDF paper.
Indicator point hue Average time for assemble (Seconds) Black 3.56 White 2.60 Red 2.62 Yellow 2.65 Green 2.68 Cyan 2.68 Blue 2.74 Purple 2.80
Table 4. Correlation analysis of indicator point color and assembly efficiency.
Table available in the original PDF paper.
Indicator point hue Average time (s) Correlation coefficient −0.620 p 0.101
* p<0.05 ** p<0.01
Influence of Different Colors of Indicator Points on Users’ Visual Comfort Analyzing the subjective evaluation data from 20 users, we determined the average comfort score for different hues, presented in Table 5 (scores arranged from high to low). The green color scored highest on average for comfort. Upon further observation and interviews, it was noted that the pres- ence of green circuit boards on the chip assembly edges influenced this result. Participants perceived a harmonious match between the green of the indicator point and the green on the assembly edge, leading to higher comfort scores. To investigate this further, we conducted a new user experiment with eight
Optimizing Chip Assembly in Laboratories: The Influence of Indicator Color 399
participants, using a black overlay on the green circuit boards. The results and analysis of this follow-up experiment as shown in Table 6.
In scenarios with green at the edge of the assembly point, green ranked highest in comfort, followed by white in third place. Conversely, without green at the edge, green fell to sixth in comfort, while white consistently remained third. For the other colors, no significant pattern in comfort scores was observed. This suggests that user comfort is influenced by the color of the assembly point in relation to the product’s inherent. However, when white is used as the indicator color, user comfort seems less affected by the presence of surrounding colors.
Table 5. Comfort scores for different hues with green edges of the assembly point.
Table available in the original PDF paper.
Indicator point hue Comfort score Green 4.1 Black 3.8 White 3.6 Cyan 3.6 Blue 3.5 Red 3.3 Yellow 3.3 Purple 2.6
Table 6. Comfort scores for different hues in the absence of green at the assembly point edge.
Table available in the original PDF paper.
Indicator point hue Comfort score Cyan 4.4 Yellow 4.2 White 4.2 Red 4.2 Blue 3.8 Green 3.2 Black 3.2 Purple 3.0
DISCUSSION
This study, focusing on chip assembly in laboratory environments, aims to enhance laboratory product design from a user-centric perspective, thereby ensuring the experimental efficiency and stability. It investigates whether the hue of indicator points impacts chip assembly efficiency. The results indicate that while the presence of a colored indicator point improves assembly effi- ciency compared to having no color, the specific color of the indicator point does not significantly affect efficiency. Additionally, user comfort rating for different indicator point colors revealed notable fluctuations, particularly for
the green hue, depending on whether the assembly point’s edge was green. In contrast, the comfort rating for white showed the least fluctuation. Follow-up interviews suggest that the user comfort regarding indicator color point may be influenced by both the color of the assembly point and the overall product color. Therefore, based on our findings, we recommend prioritizing white as the indicator point color in similar laboratory chip assembly scenarios.
Our conclusions align with Mirela Riquena de Giuli’s (2022) study on user perceptions of household kitchen products, which also underscored the importance of color in use satisfaction and comfort. The main findings of our study resonate with the research by the s. fatemeh Hosseini (2022) on EEG responses to color, where black was found to elicit stronger stimuli than the other six colors (red, white, blue, violet, yellow, green, orange). This may explain the differing impacts of black and other colors on assembly efficiency. Hosseini also highlighted the emotional influence of colors, suggesting that overlooking the role of color in emotional response might diminish user effi- ciency. In our study’s highly concentrated laboratory setting, color harmony indeed affected psychological comfort and satisfaction, though the impact on operational efficiency was minimal.
Compared to improving experimental efficiency and stability by advanc- ing the internal core technology of laboratory products, our user-centered approach offers a low-cost and swift alternation. This study bridges user experience with laboratory equipment. In the future, it is possible that more experimental products will adopt the methods proposed in this paper to ensure the accuracy and stability of the experiment from a user experience perspective.
CONCLUSION
This study examines the role of color as an indicator in the context of a laboratory product, using the assembly process of photoelectric tweezers — a primary man-machine operation chip — as a case study. The exper- iment measured the time taken for users to complete chip assembly using an eye tracker, and gathered user comfort scores for different indicator col- ors through subjective evaluation. The data analysis allows us to confirm our initial hypotheses: i) in chip assembly tasks, the operation efficiency at assembly point with indicator color is higher than at those without; ii) the color of assembly point indicators does not significantly influence oper- ational efficiency. In addition, our investigation into the user comfort scores across different color indicators revealed that when the chip clip edge is green, users rated their comfort for the green indicator highest. In contrast, when the chip clip edge was not green, the comfort score for green was notably lower. This indicates that user comfort is influenced by the compatibility between the color of the assembly point and the inherent color of the product.
ACKNOWLEDGMENT
The research was funded by the National Key R&D Program of the Ministry of Science and Technology (Grant No. 2022YFF1502004) and Cutting-edge Interdisciplinary Project (Grant No. KG16250001) of Beihang University.
Optimizing Chip Assembly in Laboratories: The Influence of Indicator Color 401
REFERENCES
Alves, A. L., de Giuli, M. R., Zitkus, E. and Paschoarelli, L. C. (2022). Color Influence on the Use Satisfaction of Kitchen utensils: an Ergonomic and Perceptual Study. International Journal of Industrial Ergonomics, 90, p. N. PAG–N. PAG. doi: https: //doi.org/10.1016/j.ergon.2022.103314. Aydın, A., Ahmed, K., Abe, T., Raison, N., Van Hemelrijck, M., Garmo, H., Ahmed,
H. U., Mukhtar, F., Al-Jabir, A., Brunckhorst, O., Shinohara, N., Zhu, W., Zeng, G., Sfakianos, J. P., Gupta, M., Tewari, A., Gözen, A. S., Rassweiler, J., Skolarikos, A. and Kunit, T. (2022). Effect of Simulation-based Training on Surgical Profi- ciency and Patient Outcomes: a Randomised Controlled Clinical and Educational Trial. European Urology, 81(4), pp. 385–393. doi: https://doi.org/10.1016/j.euru ro.2021.10.030. Deng, C.-L., Tian, C.-Y. and Kuai, S.-G. (2022). A Combination of eye-gaze and head-gaze Interactions Improves Efficiency and User Experience in an Object Positioning Task in Virtual Environments. Applied Ergonomics, 103, p. 103785. doi: https://doi.org/10.1016/j.apergo.2022.103785. Hao, J., Gao, X., Liu, Y. and Han, Z. (2023). Module division method of complex
products for responding to user’s requirements. Alexandria Engineering Journal, 82, pp. 404–413. doi: https://doi.org/10.1016/j.aej.2023.10.021. Hosseini, S. F. and Ghabanchi, Z. (2022). What’s in a Color? A neuropsycholinguistic study on the effect of colors on EEG brainwaves, immediate emotional responses, and English language vocabulary retention among Iranian young adults. Jour- nal of Neurolinguistics, 63, p. 101083. doi: https://doi.org/10.1016/j.jneuroling .2022.101083. Hvass, M., Van Den Wymelenberg, K., Boring, S. and Hansen, E. K. (2021).
Intensity and ratios of light affecting perception of space, co-presence and sur- rounding context, a lab experiment. Building and Environment, 194, p. 107680. doi: https://doi.org/10.1016/j.buildenv.2021.107680. Liu, W., Cao, Y. and Proctor, R. W. (2021). How Do App Icon Color and Border Shape Influence Visual Search Efficiency and User experience? Evidence from an eye-tracking Study. International Journal of Industrial Ergonomics, 84, p. 103160. doi: https://doi.org/10.1016/j.ergon.2021.103160. Mai, L. (2013). Design Method of Equipment Optimization Development Based on
Standardization Theory. Defence Technology, 9(3), pp. 140–145. doi: https://doi. org/10.1016/j.dt.2013.09.012. Rastogi, S., Chandran Nair, S., Murugan, P., Sukumar, A. S., Mammen, J. J. and Mullai, S. (2022). Overall Equipment effectiveness, Efficiency and Slide Review Analysis of high-end Hematology Analyzers. Practical Laboratory Medicine, 30, p. e00275. doi: https://doi.org/10.1016/j.plabm.2022.e00275. Stavropoulos, P., Papacharalampopoulos, A., Sabatakakis, K. and Mourtzis, D.
(2021). Quality Monitoring of Manufacturing Processes based on Full Data Uti- lization. Procedia CIRP, 104, pp. 1656–1661. doi: https://doi.org/10.1016/j.proc ir.2021.11.279. Wang, B., Tie, G., Shi, F., Zhang, W., Song, C. and Guo, S. (2023). Design and frequency control study of small-sized magnetorheological finishing device applied in optical manufacturing. Journal of Manufacturing Processes, 108, pp. 863–876. doi: https://doi.org/10.1016/j.jmapro.2023.11.031.
LISTED IN THE AHFE DIGITAL BOOKSTORE CATALOGUE
Explore the complete digital volume
Usability and User Experience
Read this individual research paper free through the original publisher, or explore the full digital proceedings book.
ISBN 978-1-964867-32-8
Explore this ISBN in the AHFE Bookstore ↗Listed in the July 2026 bookstore catalogue; search by ISBN to confirm current availability · Digital book purchase optional