Yuanyuan Liu, Ying Xia (2024). Region Selector Usability Test:Dropdown vs. Tabs. In: Human Factors and Systems Interaction. AHFE Open Access, vol. 154, pp. 145–154. https://doi.org/10.54941/ahfe1005362
When ordering cloud computing products, users need to select the instance location based on their local area, which can effectively reduce network delay and improve network access speed. At present, the cloud products have a wide geographical coverage, with more than 30 regional options. The style of region selector will affect the efficiency of user region selection. The purpose of this study is to compare the usability of the dropdown and the tabs. Firstly, the optimization process is determined based on the international standard process of user experience, and the problem of the current selector is analyzed through the analytic hierarchy process and Dropdown is determined as the comparison scheme. Then through the comparative analysis of page performance indicators, behavior indicators and business indicators, the data results show that the dropdown selector has better user experience and business value. The above findings can guide cloud computing platform designers to improve a region pooling selector design and provide users with a more user-friendly interactive experience. At the same time, the research process and method can be used for reference in interface design to improve work efficiency and effectiveness.
The National Institute of Standards and Technology (NIST) defines cloud computing as “a model that enables ubiquitous, convenient, on-demand net- work access to a shared pool of configurable computing resources that can be quickly configured and released with minimal administrative effort or service provider interaction”. Cloud computing has five characteristics: on-demand self-service, extensive network access, resource pooling, fast resilience, and measurable services (Marinescu, 2022).
Cloud service providers combine all their computing resource pools (groups) to dynamically allocate and redistribute different physical and vir- tual resources based on consumer demand (Surbiryala and Rong, 2019). The choice of a resource pool is a critical step in purchasing cloud services. Because the networks in different regions are completely isolated, the max- imum stability and fault tolerance between different regions are ensured. Moreover, cloud products in the different areas cannot communicate through the Intranet by default. Therefore, once the resource pool is selected and implemented, it cannot be changed arbitrarily. Cloud providers try to pro- vide appropriate resource pools for users in different geographical locations,
so more options are displayed on the page, making users spend more time in visual search.
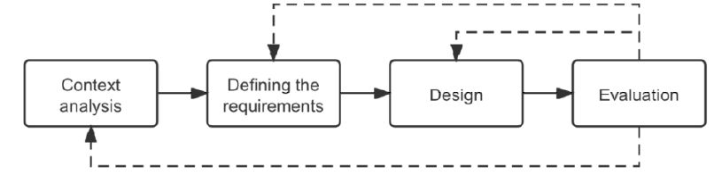
This paper completes the optimization of the regional selector according to the methods and stages of ISO 9241-210-2019. This international is based on user-centered design, which is a product development and design process that focuses on the needs of users to promote the best user experience (Ruiz et al., 2021). The project’s development process is divided into four steps: context analysis, defining the requirements, design, and evaluation (see Figure 1).
Figure 1: User-centered design process (adapted from ISO 9241-210-2019, 2019).
RELATED WORK
User experience (UX) is one of the most popular topics in the industry today and plays an essential role in business success. Since the growth of the busi- ness depends on the customer, it is essential to emphasize the user experience that contributes to customer satisfaction.
In the field of user experience, metrics are used to measure a user’s experi- ence when interacting with a product, system, or service. Using UX metrics, researchers can discover how users feel and experience the products being evaluated. Researchers have different regulations on experience measurement indicators, and common ones are behavioral, problem, self-report, and physi- ological indicators. Behavioural indicators refer to the measurement of users’ behaviours when interacting with products or systems. Problem indicators are used to measure the problems users encounter when interacting with the product. Self-reported metrics are used to calculate a user’s perception or opinion of a product, system, or service; physiological indicators refer to the measurement of the user’s physical behavior or reaction when interacting with the product, including eye movement, skin electroencephalography, and other data (Aulia, Harry and Panca, 2021).
Performance is an essential part of retaining users. Research shows that page loading time exceeding 9s will cause users to close the page (Nah, 2004). For Mobify, every 100 ms reduction in homepage loading speed resulted in a 1.11% increase in session-based conversions and an average annual revenue increase of nearly $380,000. In addition, checkout page load times decreased by 100 ms, and session-based conversions increased by 1.55%, resulting in an annual revenue increase of nearly $530,000 (Joshi, 2023). However, in a performance optimization study, application load times improved by 45%, and no significant impact on user experience was found (Marang, 2018).
Region Selector Usability Test: Dropdown vs. Tabs 147
Choosing a single UEQ (Usability Metric for User Experience) scale as a mea- surement standard is unreasonable. Each index of the scale mainly refers to the feelings, impressions, and attitudes of using products and services, and there is no direct evaluation of page performance.
However, in addition to behavioral indicators, it is also necessary to consider the impact of page performance on usability. Page performance indicators should be included in usability evaluation indicators for pages with a large amount of information. At present, usability indicators need to take page performance indicators and commercial indicators into account. Page performance is a direct user experience of page browsing and opera- tion. Commercial indicators are the measurement elements of the commercial value of natural products.
Region selection is a kind of visual search action, and visual search refers to the search of specific target objects in the background. The character size, the number of characters per line and the number of menu items on the tablet side have a significant impact on the search time and error rate (Hsiao et al., 2019), while the element density of mobile phones has no significant impact on the visual search efficiency of the elderly, but has a certain impact on user experience (Zhu et al., 2023). The above is experimental results in the laboratory, which are usually to find randomly scattered simple words or shapes on the computer screen (Wolfe, 2020). Currently, there is no corre- lation between them in actual Chinese web pages. Components are used as influencing factors to explore how they affect visual search efficiency.
METHODOLOGY
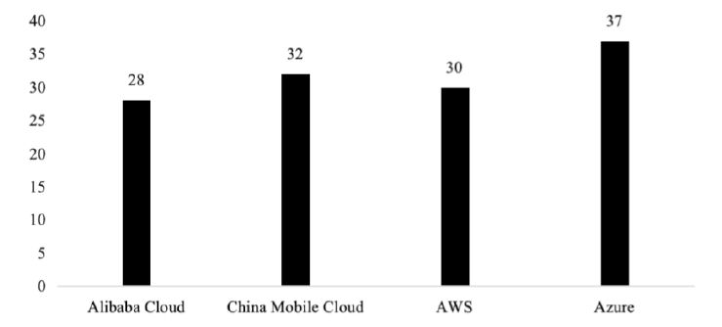
Context Analysis Resource pool selection is widespread in cloud services and necessary when ordering various cloud products. A resource pool area refers to the geo- graphic area where resources are located. It is usually divided by the city where the data center is located. Figure 2 shows the regional number of resource pools of Alibaba Cloud, AWS (Amazon Web Services), Azure, and China Mobile Cloud, with an average of 31.75 resource pool options dis- tributed in Chinese Mainland, Hong Kong, Macao, and overseas. In Chinese Mainland, the resource pools of various manufacturers are mainly distributed in four regions: North China, East China, South China and Southwest China.
When selecting a resource pool, users mainly consider geographical location, inter-intranet communication requirements of multiple products, resource price, and business filing.
Geographical location: The closer the distance between users and resource deployment areas, the lower the network delay and the faster the access speed.
Intranet Interworking requirements for multiple products: If numerous products have Intranet interworking requirements, all resources must be deployed in the same region.
Resource price: The price of resources in different regions may be different, so choose the right area according to your budget.
148 Liu and Xia
Business filing: Each province (or city) communications administration has different approval requirements for business filing, and selecting the right cloud product in the designated region is necessary.
Users need to consider multiple factors, and the cloud product ordering page needs to provide a quick-to-target design to enhance the experience.
Figure 2: Average number of resource pools of different cloud providers.
Defining the Requirements The current solution is a tabs component, which can classify a large amount of information. On the one hand, it can improve the efficiency of searching information. On the other hand, it can simplify the information obtained by users at a time, so that users can focus on the currently displayed content. The tab-level classification is resource deployment areas (see Figure 3), and the TAB toggles the classification to the specific locale content. This compo- nent can help users quickly understand the current cloud service providers’ geographical classification, and according to their needs to select a regional classification, and then select a specific region.
Figure 3: Region selector - tabs component.
Figure available in the original PDF paper.
The voice of the customer (VOC) system is a set of tools, methods, and techniques that systematically collect and analyze customer needs and how customers value those needs. VOC is a meaningful business asset that helps improve products, prevent problems, correct errors, and ultimately increase customer loyalty (Lacher, Tachkov and Volker, 2019). Through customer
Region Selector Usability Test: Dropdown vs. Tabs 149
complaints, experience evaluation and usability testing, we collected the fol- lowing questions about selecting regions, mainly focusing on page loading performance, more clicks, and long search time.
Do not know the geographical classification of the target region. It would help if you switched to view it one by one.
The page load time is too long when switching geographical categories.
Visual search takes a lot of time for lower-ranked target regions.
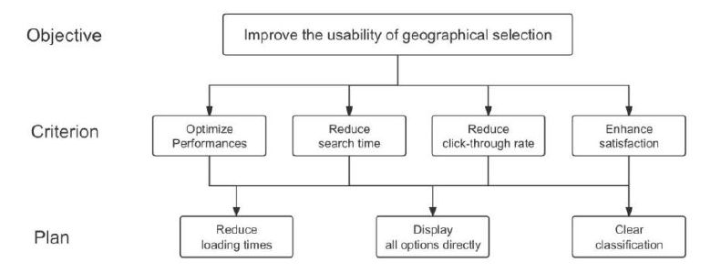
The Analytic Hierarchy Process (AHP) evaluates the design elements and decomposes the decision problem into different hierarchies according to the overall objective, sub-objectives of each level, evaluation criteria, and even the specific backup plan. This work can significantly reduce the risk of design decisions (Liuet al., 2023). Figure 4 shows the process of improving the usability analysis of geographical selection. The final optimization measures include reducing load times and tiling all options.
Figure 4: Analytic hierarchy process for regional selectors.
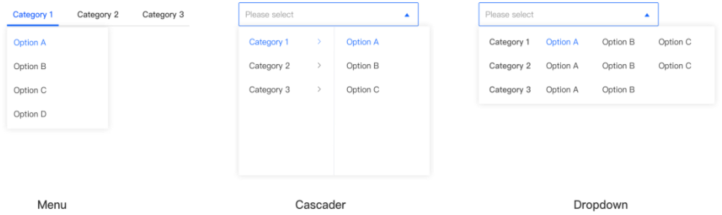
Design Region selection behavior is a visual search behavior, selecting a target among many options, only one option can be selected at the same time, and the selected one will immediately cancel the previous option. In interface design, three select Modules meet the requirements of regional data selection, namely Menu, Cascade, and Dropdown (see Figure 5).
Menu - Provides a multi-level structure to hold and arrange many options, click the menu title, expand only the current menu, collapse all other expanded menus, and keep the menu focused and simple.
Cascader—The options need to be in a certain logical order. Based on the value of the previous selection, only the corresponding options are displayed in the following options. Choose from a set to a single item, and preferably a set that conforms to the user’s cognitive model.
Dropdown - Collapses alternative commands or menus into a floating container that expands downward. To select one or more items from a set of similar data, you can use the dropdown selector and click to select the corresponding item.
150 Liu and Xia
Figure 5: Three selectors.
To reduce the development cost, the expert scoring method is first selected to select the best scheme. Recruit five experts in the design field according to the number of clicks, content carrying capacity, and classification clarity according to 1–5 points; the less the number of clicks, the greater the content carrying capacity, the higher the classification clarity, the higher the score, otherwise, the end of the score. As shown in Table 1, the three selectors and the average score of the three dimensions are shown. The final score of the selection box is 3.67, so the dropdown is the final scheme.
Table 1. Three components score results.
Table available in the original PDF paper.
Menu Cascade Dropdown Clicks 2.7 1.4 4.8 Amount of information 2.6 2.2 3.8 Classification clarity 3.8 3.8 2.4 Total score 3.03 2.47 3.67
Figure 6: Region selector - dropdown component.
Region Selector Usability Test: Dropdown vs. Tabs 151
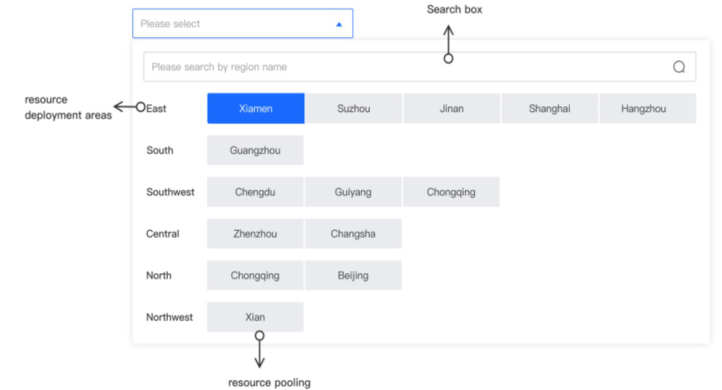
The content of regional selection information includes regional classifi- cation and corresponding region, combined with the characteristics of the selection box and the AHP analysis results. A search box is added at the top of the selector, all options are displayed tiled, and classified information is added. The final scheme is shown in Figure 6.
Evaluation Standard interface evaluation methods are divided into Card sorting, Eye tracking, Surveys, Analytics, A/B testing, Heuristic evaluation, etc. (Salvendy et al., 2021). The usability evaluation method selected system data analysis. Software systems can capture information from which user behavior data can be tracked and optimized for improved visualizations can be analyzed.
Based on the usability evaluation indicators of the problem analysis results, behavioral indicators, commercial indicators, and page performance indica- tors are selected. Behavioral metrics include search duration and number of clicks, commercial metrics are conversions, and page performance metrics are Total time.
Search duration: The duration from the first click to the last click
Number of clicks: The number of mouse clicks in the region selector
Conversion rate: The ratio of purchased users to daily visitors (see Formula 1). To a certain extent, the conversion rate can measure the strength of user demand for a product, judge the quality of product design, determine whether it can help users solve problems, comb the transformation funnel of the product process, and so on.
Total time: The total time spent by the function after clicking the activity plus the time spent in the function that called it. In the figure, yellow is the total time of clicking events.
Formula 1: Conversion rate formula.
RESULTS AND DISCUSSION
The availability data of Tabs and Dropdowns were selected for 6 months. The behavioral and business indicators were obtained from the data collec- tion systems of cloud service manufacturers, and the page performance was provided by Google Chrome DevTools.
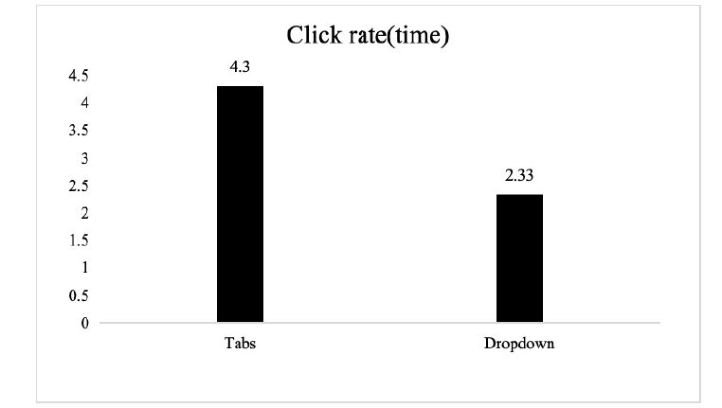
Figure 7 shows the average number of clicks on tabs and dropdowns. The former scheme’s average number of clicks is 4.3, and the new scheme’s is 2.33. The average number of clicks of users is reduced by 45.8%, which means that the average number of page loading times is also reduced by 1.97 times, greatly reducing the page loading burden.
152 Liu and Xia
Figure 7: Bar chart of average clicks.
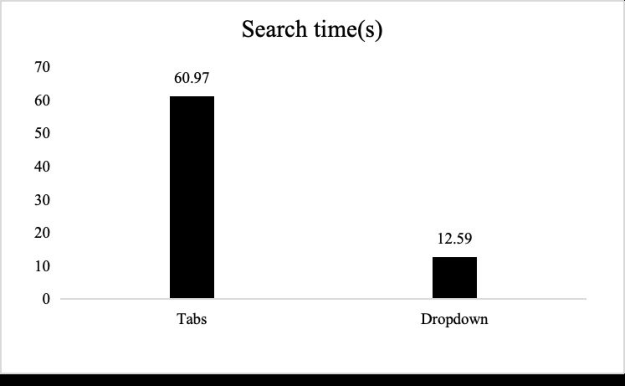
Figure 8 shows the average search time of tabs and dropdowns. Before optimization, the average user spent 60.97s searching and selecting the target area, which was reduced by 48.38s after optimization, indicating that users could quickly select the target.
Figure 8: Bar chart of average search time.
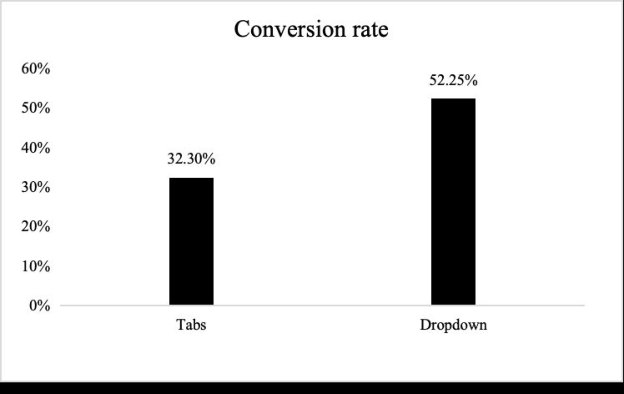
Figure 9 shows the average conversion rates of tabs and dropdowns. The conversion rate of the optimized scheme increased by 19.95%, which means that more users completed the ordering process. This indicates the high effectiveness of the scheme and improved product ordering rates.
Region Selector Usability Test: Dropdown vs. Tabs 153
Figure 9: Bar chart of conversion rates.
CONCLUSION AND FUTURE WORK At present, there are more comprehensive component libraries for designers to choose from, and availability is the main index to measure component suit- ability. Realistic products should not only consider user behaviors indicators but also consider page performance indicators and business indicators; these three indicators complement each other and jointly measure the effectiveness of the design, user satisfaction, and business value of the product.
In this design optimization, one of the key issues - the regional selec- tion component is selected, and the optimization is completed based on the methods and stages of ISO 9241-210-2019 standard. In the later stage, the optimization of difficult problems such as security group and network selection is still based on this method.
In this geographical selection scenario, we incorporate the total time index into the page availability index, and get a satisfactory result. We will continue to study how other page performance metrics affect different ordering phases.
ACKNOWLEDGMENT
Thanks to the R&D management team and the Computing product depart- ment of China Mobile Cloud for providing the research platform and person- nel support, especially Leader Lingkun Meng, Group Leader Fangyan Bao, and Ying Xia for giving guidance and help, who made the research completed and achieving satisfactory results.
REFERENCES
Guzman-Fernandez, Maximiliano, Luna-García, Huizilopoztli, Collazos, Cesar A., Sarmiento, Wilson J., Galvan-Tejada, Jorge I., Gamboa-Rosales, Hamurabi, Galvan-Tejada, Carlos E., Celaya-Padilla, Jose M., Zambrano-de La Torre, Misael and Lara-Cisneros, J. Guadalupe (2021). Desktop Application for Water Quality
154 Liu and Xia
Prediction and Monitoring System Using ISO 9241–210 and Machine Learning Techniques. In: Ruiz, Pablo H., Agredo-Delgado, Vanessa, and Kawamoto, André Luiz Satoshi (eds.) Human-Computer Interaction. Cham: Springer International Publishing, pp. 44–57. Hsiao, Chih-Yu, Wang, Mao-Jiun, Liu, You-Jia and Chang, Chien-Chi (2019).
Effects of Chinese character size, number of characters per line, and number of menu items on visual search task on tablet computer displays for different age groups. International Journal of Industrial Ergonomics, 72, pp. 61–70, doi: 10.1016/j.ergon.2019.04.006. Inan Nur, Aulia, B. Santoso, Harry and O. Hadi Putra, Panca (2021). The Method and Metric of User Experience Evaluation: A Systematic Literature Review. In: 2021 10th International Conference on Software and Computer Applications. Pre- sented at the ICSCA 2021: 2021 10th International Conference on Software and Computer Applications, Kuala Lumpur Malaysia: ACM, pp. 307–317. Joshi, Mayank (2023). The Need for Speed: Exploring the Impact of Fast Load Times
on User Experience. Lacher, Stefan, Tachkov, Philipp and Völker, Rainer eds. (2021). Digitalisierung im Marketing: was Unternehmen heute für den Erfolg von morgen tun müssen. 1. Auflage. Stuttgart: Verlag W. Kohlhammer. Lewis, James R. and Sauro, Jeff (2021). Usability and User Experience: Design and
Evaluation. In: Salvendy, Gavriel and Karwowski, Waldemar (eds.) Handbook of Human Factors and Ergonomics. Wiley, pp. 972–1015. Liu, Wei, Huang, Yi, Sun, Yue and Yu, Changlong (2023). Research on design elements of household medical products for rhinitis based on AHP. Mathematical Biosciences and Engineering, 20(5), pp. 9003–9017, doi: 10.3934/mbe.2023395. Marang, Ah Zau (2018). Analysis of web performance optimization and its impact
on user experience. Marinescu, Dan C. (2022). Cloud Computing: Theory and Practice. Morgan Kaufmann. Nah, Fiona (2004). study on tolerable waiting time: how long are Web users willing
to wait? Behaviour & Information Technology, forthcoming. Behaviour & IT. 23. Surbiryala, Jayachander and Rong, Chunming (2019). Cloud Computing: History and Overview. In: 2019 IEEE Cloud Summit. Presented at the 2019 IEEE Cloud Summit, Washington, DC, USA: IEEE, pp. 1–7. Wolfe, Jeremy M. (2020). Visual Search: How Do We Find What We Are Looking
For? Annual Review of Vision Science, 6(1), pp. 539–562, doi: 10.1146/annurev- vision-091718-015048. Zhu, Shangshang, Wang, Xiaoxia, Li, Wenjie and Dong, Yenan (2023). Impact of the density of the elements belonging to the quick access area of a smartphone app on the visual search efficiency and user experience of elderly people. Displays, 76, p. 102363, doi: 10.1016/j.displa.2022.102363.
LISTED IN THE AHFE DIGITAL BOOKSTORE CATALOGUE
Explore the complete digital volume
Human Factors and Systems Interaction
Read this individual research paper free through the original publisher, or explore the full digital proceedings book.
ISBN 978-1-964867-30-4
Explore this ISBN in the AHFE Bookstore ↗Listed in the July 2026 bookstore catalogue; search by ISBN to confirm current availability · Digital book purchase optional