Arnaud Koustanai, Sabine Langlois, Jean-baptiste Haue (2024). Technology for improved drivers’ safety: Testing a multimodal HMI. In: Human Factors and Systems Interaction. AHFE Open Access, vol. 154, pp. 123–133. https://doi.org/10.54941/ahfe1005360
Using driving automation technology to shift from reactive to anticipatory HMI could enable drivers to improve safety. To this end, a system helping drivers to anticipate risks was developed. In a previous study, cross-analysis between accident databases, driving instructor expertise and on-road observation led to prioritize seven types of risk. A system based on sensors and prediction algorithms was then developed to recognize and objectify risk levels. The present study was the first user-test of the system. Twelve participants were asked to drive as usual and evaluate timing, relevance, utility, and usefulness of warnings to improve risk awareness. They were also required to report risks that they considered missed by the system. Participants drove in an area involving risks related to infrastructure and traffic configurations: (1) a pedestrian crossing frequently hidden by buses stopped at the station (BUS), (2) an unexpected sharp curve, possibly hiding an obstacle (CURVE), and (3) a pedestrian crossing with reduced visibility on sidewalks and high pedestrian traffic (CROSSING). Informative icons were displayed when approaching respectively CURVE and CROSSING to indicate the type of risk (i.e., permanent risks linked to the infrastructure). They were associated with a soft tone to ensure they were perceived and, thus, evaluated by drivers. A LED bar, activated at the bottom of the windshield, indicated the location of potential hazard in CURVE and BUS (i.e., transitory risks linked to traffic). Due to the high probability of meeting pedestrians in BUS, the LED bar was associated with an urgent sound. The results showed that both LED bar and sound were highly relevant in BUS situation, as drivers recognized that overtaking the bus was a frequent and very dangerous practice. In CURVE, drivers considered that an informative icon and sound were useful or, at least, not annoying since they experienced the severity of the turn. However, the LED bar appeared not very relevant because drivers were already warned by the informative icon and thought that encountering an obstacle on their lane was not certain. They rather considered that the main risks were lane departure or oncoming traffic. In CROSSING, the informative icon was not understood because the presence of a pedestrian crossing seemed obvious, or because the driver was already coping with potential pedestrians. Finally, drivers expected that the system would report pedestrians walking on the road, or close to cross, because they could represent an obvious risk of collision in case of distraction. We conclude that the LED bar is only effective for guiding attention on risk related to the traffic. Informative icon related to infrastructure seems understandable only when risk is experienced by drivers. Reporting collision risk with pedestrian, when possible, is a desired function for improving safety. The study supports changes in multimodal HMI strategy to improve system efficiency, especially to carefully design HMI signals to be associated to perceived risks or, afterwards, to missed risks.
For several decades, driving technologies have been developed to correct or to replace humans in the driving task. In the meanwhile, the approach of Safety II has been proposed to move the focus from correcting errors toward pro- moting successful behaviors and supporting human adaptability (Hollnagel, 2014; Provan et al., 2020). In the domain of driving, the perception and scene understanding tech- nologies developed for automated driving offer the opportunity to support drivers’ attention and reactions to cope themselves with the situation. Reac- tive HMI to acute events (e.g., near collisions) could thus be enriched to become anticipative and to empower drivers, who remain the first and main actors of road safety.
Driving indeed requires the management of a wide variety of situations, sometimes complex or unexpected. Many road accidents can be explained by poor anticipation of risks from the driver, by errors in perception, inter- pretation, or projection towards future states of the situation, leading to a partial or erroneous awareness of the situation (Endsley, 2020; van Elslande, 2003). A system identifying risk situations in order to guide drivers’ attention, improving their skills over time, offers new perspectives for making driving more comfortable and safer.
Such a system must be able to inform drivers about risk they are not neces- sarily aware of, particularly in cases where obstacles impede visibility (Higelé & Hernja, 2008; Brenac, 2008; van Elslande et al., 2004).
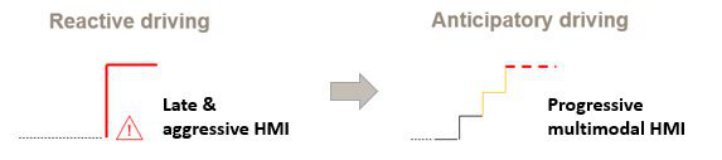
Prior to this work, a study was conducted on open roads to specify how information and alerts could help the driver to limit risk taking (Chajmowicz et al., 2023). Its results guided the development of a system reusing scene understanding technology initially prepared for automated driving. We also developed a multimodal human machine interface (HMI), mixing visual and auditory signals, to provide messages to the driver, gradually increasing the perception of urgency. As illustrated in Figure 1, multimodal HMI has the benefit to help the driver anticipate what to do and avoid experiencing a late and aggressive HMI of safety systems such as advanced emergency braking systems (AEBS).
Figure 1: From reactive to anticipatory driving thanks to multimodal HMI.
The reported study was conducted in the same geographical area as the previous one, to evaluate the system and check if the designed multimodal HMI was relevant to inform and alert the driver.
Technology for Improved Drivers’ Safety: Testing a Multimodal HMI 125
METHOD
Description of the Evaluated System The aim of the system is to support the driver in avoiding risk taking, as a human copilot would do. The preliminary study, without system onboard (Chajmowicz et al., 2023), allowed us to specify the needs that the system should fulfill, from the identified pain points:
1. Detect that the driver has a risky lane change intent. 2. Detect the approach of a sharp curve that requires a speed below the legal speed limit (2.1). In the curve, detect a speed too high to avoid a collision with road users hidden by the curve, either on the lane used by the driver (“ego lane”) or in another lane, typically the lane dedicated to oncoming traffic (2.2). 3. Detect the approach of a pedestrian crossing that requires particular attention to pedestrians around because they could be hidden and pop up, and because a fatal accident took place there some years ago.
The Table 1 describes how the risk evaluation was designed.
Table 1. Description of risk types and capacities of the system to evaluate risk.
Table available in the original PDF paper.
Risk id Risk type How the system evaluates risks 1 Lane change The system detects that the driver is using his left indicator, or the left tire gets close to a solid line. 2.1 Risky curve approach The system contains the list of the curves that require a speed lower than the legal limit to prevent from driving out of the lane. 2.2 Risky curve overspeed The system estimates the probability of collision with pedestrians walking on the part of the road hidden by the curve. 3 Risky pedestrian crossing approach
The system contains a list of pedestrian crossings where it was estimated that the driver could be surprised by the presence of pedestrians, e.g., visible too late.
The localization of the risky curves (risk 2.1) and pedestrian crossings (risk 3) were manually defined. Our priority was indeed to check the interest of an HMI, at the localizations identified as risky in our preliminary study, rather than developing a model able to identify risky curves and risky pedestrian crossings.
The presence of a mask in a curve (2.2) was detected from the buildings position in the cartography used by the system, provided by governmental databases. This type of risk can be called “hidden risk created by infras- tructure”. As the vehicle’s perception of traffic around was solely based on onboard sensors, and not on vehicle-to-X information, the presence of hidden pedestrians was a worst-case assumption.
Multimodal HMI Strategy There is a scale among the urgency of the risks taken by the driver: low when the driver is approaching a risky place (risks 2.1 and 3), moderate when the risk is hypothetical (risk 2.2) and high when the risk is established (risk 1).
The messages released by the copilot system follow the urgency scale: from “information” to prevent the driver from being surprised, when urgency is low, to “alert” to induce a driver’s reaction, mainly to slow down, when urgency is moderate or high.
Table 2 describes the strategy that associates messages with signals pro- duced by different HMI enablers:
LED bar positioned on the bottom of the windshield, providing yellow signals (red being dedicated to AEBS), either on right hand or on the left-hand side of the vehicle, to match with the localization of the risk.
Screen placed in the middle of the dashboard (replacing the multimedia screen), displaying icons.
Loudspeaker, with either a soft sound (“dong”), meant to attract the gaze toward the screen, or an urgent sound (“beep”) to alert the driver to quickly inhibit an action, here the lane change.
Table 2. HMI rational.
Table available in the original PDF paper.
HMI description Information Alert level 1 (moderate risk)
Alert level 2 (high risk) Hidden zone Time to risk ∼15s to ∼6s ∼6s to ∼4s ∼4s Icon (explains risk) Sharp curve Pedestrian crossing
LED bar (directs attention) Yellow localized Yellow localized with flicker Sound (attracts attention) Soft sound N/A Urgent sound Expected behaviour Anticipate a potential risk Release accelerator Inhibit action
This configuration led to adapt HMI to risk level:
Low risk: soft sound (“dong”) to attract attention toward icons (risky curve and pedestrian crossing) to provide information.
Moderate risk: icon to explain risk (risky curve) while LED bar directed attention toward risk location (risky curve only) to suggest a change in planed action.
High risk: urgent sound (“beep”) to warn the driver and flashing LED bar to convey immediate action (lane change only).
UX Testing Protocol The protocol was designed to evaluate the hypothesis that the proposed multimodal HMI strategy is relevant for:
1. BUS: indicate the risk to encounter a pedestrian when overtaking the bus. 2. CURVE: indicate a forthcoming sharp bend with a risk to face an obstacle. 3. CROSSING: indicate the need for a particular attention to pedestrians.
12 participants were recruited among Renault employees for insurance issues, 8 men and 4 women, mean age = 38 (from 21 to 60). They were selected from those interested in the system, i.e. if answering “yes” at recruit- ment question “would you be interested in a system that would warn you
Technology for Improved Drivers’ Safety: Testing a Multimodal HMI 127
when you are taken risk while driving”. They got their driving license 24.5 years ago (from 3 to 40 years). They drove at least once a week.
Participants were introduced to the car and the system. They drove 20min on open road to reach the testing area, getting used to the car. During the drive, as soon as they had crossed a testing place, the experimenter asked them to stop and park. When drivers approached the bus stop, the experi- menter asked them to park, wait for a bus to come, follow it and simulate the initiation of a lane change by turning the indicator on without doing the lane change.
Table 3 lists the questions asked, the response scale, and the performed analysis.
Table 3. Score and analysis from the questionnaire.
Table available in the original PDF paper.
Question Score Score analysis % of response Perceived risk 6-points scale from None to Very high
% of response
HMI timing 3-points scale: Too late / Good / Too early HMI relevance, LED bar / icon / sound usefulness
Scale 0–10 Average; standard deviation
Other data were collected and used to contextualize the scores: video of the front driving scene (with faces and plates anonymization) and eye-tracker.
RESULTS
Table 4 summarizes the outcome of the questionnaires. The scores suggest that the HMI strategy was satisfying for BUS but should be reconsidered for CURVE and CROSSING. The main trend is that lower perceived risks led to a decrease in the relevance of the HMI messages.
Table 4. Evaluation of perceived risk, messages, and number of respondents (N), and standard deviation (SD) for each scenario.
Table available in the original PDF paper.
Type of evaluation BUS alert CURVE information
CURVE alert CROSSING information
Equations and mathematical formulas are available in the original paper PDF.
BUS Scenario The results are based on 10 participants, as 2 did not meet the traffic conditions to experiment the scenario.
All participants appreciated the alert in BUS. They unanimously consid- ered that the situation was very risky mainly because of the traffic masked in the opposite direction. But only half of them thought that hidden pedestrians also posed a risk. The alert was thus mainly understood as an incentive not to overtake the bus stopped in front of them (7/10). Marginally, it was under- stood as a warning about the lack of visibility (2/10) or the need to be vigilant (1/10). Participants perceived the alert as deterrent (6/10) or as increasing the perceived risk (4/10).
Participants also acknowledged that the LED bar drew their attention to the direction of the risk, i.e., attempt to overtake. Only one person found the information counterintuitive because the main risk was to meet a pedestrian who would come from the right (at the front of the bus). The intrusive sound was also perceived as acceptable given the dangerousness of the situation. In addition, all participants found that the alert came at the right time, i.e., when they were about to pass and that they still had the opportunity to change their mind.
However, participants experimented the alert as useless and very annoying when they crossed a solid line to pass a cyclist or a parked vehicle (N = 6). They considered that partially crossing a solid line did not pose a risk, even if they acknowledged that they were allowed to do so.
CURVE Scenario Half of the participants perceived the situation as moderately risky (6/12). The others considered it posed little risk (3/12), or even no risk (3/12). The main identified risk was the lack of visibility in the turn (8/12) rather than negotiating a sharp turn (3/12). The information given before the curve was primarily identified as a warning about the possibility of a collision with an oncoming vehicle, either because it would cut the curve, or by poor control of its own trajectory (9/12). The risk of encountering an obstacle while exiting of the curve was much less considered (2/12). Half of the participants stated that the information led them to approach the curve more cautiously. The others thought that they were already cautious enough and that the information was thus unnecessary.
The soft sound that accompanied the display of the icon was not perceived by most of participants (7/12). However, the eye-tracker analysis confirmed that the sound had drawn their eyes to the display screen. Moreover, par- ticipants who recalled hearing the sound felt that it was useful to attract attention. This result can be attributed to the soft character of the sound, non- intrusive but sufficient to draw attention to the display, which was retained as the main source of interest.
For all participants, the information before the curve was given at the right time. This was not the case for the alert. It was supposed to indicate the pres- ence of a potential obstacle when exiting the curve. Most of participants did not perceive either the LED bar (7/12), nor the icon (9/12). Those who
Technology for Improved Drivers’ Safety: Testing a Multimodal HMI 129
perceived the LED bar did not understand it (2/12) or interpreted it as infor- mation about the curvature of the bend, redundant with the first information (2/12). Only one person assumed that it could indicate the potential presence of an obstacle. This person was also the only one who did not consider the alert to be too late. This result could be due to the precautions already taken by the participants following the information given before the curve, leading to a speed adapted to a potential obstacle. In addition, the lack of perception of the LED bar and/or icon could reflect the focus of participants’ attention on the oncoming traffic and trajectory control rather over other sources of information. Also, identifying the risk of a potential obstacle is less direct than in the confrontation with a real one. The icon, specially developed for the study, was not sufficiently explicit to remove the ambiguity.
Contrary to our assumptions, alerting about the potential presence of a hidden obstacle was received differently in CURVE and in BUS. This may be due to the difference in probability of occurrence of these two types of risk. Taking sharp curves is relatively frequent whereas encountering an obstacle in the curve is relatively rare. This was reflected by the perception of par- ticipants who were primarily concerned about the risk of collision with an oncoming vehicle. In comparison, the probability that a pedestrian cross in front of a bus appears higher.
CROSSING Scenario HMI strategy had the lowest relevance in CROSSING. All participants found that the situation showed very low risk (5/12), or even no risk (7/12). The information was thus understood as signalling a dangerous pedestrian cross- ing (8/12) but without understanding why. It was also understood as an indication of the presence of pedestrians (4/12) whereas, if they were present, they did not pose a danger. Even though the meaning of the icon was clear (pedestrian crossing), it was not useful in the situation. In this context, par- ticipants felt that the information had no impact on their behaviour (9/12) or increased their vigilance without really knowing where to direct it (3/12). Nevertheless, 4 participants felt that the alert allowed them to understand the functioning of the system, i.e., the type of detected situation. They also felt that it remains useful to increase vigilance when approaching a pedes- trian crossing as a lack of attention is always possible and could have serious consequences.
As for CURVE, many participants did not recall hearing the soft sound (5/12). For the others, the sound was relevant as it drew attention to the display screen (3/12), but this effect was not always perceived as necessary in the absence of risk (2/12) or because the icon had already been seen (2/12). Half of the participants felt that the information came at the right time while the others found that it intervened too late because they had already started to manage to the situation.
Desired Functions In addition to the assessment of the HMI strategy, participants were asked to indicate situations where they would have liked to receive a message from
the system. These results are not based on a systematic evaluation as they depended on the situations that were encountered during the driving.
Two categories of risks have emerged. Firstly, participants encountered sit- uations where they had to brake hard to avoid a collision with other vehicles (N = 5). In these situations, expectation of an alert was not surprising as there experienced a risk of collision. In this study, collision alerts were not implemented because the system was not yet developed enough to avoid false alerts. Nevertheless, some participants stated that this type of alert would be most useful when they are distracted. Alerting only when the driver is dis- tracted thus seems an interesting path to explore further. Secondly, several participants expected the system to react when they encountered pedestrians or cyclists who were quickly approaching pedestrian crossings (N = 6), seen at the last moment (N = 2), or pedestrians on the roadside (N = 2). In con- trast to CROSSING, the dynamic of vulnerable road users (VRU) requires a particular attention. Participants thus admitted that there was no risk of col- lision per se but considered that a notification from the system would have been reassuring.
Discussion
The purpose of the system was to use advanced technology to help drivers to anticipate unobvious risks. The multimodal HMI strategy was thus developed to convey early messages (i.e., information and alerts) in three situations. It was hypothesized that an urgent sound and a LED bar signal should be effec- tive to indicate the presence and location of a potential obstacle, while a soft sound and a visual sign should be effective to advise about an infrastructure complexity. The study was limited by the fact that participants experienced little actual danger. Messages could thus have appeared excessive in most of the situations. Results were also collected from relatively few drivers. How- ever, they provided high-qualitative outcomes about positive and negative aspect of the HMI strategy.
Learning: Impact of Perceived Risk on Relevance of HMI Strategy The main learning is that messages have to be coherent with perceived risk: the higher the perceived risk, the more relevant the message was. This result was comforted by scores from survey, the messages correctly understood, and expectation reported by participants about other road users. The strategy developed to indicate the risk in BUS therefore appears adapted. In particu- lar, the LED bar signal proved to be self-explaining the risk because it fitted perfectly into the current driving situation. The reason was that participants perceived a risk (mainly oncoming vehicle), even though it did not exactly match the message (hidden pedestrian). In CURVE, the information (ear- lier HMI strategy) was perceived as relevant since participants experienced a sharp turn just after. In contrast, the alert (later HMI strategy) appeared poorly understandable because participants were already informed and/or were not expecting an obstacle. In CROSSING, narrow sidewalk and hidden paths on both road sides made it difficult to expect a large flow of pedestri- ans. This difficulty led to low-risk perception which, in turn, increased the
Technology for Improved Drivers’ Safety: Testing a Multimodal HMI 131
risk associated to the place. In addition, participants did not experiment any perceived risk such as in CURVE. As for CURVE’s later HMI, a redefini- tion of the strategy would be to issue alerts only when drivers have a speed too high to safely manage CROSSING. In this case, the risk should be easily understood and should result in effective behavioural adaptation.
Design Recommendations for Multimodal HMI Consequently, some redefinitions of the HMI strategy are proposed (Table 5). In BUS, displaying an icon indicating the type of risk (hidden pedestrian) could strengthen the understanding of the actual cause of activation.
However, in all scenarios, HMI should be designed to be activated in situa- tion when drivers perceive a risk related to their action, potential interactions with other road users, or can understand afterwards what the missed risk was. Thus, alert with LED bar could be activated when driver approaches too fast a zone of interest (ZOI), i.e., an infrastructure generating traffic flow (e.g., pedestrian crossings, intersection), hidden by traffic (e.g., BUS), road geometry (e.g., curve or slope), or constructions. Also, the LED bar could be activated as soon as there is a risk of collision with a perceptible road user. In this way, the signal would orient drivers’ attention towards an obvious aspect of the situation, leading to an easy understanding and, therefore, an effective anticipation. In addition, an icon depicting respectively the type of ZOI or the road user involved would remove any doubts about the cause of activation. In the same vein, LED bar could be activated when drivers approach too fast specific infrastructures like sharp curves and dangerous pedestrian crossings. In CURVE, the information given when entering the curve was quite effec- tive to warn drivers about a sharp turn. It is likely that it would be even more relevant if their speed had been inadequate. Moreover, reduced speed should have helped handle a possible obstacle in the bend. Thus, alert could decrease both risk of losing vehicle control and colliding with a hidden obstacle. Sim- ilarly, an alert could be given in CROSSING only when approaching too fast to manage safely dangerous pedestrian crossings, where potential pedestri- ans could be hidden by infrastructure. In both cases, the high speed should help understanding the risk taken, resulting in a more effective behavioural adaptation. The LED bar could orient drivers’ attention towards the oncom- ing infrastructure while icons (e.g., traffic sign depicting pedestrian crossing, intersection) could allow an easy understanding of the risk involved. Note that high-definition cartography makes the location of ZOI hidden by infras- tructure highly predictable. The information used in CURVE could be thus activated if the bend hides a ZOI. Whatever speed, the information would be perceived as useful by drivers, leading to better anticipation of the oncoming situation.
Finally, VRU appeared to need particular attention even when they did not pose an obvious risk. Thus, an HMI strategy could be to notify VRU once they show a relatively low probability of collision. A non-intrusive mes- sage, separated from alerts, could use white colour instead of yellow, relevant for alerts. The implementation of a kind of “reassurance function” seemed expected for a system dedicated to increase safety. It could provide many
advantages such as allow users to verify that the system is activated, operating properly and ready to come forward in case of proven risk. This reassurance function could be relevant considering that the occurrence of real risks may be relatively rare, leading to a better mental representation of how the sys- tem works. For all proposed solutions, the challenge will be to determine the relevant risk threshold and timing to activate the system.
Table 5. Redesign proposal for multimodal HMI strategy.
Table available in the original PDF paper.
Situation Condition Information Low risk (white) Moderate / High risk (yellow) BUS ZOI Icon + LED bar + urgent sound CURVE ZOI Icon + soft sound CURVE overspeed Icon + LED bar CROSSING overspeed Icon + LED bar Reassurance Collision risk Icon
CONCLUSION
Designing a system to promote anticipatory driving consists of equally detecting potential risks and carefully filtering situations where they will be experienced as relevant by drivers, i.e., corresponding to a perceived risk or allowing to identification of a missed risk.
The multimodal HMI strategy is based on complementary means. Firstly, the LED bar signals can connect the driver to the source of risk either by designating a visible target or by drawing attention toward a hidden zone. In addition, it could monitor low risks related to VRU to reassure the driver that the system is operational. Secondly, icons can explicit the type of risk involved: existing traffic signs would be the most effective. Lastly, soft sounds could be associated to information while urgent sounds should be dedicated to alerts at a high-risk level. The risk hierarchization could be defined accord- ing to the visibility of an obstacle (visible / hidden), the type of obstacle (VRU / vehicle / object), and driver’s speed.
Additional criteria could be used to optimize the relevance of HMI strategy by inhibiting or, on the contrary, decreasing message activation level: drivers’ current state of alertness or, more specifically, gaze orientation toward hazard location could indicate if they already noticed the risk factor. Detection of poor weather or low lightning condition could also induce reduced visibility.
Drivers aided by such an attention monitoring system could learn to detect the situations when the HMI is triggered. The anticipation of the adequate driving reactions would then make progressively disappear HMI alerts, while the risk management is progressively appropriated by the driver.
ACKNOWLEDGMENT
The authors would like to acknowledge Clara Gandrez, Mathieu Barbier, Alexandre Armand, Guillaume Willemotte, and all the project team for their precious contribution.
Technology for Improved Drivers’ Safety: Testing a Multimodal HMI 133
REFERENCES
Brenac, T. (2008). Insécurité routière des jeunes piétons. Processus d’accidents et stratégies de prévention. Territoire en mouvement Revue de géographie et aménagement. Territory in movement Journal of geography and planning, (1), 14–24. Chajmowicz, H., Gandrez, C., Haué, J. B., Hernja, G., Koustanai, A., Langlois, S.,
Meyrignac, J. G. (2023). Identification et objectivation des situations de risque perçu pour concevoir un copilote-coach de conduite. Epique conference. Endsley, M. R. (2020). Situation awareness in driving. Handbook of human factors for automated, connected and intelligent vehicles. London: Taylor and Francis. Higelé, P., & Hernja, G. (2008). La compréhension des situations de conduit et
les prises de risque chez les conducteurs novices jeunes, Recherche, Transport, Sécurité, 13–37. Hollnagel, E. (2014). Safety-I and safety-II: The past and future of safety management. https://doi.org/10.1080/00140139.2015.1093290. Provan, D. J., Woods, D. D., Dekker, S. W. A., & Rae, A. J. (2020). Safety II professionals: How resilience engineering can transform safety practice. Relia- bility Engineering & System Safety, 195, 106740. https://doi.org/10.1016/J.~RES S.2019.106740. Van Elslande, P. (2003). Erreurs de conduite et besoins d’aide : une approche
accidentologique en ergonomie. Le travail humain, 66, 197–224. Van Elslande, P., Fouquet, K., Michel, J. E., & Fleury, D. (2004). Analyse approfondie de l’accidentologie en aménagements urbains : erreurs, facteurs et contextes de production. 2004, 83p. hal-00546128.
LISTED IN THE AHFE DIGITAL BOOKSTORE CATALOGUE
Explore the complete digital volume
Human Factors and Systems Interaction
Read this individual research paper free through the original publisher, or explore the full digital proceedings book.
ISBN 978-1-964867-30-4
Explore this ISBN in the AHFE Bookstore ↗Listed in the July 2026 bookstore catalogue; search by ISBN to confirm current availability · Digital book purchase optional