Jung Yeh, Xing Wei Liu, Shinichi Muto, Chia Yin Kuo, Su Pei Ling, Hsiang Chuan Chang (2026). Tracing Human Movement Through Mobile Signaling Big Data: New Possibilities for Mobility Analysis. In: Advances in Human Factors of Transportation. AHFE Open Access, vol. 224, pp. 458–466. https://doi.org/10.54941/ahfe1007874
Mobile signaling data provides extensive population coverage and high temporal resolution for large-scale mobility analysis, but privacy regulations have restricted access to individual trajectories, resulting in anonymized grid-based datasets. Although such data lack continuous movement paths and contain aggregation noise, they still capture meaningful collective mobility patterns. This study applies DBSCAN to identify dense spatial clusters and activity cores, followed by Random Forest analysis to assess the influence of spatial and contextual factors. Results show that blurred grid-based signaling data reveals stable spatial aggregations, temporal rhythms, and shifts in movement intensity. Rather than replacing trajectory-based data, this approach complements conventional mobility datasets by offering population-level insights into large-scale movement dynamics and regional mobility structures.
Traditional transportation studies rely mainly on household surveys, traffic counts, and on-site questionnaires to understand mobility behavior. While these approaches capture individual preferences, they are often costly, time- consuming, and limited in temporal and spatial coverage, making it difficult to observe dynamic population movements, particularly during peak periods or special events in tourist areas. In addition, their reliance on self-reported or episodic observations further constrains the ability to monitor continuous mobility dynamics. In recent years, mobile phone signaling data has emerged as an important alternative due to its wide population coverage and continuous temporal resolution. The deployment of 5G networks has further enhanced data timeliness and stability, enabling near real-time observation of large- scale mobility patterns. In response to increasing concerns over personal privacy and data security, mobility data provision has gradually shifted from individual-level trajectory records toward anonymized and aggregated grid-based flow data. Compared with conventional survey data, signaling data can automatically capture trip timing, movement directions, stay behaviors, and interregional flows beyond administrative boundaries. These
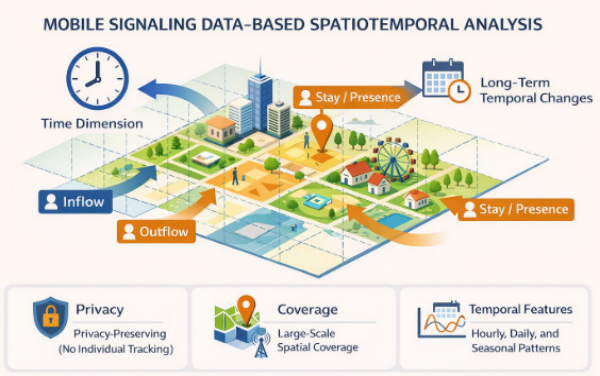
Tracing Human Movement Through Mobile Signaling Big Data: New Possibilities 459 advantages make mobile signaling data a valuable complementary source for transportation planning, tourism management, and crowd monitoring. A schematic illustration of the grid-based signaling data structure is provided in Figure 1.
Figure 1: Conceptual illustration of mobile signaling data.
RESEARCH OBJECTIVES The primary objective of this study is to utilize grid-based mobile phone signaling data provided by telecommunications operators to analyze trip distributions and population movement patterns under different temporal and contextual conditions. By leveraging anonymized and aggregated signaling data, this research aims to explore the applicability and analytical potential of emerging big data sources in transportation and mobility planning. With the widespread adoption of smartphones and the maturation of 5G communication technologies, mobile signaling data offers high population coverage, temporal continuity, and large sample sizes, effectively addressing the limitations of traditional household surveys and on-site investigations in terms of timeliness, scale, and cost. This study further applies spatiotemporal clustering, pattern classification, and machine learning techniques to identify regions with distinct trip characteristics and mobility behavior patterns. Based on these results, the study seeks to examine the key spatial and contextual factors influencing observed mobility structures, thereby enhancing the understanding of collective movement dynamics and supporting data-driven transportation planning applications.
LITERATURE REVIEW
In the existing literature, research on mobile phone signaling data has largely focused on the reconstruction of O–D (Origin–Destination) trajectories and the evaluation of methodological accuracy. Many studies emphasize
developing algorithms to infer individual travel paths or activity locations and validating inferred O–D flows by comparing signaling-based results with traditional survey data, census records, or traffic counts. Alexander et al. (2015) reconstructed individual O–D flows using time-stamped CDR data through preprocessing steps including noise removal, stay-point detection, location clustering, and activity classification (home, work, and others). By integrating household travel surveys and census data, their results closely matched official commuting flows and traffic counts, highlighting the importance of data cleaning and activity inference. However, the study primarily focused on commuting structures, with limited behavioral differentiation across activity types.
Similarly, Hung (2017) used base-station data to supplement traditional surveys and estimate regional travel distributions in Taipei, though limited spatial resolution constrained activity-type identification and practical applications. To improve automation and timeliness, Zhang et al. (2013) proposed an automated O–D framework using signaling data, while Li et al. (2014) developed a three-stage spatial interaction model based on frequent pattern mining; both studies emphasized methodological development but provided limited behavioral or policy interpretation. With advances in deep learning, Jiang et al. (2022) combined Bi-LSTM and improved HAC algorithms to enhance activity location identification, especially for non- commuting trips, though model generalizability remains constrained by labeled data requirements.
Overall, existing studies demonstrate the effectiveness of mobile phone signaling data in reconstructing O–D flows and identifying activity locations, particularly through advances in preprocessing techniques and algorithmic development. However, the literature has largely emphasized individual-level trajectory inference and methodological accuracy, with comparatively less focus on aggregated mobility patterns and their implications for large-scale transportation and mobility analysis.
DATA DESCRIPTION The data used in this study consist of CVP (Cell-based Vehicle Probe) mobile phone signaling data provided by FarEasTone Telecom, Taiwan. All records are anonymized and released in an aggregated, grid-based format to ensure personal privacy protection. This study focuses on an activity day at a major tourist destination in Taiwan (September 15, 2024). Trip records were collected within a 30-kilometer radius centered on the study area.
The available variables include trip date, hour of trip occurrence (24-hour format), home county/city, origin and destination county/city and village, longitude and latitude coordinates of origin and destination grid centroids, and trip purpose. Trip purposes are classified into three categories: Home- Based Other (HBO) trips, representing non-work-related trips to or from home; Home-Based Work (HBW) trips, representing commuting activities; and Non-Home-Based (NHB) trips, in which neither the origin nor the destination is home, such as movements between tourist attractions. This
Tracing Human Movement Through Mobile Signaling Big Data: New Possibilities 461 variable facilitates the differentiation of travel motivations among tourists, residents, and commuters. Spatial aggregation is based on a grid size of 250 × 250 meters. As FarEasTone Telecom accounts for approximately one-third of Taiwan’s mobile market share, expansion factors derived from data from Taiwan’s Ministry of the Interior were applied to scale trip volumes. After preprocessing and adjustment, a total of 388,669 trip records were obtained for analysis.
RESEARCH METHODOLOGY This study employs an integrated analytical framework combining DBSCAN clustering and Random Forest analysis to examine collective mobility patterns derived from grid-based mobile phone signaling data. Given the aggregated, high-dimensional, and noisy characteristics of signaling data, the framework is designed to first identify latent spatial mobility structures and subsequently interpret the factors driving these patterns.
DBSCAN (Density-Based Spatial Clustering of Applications with Noise) is applied to detect dense spatial clusters and activity cores based on grid-level mobility characteristics. As a density-based unsupervised learning algorithm, DBSCAN identifies clusters through local density connectivity without requiring prior specification of cluster numbers, while simultaneously distinguishing noise points. This property makes DBSCAN particularly suitable for mobility data with irregular spatial distributions and heterogeneous density patterns, such as those observed in tourist areas and event days.
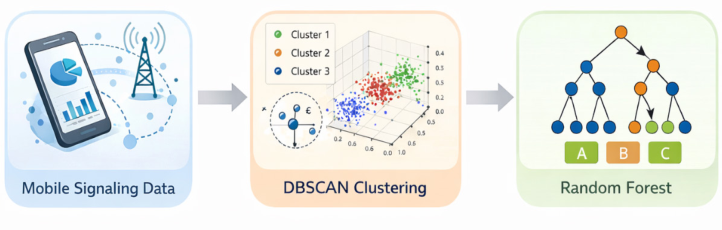
To enhance interpretability, Random Forest is subsequently used to analyze the determinants of the identified mobility clusters. The cluster labels generated by DBSCAN serve as target variables, while spatial, temporal, and trip-related attributes from the signaling data are used as explanatory variables. Through ensemble decision trees and variable importance measures, Random Forest identifies key factors associated with different mobility patterns, enabling a clearer understanding of population-level movement behaviors. The overall analytical workflow is illustrated in Figure 2.
Figure 2: Workflow of mobile signaling data analysis.
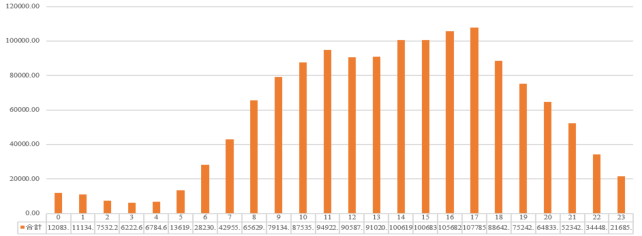
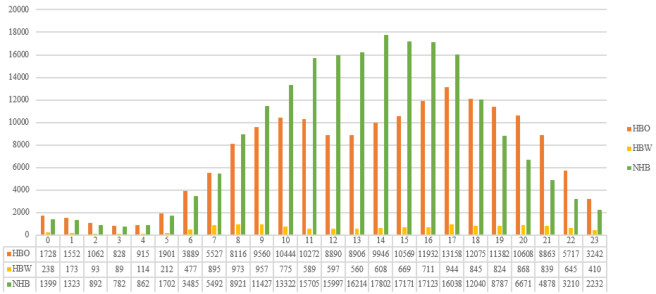
BASIC ANALYSIS On September 15, the weighted total number of trips reached 1,389,360, showing clear temporal variation throughout the day (Figure 3). Trip volumes remained below 10,000 during the early morning hours (00:00–05:00), increased rapidly after 06:00, and peaked at 107,785 trips at 17:00, representing the highest hourly demand of the day and exceeding both weekday and holiday peak levels. Following the event, trip volumes declined sharply between 18:00 and 20:00. Trip purpose distributions further highlight event-driven mobility patterns (Figure 4). Non-Home-Based (NHB) trips dominated across most time periods, particularly during activity-intensive hours, acounted for over 54% of total trips during 10:00–12:00 and remained above 57% during the afternoon peak (14:00–17:00). Home-Based Other (HBO) trips reflected frequent local movements, while Home-Based Work (HBW) trips consistently represented only a small share (2%–7%), indicating that travel demand on the event day was primarily driven by leisure and activity participation rather than work- related purposes.
The signaling data also enable the extraction of origin–destination grid patterns and home-grid origins across different time periods. This allows temporal comparison of spatial movement structures and the identification of shifts in trip origins and destinations throughout the day.
Figure 3: Number of trips by time period.Figure 4: Comparison of trip purposes.
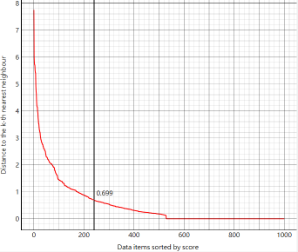
RESULTS OF DBSCAN AND RANDOM FOREST A random sample of 50,000 trips was selected for DBSCAN clustering to examine differences in spatial trip structures under event conditions. Prior to clustering, K-distance plots were used to identify a plausible range for the ε (epsilon) parameter, followed by iterative sensitivity tests to determine an optimal balance between cluster separability and noise reduction. Rather than selecting ε from a single elbow point, values were gradually adjusted within the elbow interval to ensure robust clustering outcomes. For all three study days, minPts was fixed at 10 to prevent the formation of trivial clusters driven by isolated or drifting points.
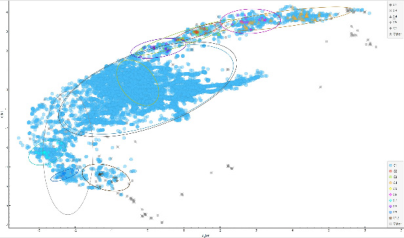
On the event day of September 15, the K-distance curve indicated an elbow around 0.70 (Figure 5). Accordingly, ε values between 0.65 and 0.70 were repeatedly tested. The final parameter setting produced 13 major clusters (Figure 6), revealing a highly concentrated spatial structure. This pattern suggests that trip origins were strongly centralized during the event, likely reflecting the convergence of participants and visitors around the main activity core and surrounding viewing areas. Although some scattered points remained, they were largely classified as noise, indicating that the selected DBSCAN parameters effectively captured meaningful spatial clusters while filtering anomalous trips.
Figure 5: k-Distance plot.Figure 6: Illustration of DBSCAN clustering.
Following DBSCAN clustering, Random Forest was applied as a post hoc analysis to enhance the interpretability of clustering results. While DBSCAN effectively identifies spatial density-based clusters and distinguishes core and noise points, it does not explain the factors driving cluster formation. Therefore, Random Forest was introduced to evaluate the relative importance of spatial and behavioral variables associated with DBSCAN-derived clusters and to clarify the spatial and behavioral characteristics of trips on the event day.
Using September 15 as an example, feature importance results from Random Forest (Table 1) show consistent patterns across gain ratio and Gini measures. The clustering structure was primarily driven by spatial factors rather than temporal or behavioral attributes. Origin and destination administrative areaswere the most influential variables, indicating that clusters largely reflect regional concentration at the administrative level. Home administrative areaalso ranked highly, suggesting that trip patterns on the event day were constrained by residential location. Geographic coordinates (od_lat, od_lon) provided secondary explanatory power, mainly refining cluster boundaries within administrative regions. In contrast, behavioral variables, including trip purpose, trip hour, and trip volume (amp_imsi_cnt_ impute), exhibited minimal importance. These findings suggest that mobility patterns during the swimming event were dominated by spatial attraction to the activity area rather than differences in travel behavior or timing.
Table 1: Results of the random forest model.
Table available in the original PDF paper.
Rank Feature Gain Ratio Gini Random Forest 1 DBSCAN Core 0.135 0.000 0.036
DBSCAN was first applied to identify spatially coherent trip clusters on the event day. A subsequent Random Forest analysis was then conducted as a post hoc interpretation step, confirming that cluster formation was primarily driven by spatial attributes, including origin, destination, and home location, rather than temporal or behavioral factors. This two-stage approach indicates that the identified clusters fundamentally reflect differences in spatial mobility structures.
Based on these findings, cluster-level characteristics were further summarized to capture the overall mobility tendencies of each group. By aggregating temporal indicators, trip purposes, and origin–destination patterns, the dominant behavioral and spatial features of individual clusters can be preliminarily identified, as presented in Table 2.
This study demonstrates the analytical potential of grid-based mobile phone signaling data for capturing large-scale mobility patterns and collective movement dynamics. Despite the absence of individual-level trajectories, anonymized and aggregated signaling data retain stable and interpretable spatiotemporal signals, enabling the identification of activity cores, spatial concentration, and temporal variations in travel demand. By integrating DBSCAN clustering with Random Forest analysis, this study shows that grid-based signaling data are particularly effective in revealing population- level mobility structures driven primarily by spatial characteristics, making them well suited for applications such as event traffic management, tourism monitoring, and transportation planning.
At the same time, several limitations should be acknowledged. Due to privacy-preserving aggregation and grid-based representation, signaling data do not allow for the reconstruction of continuous individual travel trajectories or detailed trip chains. As a result, fine-grained behavioral analyses—such as route choice, activity sequencing, or individual decision-making processes— remain beyond the scope of this data source. Consequently, grid-based signaling data should not be regarded as a substitute for trajectory-based datasets, but rather as a complementary resource that excels in capturing macro-level mobility trends and regional movement structures. Notably, this study also obtained spatial information at a finer administrative scale,
such as village-level units, which provides opportunities for future research to conduct more detailed multi-scale analyses under appropriate privacy protection frameworks.
Overall, under increasingly stringent privacy regulations, grid-based mobile signaling data offer a practical and representative foundation for mobility research. Future studies that integrate signaling data with surveys, ticketing records, or other high-resolution data sources may further enhance behavioral interpretation and support more comprehensive transportation and urban mobility analyses.
ACKNOWLEDGMENT
This study gratefully acknowledges the support and data provision from FarEasTone Telecom, Taiwan, for providing the mobile phone signaling data used in this study. The authors also thank Tamkang University for its academic support and research environment. In addition, this research benefited from resources and support provided by the National Science and Technology Council (NSTC) of Taiwan. The authors sincerely appreciate all institutions for their assistance, which made this study possible.
REFERENCES
Alexander, L., Jiang, S., Murga, M., & González, M. C. (2015). Origin–destination trips by purpose and time of day inferred from mobile phone data. Transportation Research Part C: Emerging Technologies, 58, 240–250. Hung, T. (2017). Estimating OD matrices based on cellular data (1st ed., Vol. 1,
pp. 6–55). Jiang, H., Yang, F., Su, W., Yao, Z., & Dai, Z. (2022). Activity location recognition from mobile phone data using improved HAC and Bi-LSTM. IET Intelligent Transport Systems, 16, 1364–1379. Li, W., Cheng, X., Duan, Z., Yang, D., & Guo, G. (2014). A framework for spatial
interaction analysis based on large-scale mobile phone data. Computational Intelligence and Neuroscience, 2014, Article 712581, 1–11. Zhang, Y., Smoreda, Z., & González, M. C. (2013). Extracting origin-destination trips from mobile phone data. IEEE Pervasive Computing, 12(5), 36–44.
LISTED IN THE AHFE DIGITAL BOOKSTORE CATALOGUE
Explore the complete digital volume
Advances in Human Factors of Transportation
Read this individual research paper free through the original publisher, or explore the full digital proceedings book.
ISBN 979-8-950676-00-0
Explore this ISBN in the AHFE Bookstore ↗Listed in the July 2026 bookstore catalogue; search by ISBN to confirm current availability · Digital book purchase optional