This study demonstrates that mobile signaling data can effectively complement traditional tourism data by capturing real-time, high-resolution patterns of visitor movement. The results show clear differences in mobility structures across weekdays, weekends, and peak tourism periods, with stronger visitor clustering around major attractions and transport hubs during weekends and holidays. While signaling data cannot reveal travel motivations or expenditures, it provides a comprehensive view of spatial distribution and congestion dynamics. As a supplementary data source, mobile signaling data offers strong potential for supporting crowd management, transportation planning, and sustainable tourism strategies in Taiwan.
Tourism destinations often experience uneven visitor distribution and temporal fluctuations, resulting in congestion during peak periods. Understanding tourism mobility patterns is therefore essential for effective destination management and transportation planning. Sun Moon Lake is one of Taiwan’s most prominent scenic areas and attracts large visitor flows throughout the year. As shown in Figure 1, tourism activities under normal conditions are relatively dispersed, while during holidays or major events, visitor density increases sharply, leading to crowding and congestion (Figure 2). These fluctuations place significant pressure on local transportation systems and surrounding communities. Traditional tourism data sources have limited ability to capture such dynamic and cross-regional movement patterns, particularly at fine temporal scales. Mobile signaling data provides aggregated, large-scale observations of visitor presence and movement without relying on voluntary reporting. This allows tourism mobility to be analyzed continuously across different time periods and spatial extents. By capturing overall movement trends rather than individual trajectories, signaling data is especially suitable for regional-scale tourism analysis. This study applies mobile signaling data to examine the spatial distribution and inter-regional mobility patterns of tourists at Sun Moon Lake across weekdays, weekends, and event periods. The findings aim to demonstrate the Received February 6, 2026; Revised April 5, 2026; Accepted April 24, 2026; Available online July 20, 2026
Applying Mobile Signaling Data to Tourist Mobility Analysis 353 value of signaling data for understanding tourism dynamics and supporting evidence-based destination management in high-demand scenic areas.
Figure 1: View of the sun moon lake.Figure 2: Event-related crowd congestion.
RESEARCH OBJECTIVES This study aims to explore the potential of grid-based mobile signaling data as a new form of big data for tourism and transportation planning. By leveraging its high coverage and continuous observation characteristics, the research seeks to provide an alternative perspective to conventional survey- based tourism data. Specifically, this study utilizes spatial visualization and data processing techniques to reveal temporal and spatial variations in tourist trip distribution and movement patterns across different tourism contexts. Through a destination-based case study of the Sun Moon Lake area, the research evaluates how signaling data can support regional tourism mobility monitoring, congestion awareness, and visitor flow management. Overall, the objective is to demonstrate how mobile signaling data, when combined with visualization and analytical approaches, can offer practical
and data-driven insights for tourism planning and decision-making, while also identifying its limitations for future applications.
LITERATURE REVIEW
With advances in mobile communication technologies and big data analytics, mobile signaling data has become an important source for analyzing travel behavior and population mobility in transportation and tourism research. This study reviews prior literature that applies mobile signaling data to traffic monitoring, public transport analysis, and tourism flow studies, highlighting its analytical value across different spatial and application contexts.
Early studies primarily focused on traffic flow and travel time estimation. Bar-Gera (2007) demonstrated that mobile network data could effectively measure highway speeds and travel times, while also identifying limitations related to signal interference and positioning accuracy. In public transport research, Aguilera et al. (2014) used GSM data to track passenger movements in the Paris metro system, confirming the feasibility of mobile signaling data for flow analysis even in underground environments. Subsequent studies expanded toward activity pattern visualization and behavioral interpretation. Phithakkitnukoon et al. (2010) developed an Activity-Aware Map using Call Detail Records (CDR) to visualize daily urban mobility patterns, illustrating the potential of mobile data for representing human activity structures. More recent research adopted macro-scale and grid-based frameworks. Wang et al. (2019) applied a 50 × 50 m grid system to analyze regional mobility patterns and congestion hotspots in Hualien County, while Lu et al. (2021) developed a mobile signaling–based tourism flow forecasting model with an average MAPE of approximately 20%.
Overall, existing studies confirm the effectiveness of mobile signaling data for large-scale mobility and tourism flow analysis. Nevertheless, there remains a need for research that integrates data processing and visualization approaches to better support destination-level tourism planning and transportation decision-making.
DATA DESCRIPTION This study utilizes grid-based mobile signaling data (Cellular-based Vehicle Probe, CVP) provided by FarEasTone Telecom, Taiwan, covering all trips within a 30 km radius centered on Sun Moon Lake. To capture different tourism contexts, the analysis focuses on three representative dates in 2024 with distinct mobility characteristics: September 4 (weekday), reflecting routine travel patterns such as commuting and daily activities; September 15 (event day), corresponding to the Sun Moon Lake Swimming Carnival and characterized by exceptionally high visitor inflows and peak-period congestion; and September 29 (weekend), representing typical leisure-oriented tourism demand. Across these three dates, the dataset comprises a total of 1,010,371 trips, including 276,474 trips on the weekday, 388,669 trips on the event day, and 345,231 trips on the weekend. Trip purposes are classified into three categories: Home-Based Other (HBO) trips, representing
Applying Mobile Signaling Data to Tourist Mobility Analysis 355 non-work-related trips to or from home; Home-Based Work (HBW) trips, representing commuting activities; and Non-Home-Based (NHB) trips, in which neither the origin nor the destination is home, such as movements between tourist attractions. All records are processed using a consistent 250 × 250 m spatial grid and a 15-minute stay-time threshold, enabling direct temporal and spatial comparisons across different tourism conditions.
RESEARCH METHODOLOGY This study adopts an integrated framework combining GIS-based spatial analysis, DBSCAN clustering, Random Forest interpretation, and comparative analysis to examine collective mobility patterns derived from grid-based mobile phone signaling data. QGIS is first used for spatial preprocessing, visualization, and exploratory analysis. Signaling data are projected into a unified coordinate system and aggregated into consistent grids. Spatial distributions of trip origins, destinations, and O–D flows are visualized using heat maps and flow lines to examine spatial concentration and temporal variation across different periods and activity contexts. Next, DBSCAN (Density-Based Spatial Clustering of Applications with Noise) is applied to identify dense spatial clusters and activity cores without predefined cluster numbers, allowing the detection of irregular and heterogeneous mobility structures. To enhance interpretability, Random Forest is subsequently employed as a post hoc analysis, using DBSCAN-derived cluster labels as target variables and spatial, temporal, and trip-related attributes as explanatory variables. Feature importance measures are used to identify key factors driving cluster formation.
Finally, comparative analysis is conducted across different time periods and activity conditions to evaluate variations in spatial structures and mobility patterns. This integrated approach enables a concise yet comprehensive assessment of population-level mobility dynamics from both spatial and temporal perspectives.
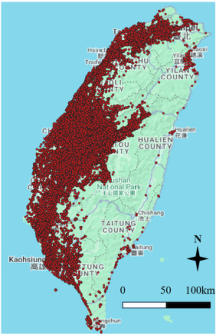
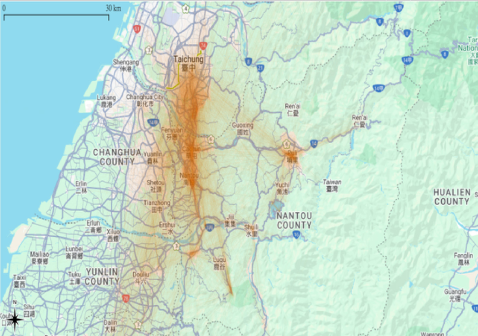
Visualization Using QGIS To visually explore the spatial distribution of tourism trips, the mobile signaling data were imported into QGIS and overlaid on Google Maps basemaps. The visualization reveals that tourism-related trips associated with the Sun Moon Lake area are distributed across the entire island of Taiwan, indicating that visitors originate from a wide range of regions rather than from nearby areas only (Figure 3). This nationwide dispersion highlights the cross-regional nature of tourism mobility and the importance of analyzing visitor flows beyond the immediate destination area. To present these movement patterns more intuitively, origin–destination (OD) weighted link visualization was further applied (Figure 4). By connecting origins and destinations with line segments weighted by trip volume, this approach effectively illustrates the intensity and spatial structure of tourism flows toward and around the study area. While this visualization does not capture detailed route choices or modes of transportation, it provides a clear representation of aggregate OD
patterns, major source regions, and the temporal distribution of trips based on hourly intervals.
At an aggregate level, the QGIS-based visualization framework enables a straightforward interpretation of large-scale tourism mobility trends, supporting the identification of dominant travel corridors, high-contribution origin areas, and peak travel periods. These insights are particularly valuable for understanding regional tourism dynamics and informing destination- level transportation and visitor management strategies.
Figure 3: Trips distribution.Figure 4: OD flow visualization.
BASIC ANALYSIS A comparison of the three observation days shows clear differences in total trip volumes and travel characteristics. The event day (September 15) recorded the highest weighted total trips at 1,389,360 trips, substantially exceeding those on the regular weekend (September 29, 1,245,196 trips)
Applying Mobile Signaling Data to Tourist Mobility Analysis 357 and the weekday (September 4, 1,002,889 trips), highlighting the strong amplification effect of large-scale events on regional travel demand. In terms of temporal distribution, the event day exhibited a rapid increase in trips during the afternoon, reaching a daily peak at 17:00 with 107,785 trips, which is approximately 14% higher than the weekday peak and 12% higher than the weekend peak, indicating a highly concentrated event-driven travel pattern. By contrast, the weekday displayed a typical commuting structure with distinct morning and evening peaks at 07:00 and 17:00, with the evening peak reaching 94,170 trips. The weekend showed no pronounced morning peak; instead, trip volumes remained high between 10:00 and 16:00, peaking at 16:00 with 95,624 trips, reflecting a more sustained leisure-oriented travel pattern. Regarding trip purposes, non-home-based (NHB) and home–other (HBO) trips dominated on the event day and weekend, whereas home– work-based (HBW) trips accounted for a higher share on the weekday. Overall, mobile signaling data effectively capture variations in travel volume, temporal dynamics, and trip purpose structure, enabling rapid identification of tourism destination characteristics across different time periods and supporting tourism and transportation management decisions.
RESULTS OF DBSCAN AND RANDOM FOREST To compare spatial clustering patterns under different travel contexts, this study randomly sampled 50,000 trips from each of the three dates September 4 (weekday), September 15 (event day), and September 29 (weekend) and applied DBSCAN clustering analysis. For consistency across all cases, the minPts was set to 10. The results show clear differences in clustering structures across the three days. On the event day, using an ε value of approximately 0.65–0.70, DBSCAN identified 13 major clusters, indicating highly concentrated and well-defined travel aggregation. In contrast, the weekday exhibited a more dispersed spatial pattern, with clustering achieved at a smaller ε value of approximately 0.13, resulting in 12 clusters that reflect a multi-centered, commuting-oriented mobility structure. The weekend displayed an intermediate pattern; with ε set at approximately 0.65, DBSCAN also identified 12 clusters, suggesting moderate aggregation associated with leisure travel while remaining less concentrated than the event day. Overall, the comparison demonstrates that DBSCAN effectively captures variations in spatial density and clustering characteristics across different travel contexts.
The Random Forest results across the three days reveals clear differences in the key factors associated with spatial clustering outcomes (Table 1). On the event day (September 15), DBSCAN Core emerges as the most important feature, indicating that cluster membership is primarily driven by dense, event-centered spatial aggregation, while origin and destination administrative attributes (e.g., o_c_name and d_c_name) play secondary roles. In contrast, the weekday (September 4) shows a markedly different pattern, with spatial coordinates (origin and destination longitude and latitude) dominating feature importance. This suggests that weekday clustering is largely influenced by fine-scale spatial dispersion and commuting-oriented movements rather than strong activity cores.
For the weekend (September 29), the results lie between these two extremes. DBSCAN Core again ranks as the most influential feature, similar to the event day, but with lower overall importance values, indicating moderate clustering intensity. Administrative location attributes remain relevant, while pure coordinate-based variables play a less dominant role than on weekdays. In comparative terms, the Random Forest analysis highlights that clustering on event days and weekends is mainly shaped by activity-driven spatial concentration, whereas weekday clustering reflects more dispersed, location- sensitive mobility patterns.
Table 1: Results of the random forest model.
Table available in the original PDF paper.
Date Rank Feature Gain Ratio Gini Random Forest 9/15 1 DBSCAN Core 0.135 0.000 0.036 2 o_c_name 0.018 N/A 0.029
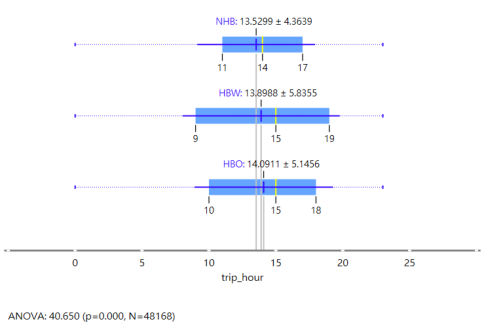
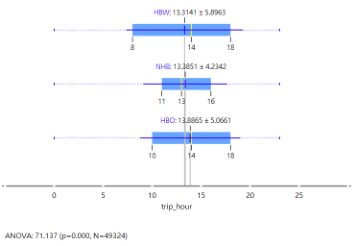
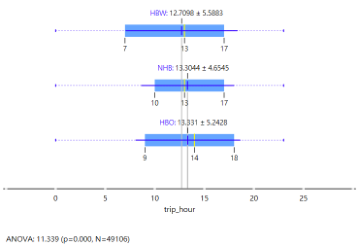
After performing spatial clustering using DBSCAN and subsequently applying a Random Forest model to confirm that the clustering results are primarily driven by spatial characteristics, this study further examines the relationship between trip timing and trip purposes within the dominant C1 cluster across the three observation days. A comparison of the C1 cluster results shows that, although C1 consistently accounts for more than 90% of sampled trips on all three days 97.31% on the event day (September 15, Figure 5), 98.15% on the weekday (September 4, Figure 6), and 98.65% on the weekend (September 29, Figure 7) indicating a highly stable core travel structure, notable differences in temporal behavior and trip purposes still emerge across different contexts. In terms of average departure time, trips on all three days are primarily concentrated in the afternoon. On the weekday, the average departure times for different trip purposes are relatively close (HBW: 12.71, NHB: 13.30, HBO: 13.33), reflecting a highly regular daily travel pattern. On the event day, the overall temporal structure shifts slightly later (NHB: 13.53, HBW: 13.90, HBO: 14.09), suggesting a delaying effect associated with large-scale activities. On the weekend, non-work trips (HBO) exhibit the latest average departure time (13.89), indicating that leisure and tourism activities tend to concentrate in the afternoon to early evening period.
Regarding temporal dispersion, commuting-related trips (HBW) consistently show the highest standard deviation across all three days (±5.59–±5.90), making them the primary source of intra-day travel variability, whereas NHB
Applying Mobile Signaling Data to Tourist Mobility Analysis 359 trips are the most temporally concentrated (±4.23–±4.65). These differences are further supported by ANOVA results, with F-values of 11.339 on the weekday, 40.650 on the event day, and 71.137 on the weekend (all p < 0.001), indicating that as travel contexts become more leisure-oriented, temporal differentiation among trip purposes becomes increasingly pronounced. Overall, even within a highly stable dominant cluster, mobile signaling data effectively reveal fine-grained temporal variations in travel behavior across different dates, underscoring its analytical value for understanding tourism- related mobility characteristics.
Figure 5: 9/15 boxplots of trip purposes by time.Figure 6: 9/4 boxplots.Figure 7: 9/29 boxplots.
CONCLUSION
This study shows how grid-based mobile signaling data can be systematically utilized to examine tourism-related mobility patterns and overall travel characteristics in scenic areas. By combining spatial visualization, DBSCAN- based clustering, and Random Forest interpretation, the proposed framework captures both the dominant spatial structures of tourism flows and the internal temporal and behavioral variations under different travel contexts, including weekdays, weekends, and large-scale event days. The results indicate that although a highly stable core travel structure exists across all observation days, notable differences emerge in trip timing and trip purposes depending on activity intensity and tourism demand conditions.
The empirical findings further demonstrate that mobile signaling data are particularly effective for revealing aggregate-level mobility trends, such as peak travel periods, activity-driven spatial concentration, and cross-regional visitor flows, which are often difficult to capture using traditional survey- based tourism data. Even within the dominant cluster, fine-grained temporal differentiation among commuting, leisure, and non-home-based trips can be identified, highlighting the analytical strength of signaling data in uncovering subtle behavioral dynamics at the population level.
While the present study focuses on regional-scale analysis to ensure robustness and interpretability, future research may extend this approach to finer spatial resolutions, such as districts, neighborhoods, or village-level units, to better understand localized congestion mechanisms and destination- specific travel behavior. Moreover, the integration of additional data sources—such as smart card ticketing records, parking data, or CCTV-based traffic observations—could further enhance behavioral interpretation and validation when combined with mobile signaling grids. Overall, this study confirms the potential of mobile signaling data as a scalable, complementary data source for tourism mobility analysis and provides methodological insights that can support data-driven transportation planning and sustainable destination management.
ACKNOWLEDGMENT
This study gratefully acknowledges the support and data provision from FarEasTone Telecom, Taiwan, for providing the mobile phone signaling data used in this study. The authors also thank Tamkang University for its academic support and research environment. In addition, this research benefited from resources and support provided by the National Science and Technology Council (NSTC) of Taiwan. The authors sincerely appreciate all institutions for their assistance, which made this study possible.
REFERENCES
Aguilera, V., Allio, S., Benezech, V., Combes, F., & Milion, C. (2014). Using cell phone data to measure quality of service and passenger flows of Paris transit system. Transportation Research Part C: Emerging Technologies, 43, 198–211.
Applying Mobile Signaling Data to Tourist Mobility Analysis 361 Bar-Gera, H. (2007). Evaluation of a cellular phone-based system for measurements
of traffic speeds and travel times: A case study from Israel. Transportation Research Part C: Emerging Technologies, 15(6), 380–391. Lu, C.-C., Liang, J.-K., Cyu, P., Wang, J.-Y., Wu, T.-L., & Chen, S.-J. (2021). Applying cellular-based vehicle probe data to predict number of visitors at attractions. Transportation Planning Journal, 50(2), 145–176. Phithakkitnukoon, S., Horanont, T., Di Lorenzo, G., Shibasaki, R., & Ratti, C.
(2010). Activity-aware map: Identifying human daily activity patterns using mobile phone data. In A. A. Salah, T. Gevers, N. Sebe, & A. Vinciarelli (Eds.), Human behavior understanding (pp. 14–25). Wang, J.-Y., Lu, C.-C., Li, C.-H., Chen, C.-H., Wu, T.-L., & Chen, S.-J. (2019).
Improving public transportation services for tourists by mining cellular-based vehicle probe data: A case study of Taiwan tourist shuttle in Hualien County. Transportation Planning Journal, 48(2), 105–132.
Read this individual research paper free through the original publisher, or explore the full digital proceedings book.
ISBN 979-8-950676-09-3
Explore this ISBN in the AHFE Bookstore ↗Listed in the July 2026 bookstore catalogue; search by ISBN to confirm current availability · Digital book purchase optional