Matthias Beggiato, Cornelia Hollander, Maximilian Hentschel, Angelika C. Bullinger, Georg Jahn (2026). Long-term One-year Stability of Discomfort Perception in Automated Driving and Personal Influencing Factors. In: Human Systems Engineering and Design (IHSED2026): Future Trends and Applications. AHFE Open Access, vol. 237, pp. 65–74. https://doi.org/10.54941/ahfe1008146
Comfort is considered one of the key factors for broad public acceptance of automated driving. New comfort aspects such as familiarity with driving manoeuvres, feelings of control, and apparent safety require user-centred design approaches to ensure usage and prevent disengagement or unnecessary take-overs. One research question in this area concerns the circumstances of comfort/discomfort perception such as stability over time and individual characteristics. The present research assessed the stability of perceived discomfort in automated driving after one year as well as influencing personal factors. A total of 28 participants (15 female, 13 male), aged between 20 and 72 years, took part in two driving simulator studies with a one-year break between them. On both dates, each participant experienced two automated drives including different potentially uncomfortable driving scenarios. During all drives, a handset controller allowed to report perceived discomfort continuously and gradually from 0 to 100 by pressing the lever. Correlation analyses were performed on the mean handset values for each entire drive. The results showed high correlations between ρ = .624 and ρ = .823 over time. Summarizing the influence of personal factors, young women with a more defensive driving style, less Affinity for Technology as well as less initial trust and acceptance of automation report more discomfort, with initial trust as most important factor. Overall, discomfort perception appears to be rather stable over time. Given the strong individual and dynamic nature, selectable driving style profiles and/or discomfort-adaptive real-time systems are recommended to achieve a human-centred design solution.
Comfort is considered one of the key factors in achieving broad public acceptance of automated driving (ERTRAC, 2022). New aspects of comfort arising in automated mode such as familiarity with driving maneuvers, feelings of control, and perceived safety require user-centered design approaches to ensure usage and prevent disengagement or unnecessary Received April 17, 2026; Revised June 28, 2026; Accepted July 19, 2026; Available online September 25, 2026
take-overs. A comfortable driving experience is considered a prerequisite for the acceptance and usage of automated vehicles, linked to realizing new opportunities during driving such as entertainment, relaxation, and work (Bellem et al., 2018).
Although there is no common definition of comfort in the context of driving, it can be described as a feeling of well-being associated with positive experiences and the absence of negative experiences (discomfort) such as fatigue, anxiety, stress, and fear (Peng et al., 2024). Existing comfort definitions see it as (1) the result from an interaction with the environment; (2) influenced by physical, physiological, and psychological factors; and (3) a subjective construct that therefore varies between individuals (Beggiato et al., 2019). Given the subjective and dynamic nature of comfort/discomfort, key questions arise regarding which personal factors may influence the perception, how stable it is over time, and which automated driving situations elicit more or less discomfort.
Regarding potentially uncomfortable driving situations, previous research identified (1) infrastructure-related discomfort factors such as complex situations at intersections, roundabouts, entry/exit points, or construction zones; (2) unpredictable behavior of other road users such as pedestrians, cyclists or larger vehicles; and (3) external factors, such as adverse weather conditions, darkness, icy roads, traffic jams, or obstacles on the road (Beggiato et al., 2019). In addition, discomfort in automated driving mode can also be caused by uncertainty regarding the automation’s ability to perceive a specific situation and communicate subsequent maneuvers (Beggiato et al., 2015), such as detecting and braking at a stop sign or a red traffic light. These findings formed the basis for the potentially uncomfortable driving scenarios in this study (see Method section) with a dedicated focus on urban environments. As urban environments pose much higher demands in terms of driving complexity, the German research initiative STADT:up (https://www. stadtup-online.de/) is explicitly aimed at developing continuous automated driving solutions for urban areas.
Regarding the subjective nature of discomfort perception, previous results confirm that the perception indeed differs between individuals (Dettmann et al., 2021) and that identical situations lead to very different emotional and behavioral reactions (Beggiato et al., 2024). Thus, continuous and gradual assessment methods for discomfort are recommended for studies, such as the handset controller used in this and previous research (Beggiato et al., 2020; 2019; Dettmann et al., 2021). For real-time systems, continuous comfort monitoring is indicated to ensure a positive and comfortable automated driving experience, e.g. by dynamically adapting the automated driving style and/or information presentation (Beggiato et al., 2022). Additionally, research questions arise concerning which personal factors may influence discomfort perception and how stable this perception remains over longer time periods. Long-term studies are explicitly identified as a research need in the field of user comfort in automated driving (Peng et al., 2024). To address these gaps, the present research investigated the stability of perceived discomfort in automated driving after one year as well as personal factors influencing this perception.
METHOD
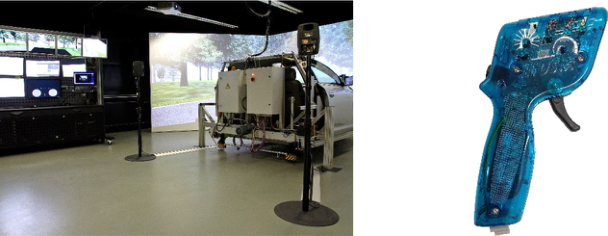
Study Design The two studies were conducted in a fixed-base driving simulator (Figure 1 left) with SILAB 7.2 software, a fully equipped vehicle mock-up, a 180° horizontal field of view, and side and rear-view mirrors. All drives were conducted in fully automated mode using the automation module of the driving simulator software to ensure identical drives for each participant. Participants were informed that the vehicle would drive automatically and that the pedals and steering wheel are inoperative, with the task being to observe the automated driving maneuvers. To assess perceived discomfort, participants were instructed to gradually press the lever of a handset controller (Figure 1 right) in accordance with their level of perceived discomfort throughout the entire drive. The time span between the two studies was one year.
Figure 1: Driving simulator (left) and handset controller for discomfort assessment (right).
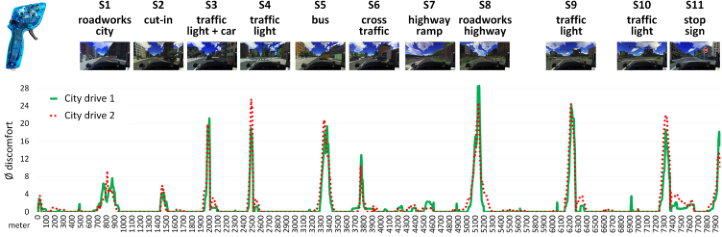
At each appointment, all participants experienced two automated drives: a 4 km long drive featuring multiple close approaches to a slower truck driving ahead (Truck drive), followed by an 8 km long City drive. The City drives were identical in both appointments and consisted of 11 potentially discomfort-inducing scenarios (see Table 1 and Figure 2 for pictures). The scenarios were constructed based on previous research (Beggiato et al., 2020; 2019). The first and last section of the road (S1-S6 and S11) consisted of a two-lane road with oncoming traffic and a speed limit of 50 km/h. Between these, there was a four-lane city highway without oncoming traffic and a speed limit of 70 km/h (S7-S10).
Table 1: Description of the 11 potentially discomfort-inducing scenarios in the city drives.
Table available in the original PDF paper.
Scenario Description S1 road works city Roadworks on the own lane with lane change to the left, oncoming traffic
S2 cut in Vehicle cutting in from the right side Approach to a red traffic light with a vehicle in front S3 traffic light with car
S4 traffic light Approach to a red traffic light without vehicle in front (Continued)
Table 1: Continued.
Table available in the original PDF paper.
Scenario Description S5 bus Overtake of a standing bus in the own lane with lane change to the left, oncoming traffic
S6 cross traffic Crossing traffic with the own right of way S7 highway ramp Entry on the city highway with merging into flowing traffic
S8 road works highway
Roadworks on the own lane with lane change to the left, traffic from behind S9 traffic light Approach to a red traffic light without vehicle in front
S10 traffic light Approach to a red traffic light without vehicle in front S11 stop sign Stop at the stop sign
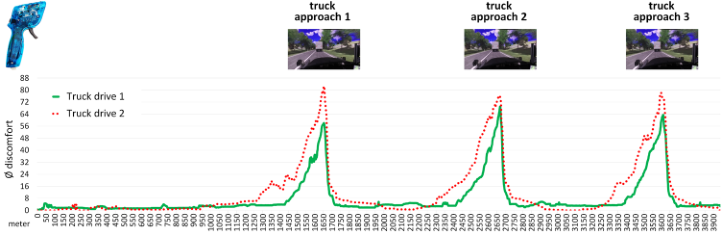
The Truck drives consisted of three identical automated approaches on a straight road to a truck driving ahead (Figure 3). The truck drove at a constant speed of 80 km/h, while the own vehicle approached at 100 km/h. In Study 1, automated braking started at a distance of 12.5 m, reaching a minimum distance of 9.2 m (minimum time to contact of 1.84 s). To elicit greater discomfort, the approach in Study 2 was changed to be closer: Thus, braking started at a shorter distance of 6 m, reaching a minimum distance of 2.7 m (minimum time to contact of 0.84 s).
Discomfort Assessment and Questionnaires Perceived discomfort was assessed during each drive using the wireless handset controller “Speedflow Triple V3.18” (Figure 1 right). This professional controller provides a frictionless trigger with adjustable spring force. The trigger position is sampled contactless and without wear using two redundant sensors. The controller enables gradual, continuous, non-invasive real-time feedback without the need to look because of the haptic feedback at the lever. This type of controller has already been used to assess discomfort in previous studies (Beggiato et al., 2020, 2019; Dettmann et al., 2021). The controller data were scaled from 0 to 100 and recorded at 60 Hz alongside all the other driving data in the driving simulator software.
Several personality traits, attitudes and demographic variables were assessed prior to the first drive. These included age, gender, kilometer driven per year, self-reported driving style, Affinity for Technology, as well as initial acceptance and trust in automation. Affinity for Technology as the tendency to actively engage in intensive technology interaction was assessed using the 9-item ATI-scale (Franke et al., 2019). Respondents indicated their agreement for each item on a 6-point Likert-scale ranging from 1 to 6, resulting in a relatively high mean score of M = 4.48 (SD = 0.77) in the sample. Self- reported driving style was assessed using a polarity profile comprising the five items slow/fast, anxious/courageous, defensive/offensive, cautious/risk- taking, and comfortable/sporty. Responses were given on a 5-point scale from 1 to 5 for each pair. The mean score across all 5 items resulted in M = 2.76 (SD = 0.61); higher values indicate a more offensive driving style. Initial trust was assessed using the single item “I would trust the driving abilities
Long-Term One-Year Stability of Discomfort Perception 69 of an automated vehicle”, and initial acceptance by the single item “I can imagine using an automated vehicle”. Both these items could be answered using a percentage scale from 0 to 100. This resulted in an initial trust level of M = 62.43 (SD = 31.49) and a mean initial acceptance level of M = 69.96 (SD = 27.34).
Participants A total of 28 participants (15 female and 13 male), aged between 20 and 72 years (M = 48 years, SD = 15.00), took part in the two driving simulator studies with a one-year break between them. All participants held a valid driving license (M = since 27 years, SD = 14.11). Annual mileage ranged from 5,000 to 70,000 km, averaging M = 16,732 km (SD = 13,040). All participants provided written informed consent in accordance with the TU Chemnitz ethics commission’s regulations and received 25 Euro for each study.
RESULTS
Figure 2 shows the mean handset controller values for all 28 participants in the first and second City drive, comprising the 11 potentially discomfort- inducing scenarios. Comparing the scenarios, the highest level of discomfort was reported at the roadworks on the city highway (S8), followed by the approaches to red traffic lights (S3, S4, S9, S10). Less discomfort was indicated for the highway ramp (S7), the cut-in situation (S2) and the roadworks in the city area (S1). The green line for drive 1 and the red dotted line for drive 2 appear very similar, indicating a high level of consistency in the discomfort ratings averaged over all participants after one year. More details on individual correlations are provided below.
Figure 2: Mean discomfort ratings city drives 1 and 2.
Figure 3 shows the mean handset controller values for all 28 participants in the first and second Truck drive comprising the three close approaches. The peak values for each approach are higher than for each of the city events, which was intended. As expected, a substantial increase of discomfort can be observed for the more critical approach in Truck drive 2 (red dotted line) compared to the less critical approach in Truck drive 1 (green line). This increase affects both the peak values and the moment at which discomfort begins, mainly due to the later onset of braking.
Figure 3: Mean discomfort ratings during truck drives 1 and 2.
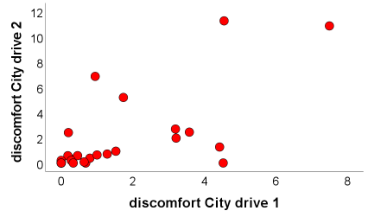
To assess the individual stability of the discomfort ratings over one year, correlation analyses were performed on the mean handset controller values for each drive. Since some relatively large differences in handset controller usage were observed (Figure 4), non-parametric Spearman correlation values (ρ) using ranks were calculated to account for outliers. Due to the translation invariance of correlations, offsets (e.g., different overall discomfort means across the four drives) do not affect the correlation values. The mean discomfort values for each complete drive integrate both the duration and magnitude of reported discomfort. Regarding zero values in Truck drive 1, four participants did not press the handset controller at all, one of whom repeated this behavior in Truck drive 2. In City drive 1, seven participants did not press the handset controller at all, four of whom did again not press at all in City drive 2.
Figure 4: Scatterplots of mean discomfort ratings after one year for the truck drives (left) and the city drives (right).
The Spearman correlation results (Table 2) showed high correlations of ρ = .823 between the two Truck drives and of ρ = .706 between the two City drives, after one year. The correlation between the first Truck drive and the first City drive was ρ = .776, with the second City drive ρ = .624. The second Truck drive showed correlations of ρ = .762 with the first City drive and ρ = .698 with the second City drive.
Several sociodemographic variables, personality traits and attitudes were analyzed to identify personal factors that may influence discomfort perception. These included age, gender, mileage per year, self-reported driving style, Affinity for Technology as well as initial acceptance and trust in automation. Correlations with the mean handset values for all four trips were calculated to estimate the range and stability of the effects. Although many correlations
Long-Term One-Year Stability of Discomfort Perception 71 did not reach the level of statistical significance (mainly due to the relatively small sample size), the absolute correlation values ranged from medium (~|.3|) up to large (~|.5|) according to Cohen (1988). Older participants reported less discomfort (ρ between –.224 and –.345); however, this was not connected with annual mileage (ρ between –.093 and .093). Men reported less discomfort than women (ρ between –.270 and –.406), and participants who characterized their own driving style as more offensive tended to report less discomfort (ρ between –.031 and –.277). Higher Affinity for Technology was associated with a trend of less discomfort (ρ between –.117 and –.307). There was a weak correlation between higher initial acceptance of automated driving and less discomfort (ρ between –.024 and –.248), whereas higher initial trust was markedly correlated with less discomfort (ρ between –.237 and –.527).
Overall, discomfort perception of automated driving maneuvers appears to be rather stable within individuals, even over a period of one year. Ordered by the mean correlation across all four drives, the strongest influence results for initial trust, followed by gender, age, Affinity for Technology, offensive driving style, initial acceptance, and mileage. However, some additional substantial correlations (>|.3|) between the sociodemographic variables, personality traits, and attitudes should be noted for a complete picture: gender and Affinity for Technology (ρ = .493**), offensive driving style and initial acceptance (ρ = .301), initial trust and initial acceptance (ρ = .700**) age and initial trust (ρ = .537**) as well as age and initial acceptance (ρ = .463*).
Table 2. Discomfort correlation matrix between the four drives and personal characteristics (n = 28, Spearman rank correlations ρ).
Table available in the original PDF paper.
Truck Drive 1
Truck Drive 2
City Drive 1
City Drive 2
Truck drive 2 ρ = .823*** p < .001 City drive 1 ρ = .776*** p < .001 ρ = .762*** p < .001
Equations and mathematical formulas are available in the original paper PDF.
Note: *p < .05, **p < .01, ***p < .001.
DISCUSSION AND CONCLUSION The present research investigated the stability of perceived discomfort in various automated driving scenarios after one year as well as personal factors that influence this perception. Discomfort was assessed continuously, gradually, and without the need for visual attention using a handset controller.
Overall, discomfort perception appears as rather stable within individuals, even over a rather long period of one year. Correlations of the mean discomfort values (integrating both duration and magnitude) between the different drives ranged from ρ = .624 to ρ = .823. Descriptive statistics showed relatively large differences in reported discomfort between individuals in the same situations, confirming previous findings on the subjective nature of discomfort perception (Beggiato et al., 2024; Dettmann et al., 2021). The present results extend these findings towards a relatively high individual stability over time. On the one hand, this leads to the conclusion that discomfort perception can be considered a relatively stable trait, provided that no learning experiences have been gained in the meantime. On the other hand, these findings suggest that the singular experience of successful (but not comfortable) automated driving maneuvers does not have a lasting effect on reducing discomfort in the same scenarios after one year. However, it could be plausibly argued that repeated experience of successful automated driving maneuvers (for example in the own automated vehicle) could lead to an increase of comfort over time as is already known for other constructs such as trust, acceptance, and mental models (Nkusi et al., 2025). Nevertheless, in scenarios where discomfort is mainly related to uncertainty about the perception abilities (e.g., approaching a red traffic light), even repeated experience may still leave some discomfort. Such issues could be addressed by transparently communicating the system’s status and planned maneuvers (Beggiato et al., 2015). For example, the system could indicate that it has perceived the red traffic light and is going to decelerate in a few seconds. This detailed information could also be provided according to a person’s current level of discomfort, thus dynamically addressing their individual needs. Experienced users or those with a lower discomfort threshold would not receive this detailed information all the time, whereas novice users or those showing signs of discomfort would automatically receive additional system information.
Regarding methodological aspects of using the handset controller to assess discomfort, the high correlations over one year suggest good test-retest reliability. Additionally, the controller values not only allow discomfort to be estimated across a whole drive. The magnitude, onset, and end of perceived discomfort can be assessed precisely for different scenarios. This allows for prioritizing interventions and defining respective timings, for example, the moment when additional information should be provided to prevent discomfort from the outset. Furthermore, the handset controller’s sensitivity to different criticality scenarios could be demonstrated for the two truck drives with higher or lower minimum time to contact.
Long-Term One-Year Stability of Discomfort Perception 73 Summarizing the influence of personal factors on the differences in reported discomfort, young women with a more defensive driving style, less Affinity for Technology as well as less initial trust and acceptance of automation seem to experience more discomfort. The strongest influence in terms of correlations results from lower initial trust in the automated system. These findings emphasize the importance of dispositional trust for the interaction with automated systems (Hoff & Bashir, 2015). However, trust is also dynamically affected by the interaction experiences with the system over time; repeated positive experiences should therefore lead to greater trust in the system and potentially less discomfort. After trust, substantial correlations could be observed in the following order of importance for gender, age, Affinity for Technology, offensive driving style, and initial acceptance. However, substantial correlations exist between these sociodemographic variables, personality traits, and attitudes (e.g., age and initial trust and acceptance, gender and Affinity for Technology, offensive driving style and initial acceptance), so a causal relationship and independent order of importance cannot definitively be established. Such analyses would require larger sample sizes and longitudinal study designs involving multiple measurements.
A limitation of the present research is the rather small sample size, particularly with regard to the personal factors influencing discomfort perception. However, although many correlations did not reach the level of statistical significance (mainly due to the small sample size), the reported absolute correlation values range from medium up to large. In addition, the two different drives on two different dates with a one-year interval in between allow for better estimating the stability of correlations. Another limitation of the sample concerns self-selection in study participation. The sample shows relatively high scores in Affinity for Technology as well as for initial trust and acceptance (see Method section). However, the relatively large standard deviation scores suggest sufficient differences between individuals to assess influence. Larger and more heterogenous samples would be required to confirm these findings.
As an overall conclusion and recommendation for user-centered design approaches to ensure comfort in automated driving, the strong individual and dynamic nature of discomfort perception should be taken into account. One way to achieve this could be to offer selectable automated driving styles such as defensive vs. dynamic. Another solution could be discomfort- adaptive real-time systems that assess the current level of discomfort and adapt the automated driving style and information presentation accordingly. A prototype of such a system, based on facial expression analyses (Beggiato et al., 2022), was developed and demonstrated in the experimental vehicle of TU Chemnitz at the final event of the STADT:up project.
ACKNOWLEDGMENT
This research was funded by the German Federal Ministry for Economic Affairs and Energy (BMWE), as part of the STADT:up project (19A22006R).
REFERENCES
Beggiato, M., Hartwich, F., & Krems, J. (2019). Physiological correlates of discomfort in automated driving. Transportation Research Part F: Traffic Psychology and Behaviour, 66, 445–458. https://doi.org/10.1016/j.trf.2019.09.018 Beggiato, M., Hartwich, F., Roßner, P., Dettmann, A., Enhuber, S., Pech, T.,
Gesmann-Nuissl, D., Mößner, K., Bullinger, A. C., & Krems, J. (2020). KomfoPilot - Comfortable Automated Driving. In G. Meixner (Ed.), Smart Automotive Mobility: Reliable Technology for the Mobile Human (pp. 71–154). Cham: Springer International Publishing. https://doi.org/10.1007/978-3-030-45131-8_2 Beggiato, M., Hartwich, F., Schleinitz, K., Krems, J. F., Othersen, I., & Petermann-Stock, I. (2015). What would drivers like to know during automated driving? Information needs at different levels of automation. 7. Tagung Fahrerassistenz, Munich. http://dx.doi.org/10.13140/RG.2.1.2462.6007 Beggiato, M., Hollander, C., Enhuber, S., Moessner, K., & Jahn, G. (2024). Typology
of Behavioral and Emotional Reactions to Uncomfortable Automated Driving Operations. In G. Praetorius, C. Sellberg & R. Patriarca (eds.) Advances in Human Factors of Transportation. AHFE (2024) International Conference. AHFE Open Access, vol 148. AHFE International, USA. http://doi.org/10.54941/ahfe1005204 Beggiato, M., Rauh, N., & Krems, J. (2022). Multi-camera Face Tracking for Estimating User’s Discomfort with Automated Vehicle Operations. In W. Karwowski et al. (Eds.), Proceedings of the 4th International Conference on Human Systems Engineering and Design (IHSED2021), 23–25. September 2021. https://doi.org/10.54941/ahfe1001104 Bellem, H., Thiel, B., Schrauf, M., & Krems, J. F. (2018). Comfort in automated
driving: An analysis of preferences for different automated driving styles and their dependence on personality traits. Transportation Research Part F: Traffic Psychology and Behaviour, 55, 90–100. https://doi.org/10.1016/j.trf.2018.02.036 Cohen, J. (1988). Statistical power analysis for the behavioral sciences (2nd ed.).
Hillsdale, NJ: Lawrence Erlbaum Associates. Dettmann, A., Hartwich, F., Roßner, P., Beggiato, M., Felbel, K., Krems, J., & Bullinger, A. C. (2021). Comfort or Not? Automated Driving Style and User Characteristics Causing Human Discomfort in Automated Driving. Int. Journal of Human-Computer Interaction, 37(4), 331–339. https://doi.org/10.1080/1044 7318.2020.1860518 ERTRAC. (2022). Connected, Cooperative and Automated Mobility Roadmap.
European Road Transport Research Advisory Council. Retrieved from https://www. ertrac.org/wp-content/uploads/2022/07/ERTRAC-CCAM-Roadmap-V10.pdf Franke, T., Attig, C., & Wessel, D. (2019). A Personal Resource for Technology Interaction: Development and Validation of the Affinity for Technology Interaction (ATI) Scale. International Journal of Human–Computer Interaction, 35(6), 456–467. https://doi.org/10.1080/10447318.2018.1456150 Hoff, K. A., & Bashir, M. (2015). Trust in Automation. Human Factors: The Journal
of the Human Factors and Ergonomics Society, 57(3), 407–434. https://doi. org/10.1177/0018720814547570 Nkusi, E. M., Grabbe, N., & Bengler, K. (2025). Long-term is no term: A systematic review of learning effects and the understanding of “long-term” in the context of driver-vehicle interaction. Transportation Research Part F: Traffic Psychology and Behaviour, 112, 111–137. https://doi.org/10.1016/j.trf.2025.03.027 Peng, C., Horn, S., Madigan, R., Marberger, C., Lee, J. D., Krems, J., Beggiato, M.,
Romano, R., Wei, C., Wooldridge, E., Happee, R., Hagenzieker, M., & Merat, N. (2024). Conceptualising user comfort in automated driving: Findings from an expert group workshop. Transportation Research Interdisciplinary Perspectives, 24, 101070. https://doi.org/10.1016/j.trip.2024.101070
FIND THE COMPLETE VOLUME IN THE AHFE DIGITAL BOOKSTORE
Explore the complete digital volume
Human Systems Engineering and Design (IHSED2026): Future Trends and Applications
Read this individual research paper free through the original publisher, or explore the full digital proceedings book.