Matthias Beggiato, Nadine Rauh, Josef Krems (2021). Multi-camera Face Tracking for Estimating User’s Discomfort with Automated Vehicle Operations. In: Human Systems Engineering and Design (IHSED2021): Future Trends and Applications. AHFE Open Access, vol. 21. https://doi.org/10.54941/ahfe1001104
Face tracking as innovative and unobtrusive sensor technology offers new possibilities for driver state monitoring regarding discomfort in automated driving. To explore the potential of automated facial expression analysis, video data of two driving simulator studies were analyzed using the Visage facial features and analysis software. A gender-balanced sample of 81 participants between 24 and 84 years took part in the studies. All participants were driven in highly automated mode on the same standardized track, consisting of three close approach situations to a truck driving ahead. By pressing the lever of a handset control, all participants could report perceived discomfort continuously. Tracking values for 23 facial action units were extracted from multiple video camera streams, z-transformed and averaged from 10 s before pressing the handset control until 10 s after to show changes over time. Results showed situation-related pressing and stretching of the lips, a push-back movement of the head, raising of inner brows and upper lids as well as reduced eye closure. These patterns could be interpreted as visual attention, tension and surprise. Overall, there is potential of facial expression analysis for contributing information about users’ comfort with automated vehicle operations. However, effects became manifest on aggregated data level; obtaining stable and reliable results on individual level remains a challenging task.
Technological developments make video-based face tracking attractive as in-vehicle driver state sensor for automated vehicles. Video cameras are relatively inexpensive, unobtrusive, consume little space and can potentially measure several driver state properties based on tracking of head-, eye- and body movements. In addition, facial expressions can be detected and analyzed as a source of information about the drivers’/users’ current state. Facial expressions as changes in the movements of specific muscles or muscle groups represent a basic channel for communicating emotional states. The Facial Action Coding System (FACS, Ekman et al., 2002) encodes such movements systematically into Action Units (AU), which represent momentary changes in facial appearance (e.g. lip presser) without interpreting the meaning of expressions. Traditional manual coding of these AUs has nowadays been replaced by automated computer vision algorithms (Ko, 2018). As a consequence, automated facial expression analysis has already been investigated in the automotive context to detect stress, fatigue, distraction or frustration (Ihme et al., 2018) as well emotional reactions to specific automated driving maneuvers (Domeyer et al., 2019).
Monitoring users’ comfort/discomfort with automated vehicle operations by facial expression analysis could improve human-machine interaction in automated vehicles; based on the idea of a vehicle-driver team, knowing each other’s current states and acting accordingly. Automated vehicle operations include the full range of vehicles’ behavior such as acceleration, deceleration, gap acceptance, lane keeping, car following etc. (Smith et al., 2018). As vehicle behavior is related to specific and dynamic driving situations, continuous comfort monitoring is indicated to ensure a positive and comfortable automated driving experience. Comfort is considered as a main driver for higher level automated driving, next to efficiency, safety, accessibility and social inclusion (ERTRAC, 2019). In automated driving, new comfort aspects become important such as motion sickness, trust in the system, apparent safety, controllability, familiarity of vehicle operations as well as information about system states and actions (Domeyer et al., 2019; Beggiato, 2015; Hartwich et al., 2018). Thus, to explore the expected benefits of automated driving, acceptance needs to be ensured by avoiding unpleasant experiences of discomfort related to these new aspects. Additionally, these comfort aspects are not just relevant for acceptance but they can have safety impacts, too. Unexpected vehicle operations could lead to unnecessary and even safety critical driver interventions, for instance if apparent safety is perceived as compromised (Techer et al., 2019).
Thus, the present study aimed at investigating the potential of automated facial expressions analysis for estimating discomfort with automated vehicle operations in a driving simulator. Changes in AUs were analyzed by combining data from two
Human Systems Engineering and Design (IHSED 2021) https://openaccess.cms-conferences.org/#/publications/book/978-1-7923-8987-0 driving simulator studies. In both studies, all participants experienced exactly the same fully automated close approach situation to a slower truck driving ahead three consecutive times. This specific situation was primarily chosen because short distances are one of the most mentioned cause for discomfort as a co-driver (Beggiato et al., 2019) and keeping comfortable distances is already important for current assistance systems. In addition, the high standardization of this particular scenario allowed for collecting larger amounts of data to analyze AU-changes in exactly the same situation. Using a handset controller, participants could continuously report discomfort to make sure that all analyses relate to subjectively perceived discomfort. The present analyses extend previous works (Beggiato et al., 2020), where data from just one study and also just one video camera with an older face tracking software version has been used. The new analyses combine data from 81 participants, two video cameras in Study 1 and four video cameras in Study 2 using the most recent available software version 8.7 of the Visage facial feature detection and face analysis SDK (visagetechnologies.com).
METHODS
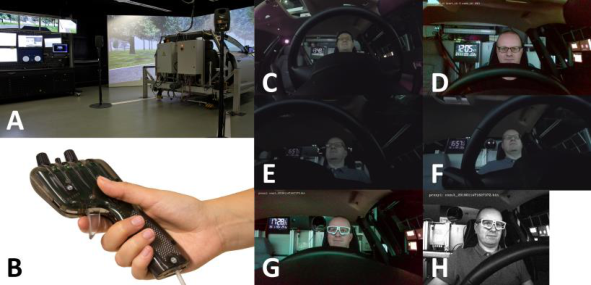
Driving simulator studies setup. All data was acquired in two distinct driving simulator studies including the exactly identical automated drive. Both studies were conducted with different participants in a fixed-base driving simulator (Software SILAB 5.1) with a fully equipped interior and a 180° field of view (Figure 1A). The investigators prerecorded a three-minute drive, which was replayed while the participants sat in the drivers’ seat. Pedals and the steering wheel were inoperative, pretending that all vehicle operations were performed automatically. The trip included three consecutive close approach situations to a slower truck driving ahead, intended to provoke discomfort. The own vehicle drove at a constant speed of 100 km/h and approached the truck driving at 80 km/h. At a relatively short distance of 9 m, automated braking was initiated, resulting in a minimum time to contact of 1.1 s (4.2 m). To assess perceived discomfort, all participants were instructed to press the lever of a handset control accordingly during the whole trip (Figure 1B). Two video cameras were installed in Study 1 and four video cameras in Study 2 to capture the driver’s face. In Study 1, a GoPro Hero 5 camera (1280 x 720 pixel, 50 fps, Figure 1C) was mounted in a central position below the instrument cluster behind the steering wheel as well as an Intel RealSense SR300 camera centrally over the steering wheel (1280 x 720 pixel, 30 fps, Figure 1D). In Study 2, two GoPro Hero 5 cameras (1920 x 1080 pixel, 50 fps, Figure 1E+F) were placed at the left and right side behind the steering wheel below the instrument cluster. The Intel Realsense SR300 camera (1280 x 720 pixel, 30 fps, Figure 1G) was again placed at the central position over the steering wheel. In addition, an AVT Mako G-234B grayscale video camera (640 x 480 pixel, 30 fps, Figure 1H) was installed next to the steering wheel at the right side from the driver’s perspective.
Participants. The total sample of 81 participants consisted of 49 males and 32
Human Systems Engineering and Design (IHSED 2021) https://openaccess.cms-conferences.org/#/publications/book/978-1-7923-8987-0 females; 40 participants took part in in Study 1 and 41 in Study 2. Age ranged from 24 to 84 years, consisting of two distinct age groups; an older group over 60 years (M = 70 years, SD = 5.6, range = 61 to 84 years, N = 41) and a younger group under 40 years (M = 29 years, SD = 4.2, range = 24 to 39 years, N = 40). The participants were required to hold a valid driver’s license and were compensated with 20 Euro for participation. Both studies were carried out in line with the regulations and consent templates of the TU Chemnitz ethics commission. The participants were not informed about the upcoming approach situations, but just to press the lever of the handset control according to the extent of perceived discomfort.
Figure 1. Driving simulator (A), handset control for reporting discomfort (B), video camera perspectives Study 1 (C-D), video camera perspectives Study 2 (E-H).
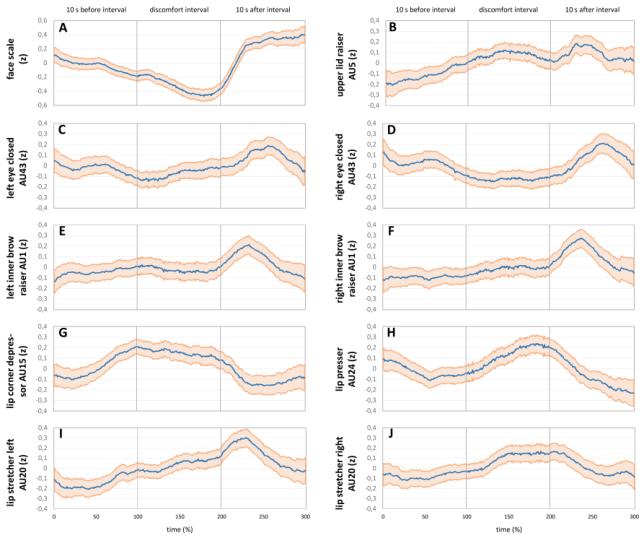
Discomfort Sequence Extraction. Each time period of pressing the handset control (independent of magnitude) was marked as discomfort interval for each participant and each of the three approach situations. A theoretical maximum 243 intervals could be present, having 3 approaches and 81 participants. However, in 51 approach situations participants did not press the handset control at all. Thus, 192 discomfort intervals could be marked (94 in Study 1 and 98 in Study 2) with a mean duration of 7.72 s (SD = 5.45). A 10 s time interval was added before and after each discomfort interval to obtain a discomfort sequence (consisting of 10 s + discomfort interval + 10 s). As all discomfort intervals varied in duration, a common percent time axis was created from 0% to 300% to show all changes of each AU in one common scale (Figure 2). Each discomfort interval was split into percent slices, calculating the mean AU-value over the time interval of the respective percent slice. Further details on this method can be found in (Beggiato et al., 2019; Borowsky et al., 2020; Beggiato et al., 2018).
Face tracking software and preprocessing of raw AU data. The latest available version of the Visage facial feature detection and face analysis SDK (Version 8.7 for Windows, visagetechnologies.com) was used to extract AU values of all video recordings. A total of 23 AUs were tracked, each resulting in an arbitrary decimal number for every video frame. Additionally, the software is able to report a tracking
Human Systems Engineering and Design (IHSED 2021) https://openaccess.cms-conferences.org/#/publications/book/978-1-7923-8987-0 quality value for each video frame and only quality values greater than 30% entered the analyses to avoid distortions. A moving average over ± 2 s was calculated for each AU raw score to correct for high frequency signal fluctuations. As the resulting smoothed AU values were still arbitrary decimal numbers, z-transformation was applied to all AU values of each video camera and each discomfort sequence. This procedure expresses raw values as distance to the mean in units of standard deviations, with a standard deviation of one and a total mean of zero (Gratton et al., 2017). As these z-values represent relative changes of each AU within the discomfort sequence using a unified scale of measurement, data from all six video cameras could be combined. Completely missing AU values in discomfort sequences due to lost tracking in specific video camera streams were excluded from calculations. Thus, 428 sequences with valid AU values entered the analyses (theoretical maximum = 580 sequences resulting from 2 video cameras x 94 sequences in Study 1 and 4 video cameras x 98 sequences in Study 2). The z-transformed values were averaged over the 428 sequences for each percent slice (bold blue line in Figure 2) and the 95% confidence interval was calculated pointwise (plotted as a light red area around the means). If the confidence band does not overlap between two points in time, these two means differ in a statistically significant manner. To identify situation-related AU changes, all resulting plots of the 23 AUs were checked for significant rises or falls around the discomfort interval with subsequent recovery, i.e. n-shaped or u-shaped trends. Relevant AUs showing these effect trends are reported in Figure 2.
RESULTS
Figure 2 shows the average z-transformed values of all 10 AUs with situation-specific changes, i.e. n-shaped or u-shaped profiles. The values were averaged over all 428 discomfort sequences of all video cameras. The figure includes the 8 AUs that were identified with the older Visage software version 8.4 and just one video camera (Beggiato et al., 2020) as well as two additional parameters (face scale Figure 2A and AU15 lip corner depressor Figure 2G). The face scale value (Figure 2A) indicates the size of the detected face and the z-transformed values showed a constant decrease until the end of the discomfort interval with subsequent sharp rise. These findings are in line with the pushback-movement of the body in this situation, which was found using maker-based motion tracking (Beggiato et al., 2018). Consistent with previous findings using eye tracking (Beggiato et al., 2018), a reduction in eye closure during the discomfort interval could be observed for the right and left eye with a subsequent increase after the discomfort interval (AU43, Figure 2C+D). Participants kept their eyes open and reduced eye blinks during the truck approach situation. An increase right after the discomfort interval could be found for the inner brow raiser (AU1), both for the left (Figure 2E) and right face side (Figure 2F). Combined with the increasing trend in upper lid raiser (AU5, Figure 2B), these eye-related AU-trends point towards a reaction of surprise and visual attention in this scenario. Changes in the mouth region showed a situation-specific increase in pressing the lips in general (AU24, Figure 2H) as well as pressing the lips corner (AU15, Figure 2G). In addition,
Human Systems Engineering and Design (IHSED 2021) https://openaccess.cms-conferences.org/#/publications/book/978-1-7923-8987-0 lips were stretched during the discomfort situation (AU20), both for the left (Figure 2I) and for the right face side (Figure 2J). The combination of pressing and stretching the lips during the close approach situation points towards a reaction that could be interpreted as tension.
Figure 2. Average z-scores of AUs before, during and after discomfort intervals with situation-specific effects as n- or u-shaped trends (bold blue line = mean z-score over all 428 sequences, light red area = 95% pointwise confidence interval).
DISCUSSION AND CONCLUSIONS The present study focused on exploring the potential of facial expression analysis to provide information about current users’ discomfort with automated vehicle operations. Based on the idea of a driver-vehicle team, this information could subsequently be used to adapt automated driving style features and reduce unnecessary and potentially safety-critical take-over situations. Thus, AU changes of 81 participants from two driving simulator studies were analyzing during a standardized automated close approach situation to a slower truck driving ahead. Video recordings from six video cameras (two in Study 1 and four in Study 2) were processed using the Visage facial features and analysis software v8.7. Overall, the combination of two studies, multiple video cameras and the newer analysis
Human Systems Engineering and Design (IHSED 2021) https://openaccess.cms-conferences.org/#/publications/book/978-1-7923-8987-0 software 8.7 showed similar, but also some new results in comparison to just one video camera and the older software version 8.4 (Beggiato et al., 2020). A new result is the situation-specific decrease in the face scale value. This pushback-movement of the upper body in this scenario was already found using marker-based motion tracking (Beggiato et al., 2018). Thus, the updated face tracking software could be used as alternative unobtrusive sensor system for detecting this specific movement. In line with previous result based on eye tracking (Beggiato et al., 2018), a tendency for keeping both eyes open (AU43) could be observed during the approach. Eye blinks were reduced and “postponed” until the situation passed. The raise of upper lids (AU5) and inner brows (AU1) are considered essential components of surprise (Ekman et al., 2002), even though the rise of inner brows was just visible immediately after the situation passed. The situation-related changes in the lips region comprise stretching (AU20) and pressing the lips (AU24) as well as pressing the lips corner (AU15). Very similar patterns in the mouth region could be identified for frustrated driver (Ihme et al., 2018) and this combination of lip movements could be interpreted as sign for tension. Overall, the AU changes during the discomfort interval point at a reaction of visual attention, surprise and tension. Even though these general AU effects could be found using z-transformation and signal averaging techniques, the rather broad confidence interval bands indicate that there is still variability. One source of variability could be individual differences in facial expressivity, i.e. different or even opposite individual trends in the AU reactions. A detailed analysis using the former Visage software version 8.4 separating two groups of high and low situation-specific effects can be found in (Borowsky et al., 2020). A second source of variability could be time-related issues, i.e. the effect is the same but anticipated or delayed with respect to other samples. These latency jitter effects result in “smearing” problems and are a known issue in signal averaging techniques for physiological data (Gratton et al., 2017).
In conclusion, video-based automated facial expressions analysis using data averaging techniques showed specific changes during this uncomfortable close approach situation in automated driving mode. Thus, face tracking as unobtrusive sensor technology shows general potential for contributing valuable information about the user’s comfort/discomfort with current automated vehicles operations. Even though the presented results show potentially relevant changes in AUs including indications about direction, magnitude and timing of changes, discomfort detection at individual level still remains a challenging task. The findings obtained by z- transformation and averaging over video cameras, participants and situations are not necessarily entirely transferable to each individual due to e.g. individual differences and latency of effects. In addition, the close approach situation is just one of several potentially uncomfortable scenarios, whereby distance regulation is considered a crucial factor for perceived comfort (Beggiato et al., 2019). Thus, the transferability of the presented approach should be validated in other situations, too. In addition, machine learning algorithms could potentially tackle some of these problems, however, significantly higher amounts of data at individual level would be required to develop and train such algorithms.
Human Systems Engineering and Design (IHSED 2021) https://openaccess.cms-conferences.org/#/publications/book/978-1-7923-8987-0
ACKNOWLEDGMENTS
This work was supported by the European Union’s Horizon 2020 research and innovation programme under grant agreement No. 814735 (Project MEDIATOR) and by the Deutsche Forschungsgemeinschaft (DFG, German Research Foundation) under project-ID 416228727 – SFB 1410 (Hybrid Societies).
REFERENCES
Beggiato, M. (2015). Changes in motivational and higher level cognitive processes when interacting with in-vehicle automation (Doctoral Dissertation). University of Technology Chemnitz. Beggiato, M., Hartwich, F., Krems, J. (2019). Physiological correlates of discomfort in automated
driving. Transportation Research Part F: Traffic Psychology and Behaviour, 66, 445–458. doi:10.1016/j.trf.2019.09.018. Beggiato, M., Hartwich, F., Krems, J. (2018). Using Smartbands, Pupillometry and Body Motion to Detect Discomfort in Automated Driving. Frontiers in Human Neuroscience, 12, 3138. doi:10.3389/fnhum.2018.00338. Beggiato, M., Rauh, N., Krems, J. (2020). Facial Expressions as Indicator for Discomfort in Automated
Driving. In T. Ahram, W. Karwowski, A. Vergnano, F. Leali, R. Taiar (Eds.). Intelligent Human Systems Integration 2020, pp 932–937. Springer, Cham. doi: 10.1007/978-3-030-39512-4_142. Borowsky, A., Oron-Gilad, T., Chasidim, H., Ahlström, C., Karlsson J.G., Bakker, B., … Christoph, M.
(2020). Behavioural Markers for Degraded Human Performance. Deliverable D1.2 of the H2020 project MEDIATOR. Retrieved from https://mediatorproject.eu/deliverables. Domeyer, J., Alsaid, A., Liu, S.-Y., Lee, J. D. (2019). Passenger Emotional Response Type and Timing during Automated Vehicle Intersection Negotiation. Proceedings of the Human Factors and Ergonomics Society Annual Meeting, 63(1), 2061–2065. doi:10.1177/1071181319631226. ERTRAC (2019). Connected Automated Driving Roadmap. European Road Transport Research
Advisory Council. Retrieved from https://www.ertrac.org. Ekman, P., Hager, J. C., Friesen, W. V. (2002). Facial action coding system: The manual. Salt Lake City: Research Nexus. Gratton, G., Fabiani, M. (2017). Biosignal Processing in Psychophysiology: Principles and Current
Developments. In J. T. Cacioppo, L. G. Tassinary, G. G. Berntson (Eds.), Handbook of Psychophysiology (4th ed., pp. 628–661). Cambridge University Press. Hartwich, F., Beggiato, M., Krems, J. F. (2018). Driving comfort, enjoyment and acceptance of automated driving – effects of drivers’ age and driving style familiarity. Ergonomics, 61(8), 1017– 1032. doi:10.1080/00140139.2018.1441448. Ihme, K., Dömeland, C., Freese, M., Jipp, M. (2018). Frustration in the face of the driver. Interaction
Studies, 19(3), 487–498. doi:10.1075/is.17005.ihm. Ko, B. (2018). A Brief Review of Facial Emotion Recognition Based on Visual Information. Sensors, 18(2), 401. doi:10.3390/s18020401. Smith, S., Koopmann, J., Rakoff, H., Peirce, S., Noel, G., Eilbert, A., Yanagisawa, M. (2018). Benefits
Estimation Model for Automated Vehicle Operations: Phase 2 Final Report. U.S. Department of Transportation. Retrieved from https://rosap.ntl.bts.gov/view/dot/34458/dot_34458_DS1.pdf?. Techer, F., Ojeda, L., Barat, D., Marteau, J.-Y., Rampillon, F., Feron, S., Dogan, E. (2019). Anger and highly automated driving in urban areas: The role of time pressure. Transportation Research Part F: Traffic Psychology and Behaviour, 64, 353–360. doi:10.1016/j.trf.2019.05.016.
Human Systems Engineering and Design (IHSED 2021) https://openaccess.cms-conferences.org/#/publications/book/978-1-7923-8987-0
LISTED IN THE AHFE DIGITAL BOOKSTORE CATALOGUE
Explore the complete digital volume
Human Systems Engineering and Design (IHSED2021): Future Trends and Applications
Read this individual research paper free through the original publisher, or explore the full digital proceedings book.
ISBN 978-1-7923-8987-0
Explore this ISBN in the AHFE Bookstore ↗Listed in the July 2026 bookstore catalogue; search by ISBN to confirm current availability · Digital book purchase optional