Florian Kretzschmar, Matthias Beggiato, Alois Pichler (2022). Detection of Discomfort in Automated Driving via Stochastic Approximation. In: Human Factors in Transportation. AHFE Open Access, vol. 60, pp. 87–92. https://doi.org/10.54941/ahfe1002437
One of the most important goals in the field of autonomous driving development is to make the experience for the passenger as pleasant and comfortable as possible. In addition to traditional influence factors on passenger comfort, new aspects arise due to the transfer of control from the human to the vehicle. Some of these are apparent safety, motion sickness, user preferences regarding driving style and information needs. Ideally, the vehicle and the passenger should form a team, whereby the vehicle should be able to detect and predict situations of discomfort in real time and take measures accordingly. This requires not only the continuous monitoring of the passengers state but also the implementation of adequate mathematical models. To investigate how this teaming of human and automated agents can be shaped in the most effective way is a key topic of the Collaborative Research Center “Hybrid Societies (https://hybrid-societies.org/). In this framework, driving simulator data from the previous project “KomfoPilot” (https://bit.ly/komfopilot) is re-analyzed using new mathematical models. The participants in the study completed several automated drives and reported continuously situations of discomfort using a handset control. Sensor data was collected simultaneously using eye tracking glasses, a smart band, seat pressure sensors and video cameras for motion and face tracking. While pupil diameter, heart rate, interblink intervals, skin conductance and head movement have already been identified as potential single indicators of discomfort, it is now necessary to integrate these and other findings of the project into a functional multivariate model. In this paper, we investigate how such a model can be shaped to offer high prediction accuracy and viable practical implementation. The first important question – which arises from the heterogeneity of the participants – is whether to work with training data on an individual or aggregated level. We compare both possibilities by applying techniques from the field of stochastic approximation for clustering of the chosen training set and subsequent classification of the test data. In the case of an individual model for each participant, we furthermore divide the participants into subgroups and analyze whether there is a connection between the physiological reactions of a passenger and his/her demographic characteristics and driving experience. Finally, we discuss the potential of our method as a reliable prediction model as well as implications for future driving simulator studies and related research.
One of the most important goals in the field of autonomous driving develo- pment is to make the experience for the passenger as pleasant and comforta- ble as possible (ERTRAC, 2019). In addition to traditional influence factors on passenger comfort, new aspects arise due to the transfer of control from the human to the vehicle. Some of these are apparent safety, motion sickness, user preferences regarding driving style and information needs (Elbanhawi et. al., 2015). Ideally, the vehicle and the passenger should form a team, whereby the vehicle should be able to detect and predict situations of arising discom- fort in real time and take measures accordingly. This requires not only the continuous monitoring of the passengers state but also the implementation of adequate mathematical models to process this sensor data (Dommel et al., 2021). To investigate how this teaming of human and automated agents can be shaped in the most effective way is a key topic of the Collaborative Research Center “Hybrid Societies (https://hybrid-societies.org/). In this fra- mework, driving simulator data from the previous project “KomfoPilot” (https://bit.ly/komfopilot) is re-analyzed. While pupil diameter, heart rate, interblink intervals, skin conductance and head movement have already been identified as potential single indicators of discomfort (Beggiato et al., 2018),
it is now necessary to integrate these and other findings of the project into a functional multivariate model.
This paper investigates how such a model can be shaped to offer high pre- diction accuracy and viable practical implementation. The first important question – which arises from the heterogeneity of the participants – is whe- ther to work with training data on an individual or aggregated level. We compare both possibilities by applying techniques from the field of stocha- stic approximation for clustering of the chosen training set and subsequent classification of the test data.
METHODS
Experiment. As part of the project “KomfoPilot”, 40 individuals between the age of 25 to 84 (25 male, 15 female) participated in a driving simulator study consisting of two three-minute-long highly automated drives. During each session, the participants were objected to three potentially dangerous and discomfort-inducing near collision situations with a truck driving ahead, where the truck drove at a constant speed of 80 km/h while the automa- ted vehicle approached it with 100 km/h. Automated braking then started at a rough distance of 9 m, reaching a minimum of 4.2 m and a minimum time-to-collision of 1.1 s and there was no possibility of human intervention. Participants were able to continuously report the extent of their perceived discomfort during the whole driving via an integrated handset control lever (further details on method, sensors and measures can be found in Beggiato et al., 2020).
Sensors and Physiological Measures. We first describe the variables inclu- ded in our models and the respective devices used to measure them. Pupil diameter and eye blinks were assessed using the SMI Eye Tracking Glasses 2. This device was not applied in the second driving session to test camera-based facial expressions recognition (Beggiato, Rauh, & Krems, 2020), and could not be worn by participants already wearing eyeglasses, which reduced the sample to 20 trips of 20 participants. A moving average over ± 300 ms was calculated for pupil diameter to adjust for fluctuations, especially close to eye blinks. To obtain a continuous blink rate, a new variable called “interblink interval time” was introduced, defined as the time in seconds passed since the last blink. Heart rate was measured continuously by the smart band Micro- soft Band 2. The difference of the head position on the z-axis to the position at the start of the drive in mm was measured by an OptiTrack motion tra- cking system. Finally, the gradual handset control signal was transformed into a binary variable consisting of a discomfort (handset control > 0) and a comfort (handset control = 0) class.
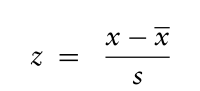
Data preparation. The analyzed data sets always consisted of the five vari- ables pupil diameter, heart rate, interblink interval time, difference of head position and handset control. The first four were used as the feature variables and are standardized for each participant individually, i.e.
Equation reproduced from the original PDF.
Detection of Discomfort in Automated Driving via Stochastic Approximation 89
Table 1. Contingency table for binary classification.
Table available in the original PDF paper.
Prediction
Total Population (P+N) Positive (PP) Negative (PN) Truth Positive (P) True positive (TP) False negative (FN) Negative (N) False positive (FP) True negative (TN)
where x is the mean and s is the estimated standard deviation of the corre- sponding feature. This transformation is necessary due to different magnitude of the variables and individual differences between the participants, e.g. heart rate at rest.
Quality measures. In order to assess the performance of our model, we calculated and compared different metrics on the test datasets. In the con- text of binary classification, the four possible outcomes can be presented in a contingency table or confusion matrix (Fawcett, 2006), as described in Table 1.
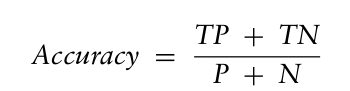
In our specific context, a discomfort situation was associated with “posi- tive” and a comfort situation with “negative”, respectively. Many different metrics can be derived from this contingency table, but we focused on the following three. First, the accuracy
Equation reproduced from the original PDF.
is the ratio of correct predictions to total population. If datasets are imba- lanced, as it occurred frequently in the case of our test sets, this metric is potentially misleading. Hence, it is also necessary to consider the precision
Precision = TP TP + FP,
and the recall
Recall = TP TP + FN.
A low precision is synonymous with a large amount of false positives, mea- ning that the classifier is overestimating. Similarly, a low recall or sensitivity implies that a large amount of positives are missed by the classifier.
MODELS Clustering-classification-model. We now briefly discuss our modeling appro- ach. Contrary to other popular methods, such as, e.g., Support Vector Machines or Logistic Regression (Dommel et al., 2021), we took a two- step-approach. First, we used an algorithm from the field of stochastic approximation (Pflug & Pichler, 2014) to cluster the training data. In parti- cular, we obtained a set of supporting points or cluster representatives and each data point was assigned to the cluster to whose representative it is the closest. The resulting clusters were then labeled as discomfort or comfort,
based on the majority of the points in the respective cluster. To account for potential imbalances, additional discomfort points were randomly sampled from the ones present in the training set and added to it until reaching an equal amount of comfort and discomfort points. To make predictions on the test set, we simply calculated the distances to the cluster representatives and assigned the label of the closest cluster.
Training and test data. We chose three different approaches of selecting training and test data and investigated the implications for the quality of the resulting model.
The first approach – referred to as individual approach – was to build models based on the individual data set of each participant. For this purpose, we divided the corresponding time series into four equally sized parts, where parts two to four contained a discomfort situation each and the first part was omitted due to only containing an initial test of the handset control unit by each participant. The model was then trained on set two and tested on set three, as well as trained on the combination of two and three and tested on set four.
The second approach was to predict the data set of one participant using a model that was trained on the data of the remaining participants. We will refer to this as the aggregated approach.
Finally, we tested on the data of a single discomfort situation (parts two to four mentioned above) of one participant using a model that was trai- ned on data consisting of the same discomfort situation of the remaining participants. This will be referred to as the situational approach from now on.
RESULTS
Individual Approach. As mentioned above, we have two train-test-splits for each participant corresponding to two models. Table 2 shows the per- formance metrics on the different training and test sets averaged over all participants. Although the metrics on the training sets are very good in both cases, the models do not generalize well and perform rather poorly on the test sets. While additional training data yields an increase in recall on average, overall accuracy and precision decrease.
Aggregated Approach. Table 3 shows the averaged performance metrics for the aggregated approach, where testing was performed on the data of the complete drive of a particular participant using a model trained on the data of the remaining participants. Overall accuracy and recall are moderately good with values of 67.2 % and 64.3 % on average. However, a mean precision of 27.0 % implies a large number of false positives or “false alarms”.
Situational Approach. Similarly to the aggregated approach, we trained on the data of all but one participant, but separately for each of the three discom- fort situations. Table 4 displays the corresponding performance metrics. We observed a moderately good overall accuracy for all situations and the high- est recall out of all three approaches. However, average precision again is undesirably low.
Comparison of Approaches. The individual approach was chosen based on the assumption that participants have different perceptions of discomfort,
Detection of Discomfort in Automated Driving via Stochastic Approximation 91
Table 2. Performance metrics for individual approach, averaged over all participants.
Table available in the original PDF paper.
Training Set 2 Testing Set 3 Training Set 2 + 3 Testing Set 4 Accuracy 87.5 % 75.1 % 81.8 % 61.0 % Precision 87.9 % 43.2 % 79.9 % 29.6 % Recall 87.9 % 28.0 % 88.1 % 53.8 %
Table 3. Performance metrics for aggregated approach, averaged over all participants.
making it beneficial to use separate prediction models for each of them. As mentioned above, the models have a good fit on the training data, but do not generalize well on the respective test sets. This is quite counter intuitive, given the fact that each drive consists of three identical near collision situations and raises the question whether time since the start of the drive and/or previous experiences also influence perceived discomfort. Ultimately, the individual models failed to outperform the ones of the other approaches. It should be noted however, that the amount of data available for each participant was comparatively low and it might be worth to carry out additional experiments to investigate this approach further.
The models of the situational and aggregated approach both used data of all but one particular participant each, with the difference that the three discomfort situations were modeled separately for the situational approach. While we can observe a similar accuracy on average, the models of the aggregated approach tend to have a lower accuracy as well as recall, which strengthens the hypothesis that these situations were perceived differently.
CONCLUSION
This paper investigated different approaches on modeling and detecting discomfort based on data from the driving simulator study “KomfoPilot”. We considered different choices of training and test data, in particular focu- sing on each individual participant and the different discomfort situations. We used a clustering-and-classification model where the inputs were vectors
consisting of z-scores of heart rate, difference of head position on the z-axis since the start of the drive, pupil diameter and interblink interval time. We identified the above mentioned situational approach as the most promising to predict discomfort and conclude that it is more advantageous to train a model based on specific situations the passengers are exposed to in traffic. Surpri- singly, this is more efficient than training the model for individual persons. There is still room for improvement in the performance, which might be ach- ieved by including additional input features such as a time component, facial expressions (Beggiato, Rauh, & Krems, 2020) or body movements (Beggiato, Hartwich, & Krems, 2018).
The subject of further research may be the identification of adequate additional features, the performance of the presented individual approach for larger data sets of a single participant and the application of other mathematical models.
ACKNOWLEDGMENT
The authors would like to acknowledge funding by Deutsche Forschungsge- meinschaft (DFG, German Research Foundation). Project-ID 416228727 – SFB 1410.
REFERENCES
Beggiato, M., Hartwich, F., Krems, J. (2018). Using smartbands, pupillometry and body motion to detect discomfort in automated driving. Front. Hum. Neurosci. 12, 3138. https://doi.org/10.3389/fnhum.2018.00338. Beggiato, M., Hartwich, F., Roßner, P., Dettmann, A., Enhuber, S., Pech, T.,
Gesmann-Nuissl, D., Mößner, K., Bullinger, A. C., & Krems, J. (2020). KomfoPilot - Comfortable Automated Driving. In G. Meixner (Ed.), Smart Automotive Mobi- lity: Reliable Technology for the Mobile Human (pp. 71–154). Cham: Springer International Publishing. doi: 10.1007/978-3-030-45131-8_2. Beggiato, M., Rauh, N., Krems, J. (2020). Facial expressions as indicator for discomfort in automated driving. In: Ahram, T., et al. (eds.) Intelligent Human Systems Integration, IHSI 2020. AISC 1131. Springer Nature Switzerland. https: //doi.org/10.1007/978-3-030-39512-4_142 Dommel, P., Pichler, A., & Beggiato, M. (2021). Comparison of a Logistic and SVM
Model to Detect Discomfort in Automated Driving. In D. Russo et al. (Eds.), Intel- ligent Human Systems Integration 2021, AISC 1322, pp. 44–49. Cham: Springer. doi:10.1007/978-3-030-68017-6_7. ERTRAC: Connected Automated Driving Roadmap. European Road Transport Research Advisory Council, European Road Transport Research Advisory Cou- ncil. (2019). https://www.ertrac.org/uploads/documentsearch/id57/ERTRAC- CAD-Roadmap-2019.pdf Elbanhawi, M., Simic, M., Jazar, R. (2015). In the passenger seat: investigating ride
comfort measures in autonomous cars, IEEE Intelligent transportation systems magazine 7 (3), 4–17. Fawcett, T. (2006). An Introduction to ROC Analysis. Pattern Recognition Letters.
27 (8): 861–874. doi:10.1016/j.patrec.2005.10.010. Pflug, G. Ch., Pichler, A. (2014) Multistage Stochastic Optimization. Springer International Puplishing Switzerland (2014). https://doi.org/10.1007/978-3-319- 08843-3
LISTED IN THE AHFE DIGITAL BOOKSTORE CATALOGUE
Explore the complete digital volume
Human Factors in Transportation
Read this individual research paper free through the original publisher, or explore the full digital proceedings book.
ISBN 978-1-958651-36-0
Explore this ISBN in the AHFE Bookstore ↗Listed in the July 2026 bookstore catalogue; search by ISBN to confirm current availability · Digital book purchase optional