Noora Nenonen, Maria Lindholm, Johanna Pulkkinen (2026). Monitoring and Indicators Related to the Safety Observation Reporting and Management Process. In: Human Systems Engineering and Design (IHSED2026): Future Trends and Applications. AHFE Open Access, vol. 237, pp. 705–714. https://doi.org/10.54941/ahfe1008209
Evaluating and monitoring the effectiveness of near-miss management systems (NMS) remain under-researched, and the absence of standard guidelines has contributed to variations in practice. In addition, most studies focus only on the number of near-miss reports without detailing other useful indicators or metrics for tracking NMS. This study provided information about the various aspects that organizations monitor in relation to the safety observation process. The term “safety observation” includes both unsafe conditions and unsafe acts, as well as near-misses, meaning unplanned events that could have caused harm but ultimately did not. Employing a mixed-method approach, the research conducted semi-structured interviews with five Finnish organizations from diverse sectors and an online survey involving safety professionals. The findings reveal that organizations track safety observations through various metrics related mainly to reporting activity, progress of handling the reports, and corrective actions. Common indicators are the number of reports, reporting coverage, response and processing times, and completion rates of corrective actions. While top management primarily focuses on the number of safety observations, safety teams and supervisors monitor additional aspects, such as report content and implementation of actions. The study highlights the need for qualitative indicators to supplement quantitative metrics and the potential of using positive safety observations and corrective actions as indicators.
In safety management, several methods are used to track and measure performance. In general, performance measurement is crucial for purposes such as evaluating current performance, monitoring development and budgeting, and motivating personnel and other stakeholders (Behn, 2003). To obtain the intended benefits, measurement must be supported by practices that ensure the gathered information is actively utilized (Jääskeläinen, Tappura and Pirhonen, 2022). Transforming metrics into action includes sharing information, analyzing data to find patterns and abnormalities, and broadly disseminating the resulting insights to enable corrective actions (Sinelnikov, Inouye and Kerper, 2015).
Although the terms used may vary, leading and lagging indicators are often mentioned when discussing safety indicators. Leading indicators are proactive Received April 21, 2026 Revised June 28, 2026 Accepted July 9, 2026 Available online September 25, 2026
or predictive, while lagging indicators are reactive and trailing (Kaassis and Badri, 2018). It is generally agreed that both leading and lagging indicators are needed. While lagging indicators are more widely used, a growing body of research has focused on leading indicators (Ali et al., 2022; Golabchi et al., 2024). Indicators can also be classified as active or passive; passive indicators address yes/no questions (e.g., does the organization have safety meetings?), while active indicators measure quantity and/or quality (e.g., frequency of safety meetings and participation rates of senior management in these meetings) (Alruqi and Hallowell, 2019; Bayramova et al., 2023).
The most commonly used safety indicators include total accidents, lost- time injury, injury without lost time, lost workdays, lost working hours, near- misses, proactive observations, number of reporting persons, safety audits, toolbox meetings, and training and education (Quentic, 2021; Sadeghi et al., 2025). Durmaz et al. (2025) described occupational health and safety (OHS) performance evaluation across four aspects: financial, customer, internal business processes, and learning and growth. The indicators in these aspects include for example, OHS-related investment costs, OHS culture, number of work accidents and near-miss events in certain periods, and the use of new technologies to measure and monitor occupational hygiene.
As noted above, near-miss reporting is one of the most commonly used leading indicators (Ali et al., 2022). As the term has several definitions, the concept of a near-miss event has been described in various ways (Gnoni and Lettera, 2012). For example, a near-miss has been defined as “a hazardous situation, event or unsafe act where the sequence of events could have caused an accident if it had not been interrupted” (Jones, Kirchsteiger and Bjerke, 1999). It has also been defined as “an opportunity to improve environmental, health and safety practice based on a condition, or an incident which could cause more serious consequence” (Phimister et al., 2003), or as an event that does not result in harm or damage to anyone, although it has the potential to do so (Gnoni et al., 2022).
When reporting near-misses, organizations often collect a wide range of data. In addition to basic information, such as location, time, task, and description of the near-miss, organizations use different categorizations. The literature provides examples of categorization approaches, including human factors analysis and classification system levels (Bicen and Celik, 2022); categories based on the immediate causes of accidents, such as plant/ process, environment, and organization (Fabiano and Currò, 2012); and classifications from the National Examination Board in Occupational Safety and Health (Al Shaaili et al., 2023).
The reporting and management of near-misses are important tasks in OHS management. Evaluating and monitoring system effectiveness are among the steps in near-miss management systems (NMS). However, little research has focused on these steps, and practices often differ due to the absence of standard guidelines for NMS. Information about specific approaches to each step of NMS is needed (Gnoni et al., 2022) Moreover, even though near-misses are among the most frequently used indicators, previous studies usually only mention the number of near-miss reports and do not provide detailed information about other types of metrics that can be used to monitor other aspects of near-miss incidents.
Monitoring and Indicators Related to the Safety Observation 707 To support the comprehensive monitoring and measurement of safety performance and the effectiveness of NMS, this study aims to provide information on the various aspects of safety observations that are monitored and used as safety indicators within organizations. Related experiences and development needs are also discussed. In this research, the term “safety observation”, informed by the literature and the practices of the case organizations, was used to cover not only events that have occurred but also potentially hazardous situations, such as unsafe acts and conditions.
MATERIAL AND METHODS A mixed-method design combining semi-structured interviews and an online survey was used to collect data for this study. First, semi-structured interviews were conducted in five Finnish case organizations participating in the study to identify the aspects monitored and measured in relation to safety observations, as well as the experiences associated with them. Second, the interview results were supplemented with a small online survey to obtain a broader picture of the most commonly monitored indicators related to safety observations. As part of a larger study on the role of safety observations in safety management, this substudy focused on monitoring processes and associated indicators.
The semi-structured interviews in five Finnish organizations were conducted between May 2024 and September 2024. The organizations represented various industries, thereby providing a broader perspective on safety observation processes and practices. The participating organizations included two from the manufacturing industry (an oil and gas research and development unit and a steel plant), a passenger and freight transportation company, an industrial scaffolding company, and a university. The number of personnel in the participating organizations ranged from 330 to 4,200. In total, 40 interviews were conducted with 64 interviewees who represented different roles in the safety observation process, including reporting, handling reports, utilizing data, and designing the process. Specifically, the interviewees comprised employees and their health and safety representatives (n = 22), managers or supervisors (n = 23), and safety/security managers, specialists, and other experts, such as human resource managers, system’s main users, and consultants (n = 19). Informed consent was obtained from all interviewees.
Most of the interviews were conducted remotely using Microsoft Teams or Google Meet (n = 24), while the remaining interviews were conducted face to face (n = 13) or in a hybrid format (n = 3). The average duration of the interviews was 50 minutes, with a range of 33–85 minutes. Half of the interviews were conducted individually, and half were conducted in groups. These interviews covered seven main themes related to different phases of the safety observation process: (1) definition and objectives, (2) guidance and instructions, (3) identification and reporting, (4) analysis of safety observations and preventive and corrective measures, (5) dissemination and utilization of information, (6) follow-up, and (7) encouragement and reward. The interview questions addressed current practices, best practices, and existing issues and development needs. Specifically, this study focused on
interview questions concerning the monitoring and measurement of safety observation process. The interview data were transcribed, and thematic analysis was employed.
The members of the association for experts specializing in safety, occupational well-being, and the working environment were invited to participate in an online survey conducted in March 2025. The survey link was distributed by email to all association members (n = 281), and a total of 22 members responded. The majority of the respondents (62%) represented the industrial sector; only a small number represented other sectors. Approximately half of the respondents were employed in large organizations (with more than 250 employees), while the remainder were employed in medium-sized organizations (with 50–250 employees). The survey themes included the analysis of safety observation reports and utilization of the collected data, measurement and monitoring, and development needs and beneficial aspects of the safety observation process. The survey consisted of three open-ended and five multiple-choice questions. This study focused on questions related to measurement and monitoring. The closed questions were analyzed using frequency distributions and data visualizations, and a thematic analysis was employed for the qualitative data.
RESULTS
Based on the interview results, the aspects monitored regarding safety observations in organizations were mainly grouped into three themes within the safety observation process: reporting activity, report handling, and corrective actions. Some other aspects related to, for example, the content of the reports were also mentioned in the interviews.
In all the organizations interviewed, the total number of safety observations was monitored. The number of observation reports was primarily considered an indicator of employee activity rather than a direct indicator of safety performance. The organizations aimed to encourage as many different individuals as possible to submit safety observation reports. Since the total number of reports alone does not reflect this, the organizations also monitored reporting activity using other indicators. These included reporting coverage (the proportion of the staff who have submitted reports), number of reports per person (the number of reports divided by the number of personnel or the actual number of reports each employee has made), and number of different or first-time reporters.
Regarding report handling, particular attention was paid to the progress of report processing. The interviewees stated that the organizations monitor response time (how quickly a report is taken into processing) and the status of reports. Indicators related to report status included the number or proportion of open reports (those still being processed) and the timelines of processing completion, such as the number of reports that had exceeded the deadline, those still within the deadline, and those closed within the allotted time. The processing time (the time taken to complete the handling) was also monitored. Usually, a report is closed and marked as completed when its processing is finished—that is, when the necessary information has been filled in, and decisions about actions have been made—even if the actions themselves have not yet been carried out. The implementation of the actions can be monitored separately.
Monitoring and Indicators Related to the Safety Observation 709 Regarding corrective actions, the organizations monitored both number and implementation. In addition to the total number of corrective actions, monitoring included the number of reports that contained suggestions for corrective actions and the number of reports for which actions had already been taken by the reporter at the time of reporting. Metrics relating to the realization of actions included the completion rate (the number or proportion of reports in which corrective actions had been completed) and delays (the number or proportion of reports in which actions had not been implemented by the deadline). Based on the interviews, the effectiveness of corrective actions was not specifically monitored and that it is instead reflected in the submission of new reports. That is, if a matter has been resolved, no further reports concerning it are expected to be submitted.
The interviewed organizations also monitored aspects related to report content. In this context, particular attention was paid to the reported hazards, their underlying causes, and potentially serious cases. Some organizations also tracked the number or proportion of positive observations (i.e., something beneficial in relation to safety) out of all observations, as well as the number, proportion, or coverage of subcontractor observations. In one organization, for example, whether the person submitting the report wished for the observation to be discussed in a group meeting was monitored. Moreover, safety observations can serve as one metric within broader safety indexes that incorporate multiple measures. For example, in one organization, a proactive safety work frequency index was used in which safety observations were one of the metrics.
The interview findings indicate that monitoring practices vary by organizational level, with different aspects of safety observations emphasized across levels. At the top management level, particular attention is paid to the total number of safety observations and overall reporting activity. In the safety management team and at the supervisor level, a broader range of aspects is monitored, such as the progress of report processing, the implementation of corrective actions, and the types of observations. In addition, the number of safety observations and reporting activity can be monitored at different levels (e.g., across the entire organization and by region, business unit, team, professional group, or subcontractor) and over various time periods (e.g., annually, quarterly, monthly, or continuously).
All the organizations interviewed set objectives or recommendations for the aspects being monitored. Most often, targets were established for the number of safety observation reports (e.g., one to three per person) or for reporting coverage (e.g., 50%–80%). The target or recommended timeframes for submitting reports were also set (e.g., as soon as possible and no later than within 1 day), handling reports (e.g., 7 days to 3 months), or implementing corrective actions. The recommended closure times ranged from 7 days to 3 months, although the implementation time for the required actions may be longer. An example of a target related to monitoring corrective actions was that implementation time is exceeded in no more than 10% of reports.
In the organizations interviewed, safety observations were part of proactive safety metrics. The interviewees considered it positive that the metrics also included indicators related to staff participation or activity. Safety observations, particularly their number or coverage, were viewed as a good metric in the sense that the employees themselves can influence the number of reports. However, the interviewees also pointed out that it is
important to consider what the data actually reveal or do not reveal, as well as the factors that may influence such data. The interviewees mentioned, for example, that competence affects what people can observe and report. In addition, in organizations in which the reporting coverage is good, there is often a higher overall level of safety activity. Moreover, the types of corrective actions can vary significantly, thereby affecting the time required to implement them. Therefore, many of the interviewees mentioned that there is a need to focus more on the quality of safety observations instead of just the number of reports, and to supplement quantitative indicators with qualitative information.
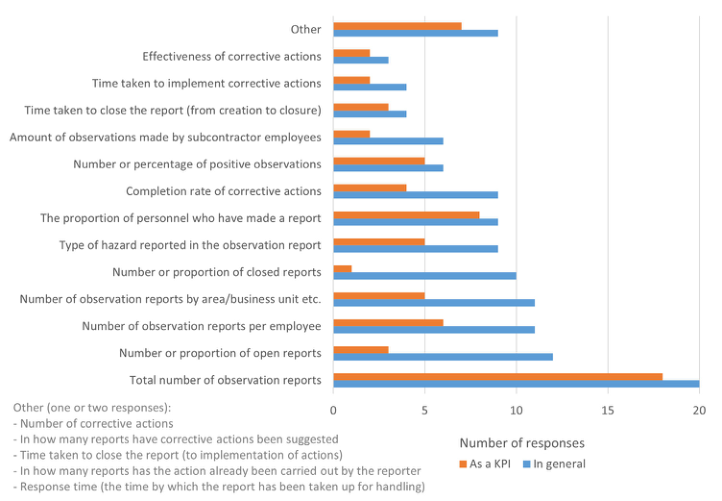
Figure 1 shows the results of the online survey. The most frequently monitored aspect of safety observations, both in general and as a key performance indicator (KPI), is the total number of observations. However, a diverse range of factors related to observations is monitored, as evidenced by the fact that all survey categories received responses, and the participants typically selected several different options. On average, the respondents selected five different aspects generally monitored in relation to safety observations within their organizations and three different options tracked as KPIs. Other commonly monitored aspects included reporting activity, the number of reports by area or business unit, the number of open reports, and the types of hazards reported. Not all respondents chose the total number of observations as a KPI. Instead, some selected options related to corrective actions taken and positive observations, as they considered KPIs that more broadly reflect the organization’s safety culture to be more meaningful measures.
Figure 1: Aspects monitored regarding safety observations according to the survey (n = 22).
DISCUSSION AND CONCLUSION This study provided information regarding the various aspects that organizations monitor in relation to safety observation process. These aspects included reporting activity, the progress of handling reports, and the number and implementation of corrective actions. It is understandable that organizations monitor these factors, as they are essential for the functionality of the safety observation process. Near-miss identification and reporting are central to the functioning of a near-miss management system, as they generate the information required for subsequent phases (Agnusdei et al., 2023; Hasanspahić et al., 2020). The timely and adequate processing of reports and the implementation of corrective measures are essential for transforming near-miss data into useful information for improving safety (Gnoni et al., 2022). Providing adequate responses and feedback to reports also helps maintain reporting motivation among personnel (Inagaki et al., 2024; Oswald, Sherratt and Smith, 2018). Based on the results, the effectiveness of actions was rarely monitored, which is notable given that this is considered a vital phase of the safety observation and follow-up process (DeLeo et al., 2023). Furthermore, the findings show that matters related to the use of information and learning were not specifically tracked in the organizations that participated in this study. This is consistent with previous research, which has found that organizations tend to pay less attention to the dissemination of information and organizational learning within NMS, even though these are also crucial for improving safety (Agnusdei et al., 2023; Mahmoud et al., 2023).
The results of this study indicate that organizations monitor different safety observation aspects at various levels, with top management focusing on overall reporting numbers, while safety teams and supervisors track additional details. Near-misses are one of the most commonly used proactive safety indicators (Sadeghi et al., 2025). However, the literature often mentions only the number of near-miss incidents as an indicator, whereas the results of the present study show that other metrics are also needed. For example, for NMS to support employee participation in safety and the development of a safety culture, it is important that as many staff members as possible participate in reporting (Hasanspahić et al., 2020). Therefore, the organizations participating in this study also monitored reporting activity using indicators other than the total number of reports.
The interviewees likewise emphasized the importance of qualitative information to supplement the interpretation of quantitative indicators, a finding that has also been recognized in previous studies on safety indicators (Bayramova et al., 2023; Golabchi et al., 2024; Xu et al., 2021). Notably, some respondents preferred KPIs that highlighted corrective actions and positive observations over the total number of reports alone, believing that these more accurately represented the organization’s overall safety culture. While most research focuses on traditional near-miss approaches, there is increasing interest in proactive approaches such as Safety II, which emphasizes learning from successful outcomes (Gnoni et al., 2022). Positive safety observations have been recognized as a promising yet thus far understudied tool for proactive safety management, grounded in the principles of Safety II (Nenonen et al., 2026).
This study contributes to the literature by identifying and categorizing the range of indicators organizations use to monitor the safety observation process. Earlier studies have mainly identified the occurrence of near-miss incidents and their number as key indicators. However, the present study revealed that safety observations can be tracked much more comprehensively in several different ways. In practice, organizations can use the examples provided in this study to monitor, assess, and develop the effectiveness of their safety observations and safety management processes.
The main limitation of this study is the small number of organizations participating in the interviews and survey. Although the organizations represented several industries, a large proportion of the survey respondents worked in the industrial sector. However, the results of the interviews and the survey complemented each other, and the interviewees came from different organizations and backgrounds. The findings also reached saturation, lending additional credibility to the results. Nevertheless, further studies are needed to validate and generalize the results across a broader range of organizations and industries.
ACKNOWLEDGMENT
The authors acknowledge the Finnish Work Environment Fund, Tampere University, and the participant organizations for funding this research. The authors are also grateful for the contributions of all the interviewees and survey respondents.
REFERENCES
Agnusdei, G. P., Gnoni, M. G., Tornese, F., De Merich, D., Guglielmi, A. and Pellicci, M. (2023) ‘Application of near-miss management systems: An exploratory field analysis in the Italian industrial sector’, Safety, 9(3), p. 47. doi.org/10.3390/ safety9030047. Ali, M. X. M., Arifin, K., Abas, A., Ahmad, M.A., Khairil, M., Cyio, M. B., Samad,
M. A., Lampe, I., Mahfudz, M. and Ali, M. N. (2022) ‘Systematic literature review on indicators use in safety management practices among utility industries’, International Journal of Environmental Research and Public Health, 19(10), p. 6198. doi.org/10.3390/ijerph19106198. Alruqi, W. M. and Hallowell, M. R. (2019) ‘Critical success factors for construction safety: Review and meta-analysis of safety leading indicators’, Journal of Construction Engineering and Management, 145(3), p. 04019005. doi. org/10.1061/(ASCE)CO.1943-7862.0001626. Al Shaaili, M., Al Alawi, M., Ekyalimpa, R., Al Mawli, B., Al-Mamun, A. and
Al Shahri, M. (2023) ‘Near-miss accidents data analysis and knowledge dissemination in water construction projects in Oman’, Heliyon 9(11), p. e21607. doi.org/10.1016/j.heliyon.2023.e21607. Bayramova, A., Edwards, D. J., Roberts, C. and Rillie, I. (2023) ‘Constructs of leading indicators: A synthesis of safety literature’, Journal of Safety Research, 85, pp. 469–484. doi.org/10.1016/j.jsr.2023.04.015. Behn, R. D. (2003) ‘Why measure performance? Different purposes require different
measures’, Public Administration Review, 63, pp. 586–606. doi.org/10.1111/1540- 6210.00322.
Monitoring and Indicators Related to the Safety Observation 713 Bicen, S. and Celik, M. (2022) ‘A hybrid approach to near-miss report investigation
towards next-generation safety solutions on-board ships’, Ocean Engineering, 266(1), p. 112768, doi.org/10.1016/j.oceaneng.2022.112768. De Leo, F., Elia, V., Gnoni, M. G. and Tornese, F. (2023) ‘Integrating Safety-I and Safety-II approaches in near miss management: A critical analysis’, Sustainability, 15(3), Article 2130. doi.org/10.3390/su15032130. Durmaz, E. D., Adem, A. and Gölcük, I. (2025) ‘A comprehensive framework for
occupational health and safety performance measurement: Integrating balanced scorecards and fuzzy best–worst method’, International Journal of Information Technology & Decision Making, pp. 1–42. doi.org/10.1142/S0219622025500841. Fabiano, B. and Currò, F. (2012) ‘From a survey on accidents in the downstream oil industry to the development of a detailed near-miss reporting system’, Process Safety and Environmental Protection, 90(5), pp. 357–367. doi.org/10.1016/j. psep.2012.06.005. Gnoni, M. G., Tornese, F., Guglielmi, A., Pellicci, M., Campo, G. and De Merich,
D. (2022) ‘Near miss management systems in the industrial sector: A literature review’, Safety Science, 150, p. 105704. doi.org/10.1016/j.ssci.2022.105704. Gnoni, M. G. and Lettera, G. (2012) ‘Near-miss management systems: A methodological comparison’, Journal of Loss Prevention in the Process Industries, 25(3), 609–616. https://doi.org/10.1016/j.jlp.2012.01.005. Golabchi, H., Abellanosa, A.D., Lefsrud, L., Pereira, E. and Mohamed, Y. (2024)
‘A comprehensive systematic review of safety leading indicators in construction’, Safety Science, 172, p. 106433. doi.org/10.1016/j.ssci.2024.106433. Hasanspahić, N., Frančić, V., Vujičić, S. and Maglić, L. (2020) ‘Reporting as a key element of an effective near-miss management system in shipping’, Safety 6(4), Article 53. doi.org/10.3390/safety6040053. Inagaki, M., Nagata, T., Odakami, K., Adi, N. P. and Mori, K. (2024) ‘Relationship
between a company’s adequate response to near-misses and occupational accidents: A 1-year prospective cohort study’, Journal of Occupational Health, 66(1), p. uiae053. doi.org/10.1093/joccuh/uiae053. Jones, S., Kirchsteiger, C. and Bjerke, W. (1999) ‘The importance of near miss reporting to further improve safety performance’, Journal of Loss Prevention in the Process Industries, 12(1), pp. 59–67. doi.org/10.1016/S0950-4230(98)00038-2. Jääskeläinen, A., Tappura, S. and Pirhonen, J. (2022) ‘The path toward successful
safety performance measurement’, Journal of Safety Research, 83, pp. 181–194. doi.org/10.1016/j.jsr.2022.08.014. Kaassis, B. and Badri A. (2018) ‘Development of a preliminary model for evaluating occupational health and safety risk management maturity in small and medium- sized enterprises’, Safety, 4(1), p. 5. doi.org/10.3390/safety4010005. Mahmoud, H. A., Thavorn, K., Mulpuru, S., McIsaac, D., Abdelrazek, M. A.,
Mahmoud, A. A. and Forster, A. J. (2023) ‘Barriers and facilitators to improving patient safety learning systems: A systematic review of qualitative studies and meta-synthesis’, BMJ Open Quality, 12(2), p. e002134. doi.org/10.1136/bmjoq- 2022-002134. Nenonen, N., Pulkkinen, J. and Lindholm, M. (2026) ‘The role of positive safety observations in safety management’, in Baptista, J. S. et al. (eds.) Occupational and environmental safety and health VII. Studies in systems, decision and control. Vol. 617. Cham: Springer. In process. Oswald, D., Sherratt, F. and Smith, S. (2018) Problems with safety observation
reporting: A construction industry case study’, Safety Science, 107, pp. 35–45. doi.org/10.1016/j.ssci.2018.04.004.
Phimister, J. R., Oktem, U., Kleindorfer, P. R. and Kunreuther, H. (2003) Near-miss incident management in the chemical process industry’, Risk Analysis, 23(3), pp. 445–459. doi.org/10.1111/1539-6924.00326. Quentic. (2021) Incident management: Data, facts and figures, from A to Z.
Available at: https://www.quentic.com/articles/incident-management-data-facts- and-figures-from-a-to-z/ (Accessed: 14 April 2026). Sadeghi, H., Mohandes, S. R., Yunusa-Kaltungo, A., Cheung, C. and Manu, P. (2025) ‘A state-of-the-art review of safety leading indicators across diverse industries’, Journal of Safety Science and Resilience, p. 100272. doi.org/10.1016/j. jnlssr.2025.100272. Sinelnikov, S., Inouye, J. and Kerper, S. (2015) ‘Using leading indicators to measure
occupational health and safety performance’, Safety Science, 72, pp. 240–248. doi.org/10.1016/j.ssci.2014.09.010. Xu, J., Cheung, C., Manu, P. and Ejohwomu, O. (2021) ‘Safety leading indicators in construction: A systematic review’, Safety Science, 139, p. 105250. doi. org/10.1016/j.ssci.2021.105250.
FIND THE COMPLETE VOLUME IN THE AHFE DIGITAL BOOKSTORE
Explore the complete digital volume
Human Systems Engineering and Design (IHSED2026): Future Trends and Applications
Read this individual research paper free through the original publisher, or explore the full digital proceedings book.