Jerzy Grobelny, Rafał Michalski, Kalina Maria Świątek-Romek, Monika Marciniak (2018). The Influence of the Brain Lateralization on Preferences Related to the Simple Digital Signage Message. In: Advances in Human Factors and Sustainable Infrastructure. AHFE Open Access, vol. 3. https://doi.org/10.54941/ahfe100096
This paper presents research concerned with how people perceive and subjectively assess various digital signage messages consisting of a simple image and one word text. Three independent factors were manipulated including: the background color (white and black), the text font size (36 and 72 points), and, finally, the image location (to the left and right hand side of the text). The examination involved 70 participants – 40 women and 30 men. The pairwise comparisons based on Analytic Hierarchy Process developed by Saaty were employed to produce the subjects’ preferences. The obtained results indicated considerable differences in relative weights towards examined factors. However, the consistency indices occurred to be significant and suggested that probably participants had difficulties in specifying coherent likings.
Recently, marketing activities very often take advantage of the latest digital developments in presenting the marketing content both in public urban environment and such publicly available indoor buildings as railway stations, airports or shopping malls. Although the use of various digital signage displays is becoming more and more popular there is relatively little research concerned with how various graphical aspects of the marketing message influence customers’ perception. There are, naturally, general investigations related with graphical displays, however few of could be directly applied in this specific context. Therefore, there is a need for verifying whether previously elaborated theories apply to this specific domain of marketing.
This research is especially focused on the brain lateralization effect. It is widely believed that the human brain hemispheres are to a certain extent specialized. The right hemisphere is better suited to process pictorial information while the left one is more logical. A number of studies supported this view including, for instance, Hellige (1980, 1990), Beaumont (1985), Janiszewski (1990). It is interesting if this effect works also in conjunction with other factors and how they influence the potential customers’ preferences. Since the typical digital signage screen usually contains some text and images we have decided to additionally differentiate the experimental conditions by the background color, font size, and the relative location of an image and the text.
METHOD
Participants A total of 70 students of Wrocław University of Technology took part in the experiment. There were 40 female participants and 30 males. The subjects were young as more than 90% of them were less than 30 years old. The detailed age ranges are demonstrated in Table 1.
Table 1. Age ranges of participants.
Table available in the original PDF paper.
Share
Age (years)
(%)
No of subjects < 20 4 3 20-29 89 62 30-39 6 4 > 40 1 1
Experimental design and procedure Three independent variables were manipulated in this study, that is, Background color, Font size and Graphics location. All of the factors were examined on two levels. The full factorial design was applied, so the factors produced eight experimental conditions. The details of all the factor levels are put together in Table 2.
Table 2. Factors and factor levels used in this study.
Table available in the original PDF paper.
Factor Factor levels Background color White Black
Font size Small – 36 pixes Big – 72 pixes Graphics location Left Right
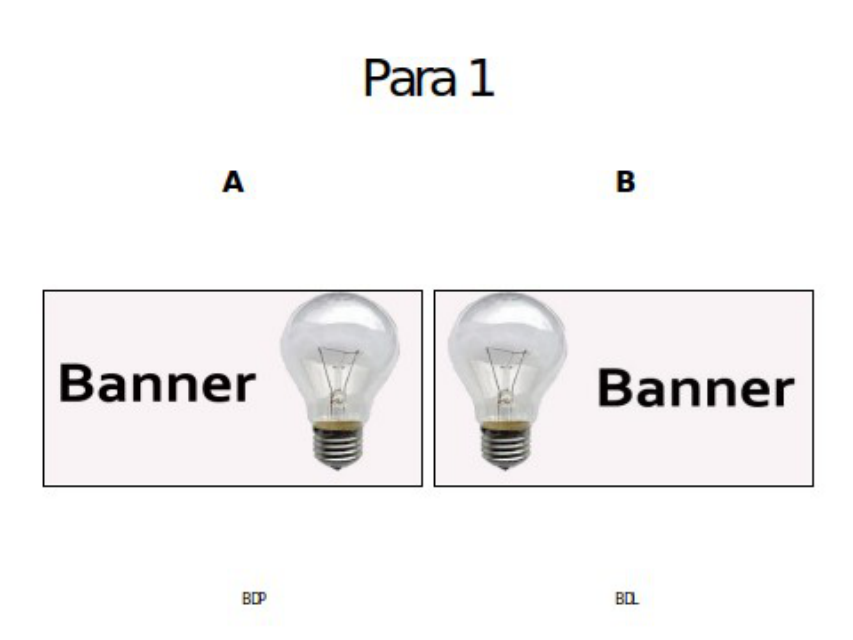
The overall time needed to complete the questionnaires amounted to about 9 minutes. The number of possible pairwise comparisons depend on the number of investigated variants according to the following formula (n2-n)/2, thus given eight experimental conditions it was equal 28 in this study. Each of the necessary comparison was presented twice. For each pair, at first the given experimental variant was located on the left hand side of the screen while later on the right side.
Figure 1. One of possible pairwise comparisons used in the present research.
The subjects expressed their opinion by means of the verbal statements whereas the necessary calculations were based on numerical values presented in Table 3.
Table 3. The verbal and numerical scale applied in the study No Scale Numerical value
Table available in the original PDF paper.
1. Equally preferred (Hardly to say) 1 2. Rather preferred 3 3. Preferred 5 4. Decidedly preferred 7
The dependent measure reflected the subjective preferences expressed by examinees and were obtained according to the Analytic Hierarchy Process (Saaty, 1978) framework and was based on obtaining the eigenvectors of the pairwise comparison matrices. The vector of weights includes values ranged from zero to one therefore their mean values are demonstrated as percentages. The bigger the weight, the more preferred the given variant was.
RESULTS AND DISCUSSION
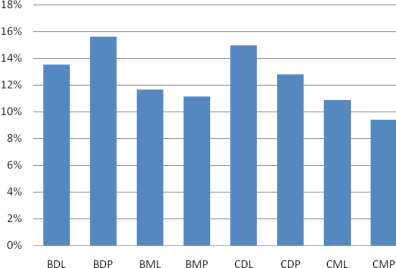
The obtained overall results in the form of average values of preferences towards examined variants are presented in Table 4. The sixth column contains data for all of the subjects taking part in the examination while the last column presents relative weights of participants exhibiting strong consistency in their ratings. These two set of results are respectively presented in Figures 2 and 3.
Table 4. Overall results for all subjects and subjects having strongly consistent preferences Experimental condition Consistent subjects
Table available in the original PDF paper.
No.
Symbol
All subjects mean weights
mean weights
Font
Graphics
Equation reproduced from the original PDF.
color
size
location
1. White 72 Left BDL 13.5 11.3 2. White 72 Right BDP 15.6 6.66 3. White 36 Left BML 11.7 13.3 4. White 36 Right BMP 11.1 10.7 5. Black 72 Left CDL 15.0 18.5 6. Black 72 Right CDP 12.8 17.6 7. Black 36 Left CML 10.9 10.6 8. Black 36 Right CMP 9.39 11.3
Figure 2. All subjects mean weights (%, n=70) Figure 3. Consistent subjects mean weights (%, n=37)
According to the computed mean preference weights, the most preferred by subjects variant was the one with white background, big text, with the image located on the right hand side of the graphical message. On the other hand, the least liked variant had a black background, small fonts, and the image situated near the right edge. The difference between the best and the worst rated condition amounted 6.12%. Looking at the Figure 2 results one may observe general tendency of giving higher scores to variants with big text as compared to variants where the small fonts were employed. This finding is in concordance with the results reported by Bernard et al. (2003) and Michalski et al (2006) as well as in other studies dealing with font sizes e.g. Tullis et al. (1995) or Ramadan (2011).
At the same time among small text conditions participants preferred more the images located near the left than the right border. Similar effect was observed for big fonts with black backgrounds conditions. This, in turn, is consistent with a number of scientific reports on a brain hemisphere lateralization such as Beaumont (1985), Janiszewski (1990), Rettie and Brewer (2000). However the reversed preferences for variants with a big text and white background do not support this theoretical conjecture coming from more general psychological and physiological studies. This surprising outcome certainly requires further research.
As the first step towards this, we repeated our calculations only on the subjects exhibiting strong consistencies in their pairwise comparisons. This was assessed by computing for every participant Consistency Ratio indicators according to the AHP framework. The results based only on these participants presented in Figure 3 show similar pattern of the dominance of variants with image located on the left hand side over those with images near the right border. The only exception are the variants with a black background and small texts, however the difference here is relatively small and probably it might be not relevant – this naturally should be checked by appropriate statistical methods and supplemented by additional investigations.
The obtained results regarding background colors are inconsistent since for all of the subjects the effect has little impact on the final preferences and the differences could be attributed to other factors. The situation is different while we analyze only subjects with a greater degree of consistency. Here it seems that the variants with black background are generally better perceived.
CONCLUSIONS
This study results confirmed that such simple graphical factors as the background color, font size and image versus text location may considerably influence the subjects’ preferences. Generally, the findings show that results of the basic research coming from other fields of science should be repeated and confirmed in more real life problems.
The obtained outcomes seem to be promising and should certainly be continued and more thoroughly investigated. Further analysis of the presented data, including for instance analysis of variance, are required to show whether the examined factors statistically significantly differentiate the mean preference weights. Furthermore, as it is suggested by Grobelny and Michalski (2011), methods such as conjoint or factor analyses may provide more insights into the structures of preferences. The discrepancies between results suggest that there might be groups of subjects having specific preference structures. Therefore, an additional cluster analysis could be employed to verify this hypothesis.
ACKNOWLEGEMENTS The work was partly financially supported by the Polish National Science Center grant no. 2011/03/B/HS4/03925
REFERENCES
Beaumont, J. G. (1985). Lateral organization and aesthetic preference: The importance of peripheral visual asymmetries.
Neuropsychologia, 23(1), 103–113. doi:10.1016/0028-3932(85)90048-X Bernard, M. L., Chaparro, B. S., Mills, M. M., & Halcomb, C. G. (2003). Comparing the effects of text size and format on the readibility of computer-displayed Times New Roman and Arial text. International Journal of Human-Computer Studies, 59(6), 823–835. doi:10.1016/S1071-5819(03)00121-6 Grobelny, J., & Michalski, R. (2011). Various approaches to a human preference analysis in a digital signage display design.
Human Factors and Ergonomics in Manufacturing & Service Industries, 21(6), 529–542. doi:10.1002/hfm.20295 Hellige, J. B. (1980). ERIC/ECTJ Annual review paper: Cerebral hemisphere asymmetry: Methods, issues, and implications.
Educational Communication and Technology, 28(2), 83–98. Hellige, J. B. (1990). Hemispheric asymmetry. Annual Review of Psychology, 41(1), 55–80.
doi:10.1146/annurev.ps.41.020190.000415Janiszewski, C. (1990). The influence of print advertisement organization on affect toward a brand name. Journal of Consumer Research, 17(1), 53–65. Janiszewski, C. (1990). The influence of print advertisement organization on affect toward a brand name. Journal of Consumer Research, 17(1), 53–65.
Michalski, R., Grobelny, J., & Karwowski, W. (2006). The effects of graphical interface design characteristics on human– computer interaction task efficiency. International Journal of Industrial Ergonomics, 36(11), 959–977. doi:10.1016/j.ergon.2006.06.013 Ramadan, M. Z. (2011). Evaluating college students’ performance of Arabic typeface style, font size, page layout and
foreground/background color combinations of e-book materials. Journal of King Saud University - Engineering Sciences, 23(2), 89–100. doi:10.1016/j.jksues.2011.03.005 Rettie, R., & Brewer, C. (2000). The verbal and visual components of package design. Journal of Product & Brand Management, 9(1), 56–70. doi:10.1108/10610420010316339 Saaty, T. L. (1977). A scaling method for priorities in hierarchical structures. Journal of Mathematical Psychology, 15(3), 234–
281. doi:10.1016/0022-2496(77)90033-5 Tullis, T. S., Boynton, J. L., & Hersh, H. (1995). Readability of Fonts in the Windows Environment. In Conference Companion on Human Factors in Computing Systems (pp. 127–128). New York, NY, USA: ACM. doi:10.1145/223355.223463
LISTED IN THE AHFE DIGITAL BOOKSTORE CATALOGUE
Explore the complete digital volume
Advances in Human Factors and Sustainable Infrastructure
Read this individual research paper free through the original publisher, or explore the full digital proceedings book.
ISBN 978-1-4951-2092-3
Explore this ISBN in the AHFE Bookstore ↗Listed in the July 2026 bookstore catalogue; search by ISBN to confirm current availability · Digital book purchase optional