Peter Barraclough, Anders af Wåhlberg, James Freeman, Jeremy Davey, Barry Watson (2021). Real or Imagined? A Study Exploring the Existence of Common Method Variance Effects in Road Safety Research. In: Advances in Human Aspects of Transportation: Part I. AHFE Open Access, vol. 15. https://doi.org/10.54941/ahfe100633
Common method variance (CMV) has received little attention within the field of road safety research despite a heavy reliance on self-report data. Two surveys were completed by 214 motorists over a two-month period, allowing associations between social desirability and key road safety variables and relationships between scales across the two survey waves to be examined. Social desirability was found to have a strong negative correlation with the Driver Behaviour Questionnaire (DBQ) sub-scales as well as age, but not with crashes and offences. Drivers who scored higher on the social desirability scale were also less likely to report aberrant driving behaviours as measured by the DBQ. Controlling for social desirability did not substantially alter the predictive relationship between the DBQ and the crash and offences variables. The strength of the correlations within and between the two waves were also compared with the results strongly suggesting that effects associated with CMV were present. Identification of CMV would be enhanced by the replication of this study with a larger sample size and comparing self-report data with official sources.
Research on driver behaviours and attitudes is generally conducted through the use of self-report surveys and interviews. Despite this, little attention has been given to the potential confounding effects of common method variance (CMV) which is understood to be present when survey participants provide systematic responses to a range of questionnaire items on a basis that is different to the actual effect that the survey items are intended to measure (Paulhus, 1991).
CMV can occur when both the predictors and the predicted variables are gathered and analysed in the same manner from the same source, as is often the case in studies which utilise self-report data (Podsakoff, MacKenzie, Lee & Podsakoff, 2003). Response bias introduced by CMV effects can distort findings by artificially strengthening or weakening the observed relationships between items of interest (Reio, 2010). Method effects produced by using a common source or rater include: Social desirability, Leniency biases, Acquiescence biases (yea-saying and nay- saying), Mood states and Consistency motif (e.g., reflecting a desire on the part of study participants to appear consistent and rational in their responses). In addition, Measurement and Item context effects with the potential to distort findings include: Item ambiguity, Common scale formats and issues arising when the predictor and criterion
variables are measured at the same point in time or using the same medium (see Podsakoff et al., 2003). Addressing the potential effects of this distortion on study findings remains problematic for researchers.
The best known form of the common method variance is social desirability (SD), which is associated with an attempt on the part of the respondent to make a favourable impression (Paulhus, 1991). Social desirability has also come to be understood as consisting of two components. One element, impression management, is the desire on the part of respondents to provide distorted answers to be more favourably perceived by others while the second, self- deception, involves unconsciously produced erroneous responses serving to enhance an individual’s self-image (Ashley and Holtgraves, 2003, Paulhus, 1984; Sackeim and Gur, 1978). Impression management is considered likely to occur in those situations in which an individual feels that their responses to survey questions may be used to assess their own abilities or behaviours (such as in job interviews or remedial programs for traffic offenders). However some researchers believe SD is better understood as a substantive personality trait rather than a reflection of the environment in which the study was conducted (Kurtz, Tarquini, and Iobst, 2008; McCrae, 1986; McCrae and Costa, 1983; Uziel, 2010). For example, Uziel (2010) argues that impression management scales are unsatisfactory as measures of response style, and instead should be considered in terms of the degree to which these scales capture: a defensiveness trait, indicating a vulnerable self-esteem or; an association with personal well-being and interpersonal adjustment. Uziel’s analysis of studies examining social behaviour, health, affect and wellbeing, and job performance lead to a finding that impression management scales tend to provide a measure of an adjustment approach.
Given that driving and traffic safety has a social value in most cultures, the likely presence of CMV, and social desirability in particular, represents an ongoing concern. Within traffic psychology, items to detect social desirability are rarely present. It has been argued that measurements of social desirability should be included in traffic studies that utilise self-report data, particularly self-reported crashes (af Wåhlberg, Dorn and Kline, 2010).
Lie Scales and usage in road safety Social desirability is usually measured by way of lie scales, the most widely used being the Marlowe-Crowne (MC) social desirability scale (Crowne and Marlowe, 1960). Such scales require respondents to answer questions with a definitive moral element, posited in a rather extreme manner. Individuals whose responses indicate exaggerated levels of compliance with what are held to be unreasonably high moral standards are deemed to have responded in a socially desirable manner. In this sense SD scales can be regarded as measuring stable CMV effects, i.e. responses that reflect consistent personality traits of individuals.
Some preliminary research has been conducted into social desirable responding and traffic safety. For example, the Driver Social Desirability Scale (Lajunen, Corry, Summala and Hartley, 1997) was designed to measure social desirability within a road safety setting. It has been found at times to be positively correlated with recorded accidents while negative correlations have been observed in relation to self-reported crashes (af Wåhlberg, Dorn, and Kline, 2010). This is in line with previous research in which linkages between standard lie scales and self-reported crashes were observed but no associations were found when measured against independently recorded traffic data (Donovan, Queisser, Salzberg and Umlauf, 1985; Jamison and McGlothlin, 1973; Smith, 1976; Williams, Henderson and Mills, 1974). However it must be noted that the correlations were very low, suggesting that there is no meaningful association between lie scale responding and recorded accidents.
Harrison (2010) surveyed recently licensed drivers from Victoria and found small but statistically significant correlations between a subset of the Marlow-Crowne Social Desirability scale and a range of items including self- perception of driving ability, driving at high speeds; the incidence of risky driving behaviours including speeding and mobile phone use; crash involvement; and the Manchester Driver Behaviour Questionnaire (DBQ) such as the Violations and Lapses Scale (Reason, Manstead, Stradling, Baxter & Campbell, 1990). The results suggest that some respondents are at times motivated to provide an overly positive impression of their behaviour and attitudes in regards to road safety.
In his recent study of young drivers in the UK, af Wåhlberg (2010) also used a repeated measures approach in which participants in one wave were hypothesised to be inclined to provide positive responses. The study found substantial correlations between the Driver Impression Management scale and a range of behaviour scales including the Driving Anger Scale and the DBQ violation scale. Consistent with previous research social desirability was found to be associated with self-reported traffic offences.
Unstable CMV effects Given that one manifestation of method bias has been proposed to occur when data is drawn exclusively from a single source, the current study also plans to test unstable CMV effects. It has been suggested that this can be achieved by comparing differences in the strength of the correlations reported in and across the two survey waves, relative to the location of the items being examined. It has been argued (af Wåhlberg, 2009) that if CMV effects are present, the correlations observed within each wave will be stronger than the corresponding correlations occurring between two survey waves. The DBQ subscales are also of particular interest in this regard, given that the use of combining scales to form a battery also produces a more robust effect than that obtained using individual items, allowing researchers to more accurately assess possible effect sizes and measure traits not apparent when correlations between individual items are used (Rushton Brainerd and Pressley, 1983).
STUDY AIMS The current study has three primary aims: (a) to measure the relationship between SD and self-reported driving history as measured by the DBQ, crash and fine history (b) to determine whether the presence of SD is consistent across time and (c) the extent to which unstable effects associated with CMV may be present.
METHOD
Participants and Procedure A total of 249 general Queensland motorists responded to an e-mail promotion of the study. Data was collected over a six-month period (Sept 2011 to Feb 2012) with participants having a choice of completing an on-line or paper- based version of the questionnaire. No between-group differences were found in responses between the different data collection methods. After completing the initial questionnaire (Time 1) participants were sent the same questionnaire two months later (Time 2). Participants received payment in the form of a gift voucher valued at $10 on following the receipt of each survey.
Materials
Marlow-Crowne Scale: Social desirability was measured using a five item subset of the Marlow-Crowne scale, recorded on a five point likert scale. Four items of the scale employed in this study are also found in the Balanced Inventory of Desirable Responding (BIDR) impression management scale with one item from the BIDR self- deceptive enhancement scale (Paulhus and Reid, 1989). Although the use of lie scales is generally conducted using dichotomous variables, the BIDR has also been found to be responsive when using continuous scoring mechanisms (Stöber, Dette and Musch, 2002). Responses to the lie scale were recorded so that a high score was indicative of a greater degree of social desirability.
Driver Behaviour Question (DBQ): The 20-item version of the DBQ was utilised to measure different types of driving behaviours within the driving population. The version also included minor re-wording of some items to make it more representative of Australian driving conditions (see Freeman, Barraclough, Davey, af Wåhlberg and Watson, 2013).
Anchor items: Five anchor items not associated with aberrant driving behaviour (the items addressed issues of general car care) were also included in the survey. The use of anchor scales (or marker variables) involves considering the observed relationships between items theoretically unrelated to the constructs of interest in reference to possible CMV effects (Podsakoff et al., 2003). It was hypothesised that correlations between unrelated items (e.g., DBQ and anchor items) would be evidence of CMV effects.
Demographic information was also collected as well as crash and violation history. To ascertain respondent’s crash history, participants were asked the total number of crashes experienced within the last 3 years and the total number of crashes experienced over their lifetime. A crash described as any incident involving a motor vehicle that resulted
in damage to a vehicle, property or injury. Offence history measured the number of occasions participants had been fined or lost demerit points for traffic offences in the last 3 years, excluding parking offences.
Characteristics of the sample A total of 249 general motorists responded to the initial survey and 214 completed a second survey two months later, producing a response rate for the completion of both surveys of 86%. The analysis for the current study examined data supplied only by respondents who completed both surveys. Of the participants who completed both surveys, 80 (37.4%) were male and 134 (62.6%) female. The average age of respondents was 37.3 years (range 18- 65), and the average time licensed was 18.9 years (range 1-48).
The majority of participants reported experiencing a crash at some point in their lifetime (68%) and drivers within this group reported involvement in an average 2.61 crashes over this period (range 1-10). Over half of all drivers (52.9%) reported involvement in more than one crash in their lifetime. Under a third a third (29.4%) of respondents had a crash in the past three years with these drivers reporting involvement in an average of 1.37 crashes during this period with 7.1% of all respondents involved in more than one crash. The mean of crashes over the past three years for the entire sample was 0.44 (Std .771). In relation to traffic offences, one third (32.6%) of study participants had lost demerit points in the past three years, on an average of 1.73 occasions. The mean of offences over the past three years for the entire sample was 0.63 (Std 1.066).
RESULTS
Stability The results in relation to the Cronbach’s alpha reliability coefficients and mean scores for the DBQ are generally comparable with previous research in Australia and New Zealand, including the finding of speeding violations being the most frequent aberrant behaviour reported by the sample (for full analysis of first survey wave see Freeman et al., 2013). The stability of responses over time is shown in Table 1. Mean values, standard deviations, dependent t- tests and differences between waves (wave 1 std as denominator) are presented. Also shown are the number of items in each scale and the Cronbach alphas for the scales in each wave.
Table 1. Descriptive statistics for scales for Waves 1 and 2. (N=214) Scale Numbe Wave 1 Wave 2 Effect r of items in scale
Table available in the original PDF paper.
m/std [Equation or mathematical symbol available in the original paper PDF] m/std [Equation or mathematical symbol available in the original paper PDF] t difference
The Cronbach alpha scores tended to be higher at Time 2. The mean scores reveal that respondents tended to provide favourable assessments of their own behaviours and actions. The DBQ Highway Violations subscore had the biggest variation across the two waves. While the differences between means were minor they were in most instances found to be significant. It is interesting to note that no significant differences were found between the means of the lie scales or for that matter between the anchor items, between the two survey waves.
Social desirability and socio-demographics
Between groups analyses were undertaken to determine the relationship between SD and socio-demographic characteristics. The mean social desirability score for men was 3.76 (SD = .68) and the mean for women was 3.81 (.59) with the difference within gender found to be statistically non-significant [ t (214) = -.663, p < 1, ns]. Analysis of the relationship between age and social desirability scores showed a significant correlation of .166 (p = .015). This measurement indicates that older drivers display a greater concern for how they present socially than younger drivers (i.e. their responses are more likely to be influenced by social desirability).
An ANOVA analysis was conducted to further explore the relationship between age, gender and social desirability, with respondents’ ages grouped as under 25 years, 26 to 29 years, 30 to 39 years, 40 to 54 years, and drivers aged 55 or older. Although the observed trend was consistent with the correlation findings, in that the means score for social desirability were progressively lower within each age grouping, these differences were not significant. It must be noted that the overall differences between men (M = 3.76, SD = .681) and women (M = 3.81, SD = .589) were slight, with the largest difference between means observed among drivers aged between 40 and 54: men (M = 3.72, SD = .728); women (M=4.00, SD = .530). Women aged between 40 and 54 provided the highest mean scores for social desirability, suggesting that this cohort are more disposed than other groups to have a higher degree of concern for how they present socially, although again, these findings were not statistically significant.
No significant correlations were observed in regard to exposure to the road (hours driven weekly and kilometers driven weekly) and responses to the social desirability items (results not shown).
Anchor items
Five items not associated with aberrant driving behaviour (the items addressed issues of general car care) were also included in the survey to examine the extent of the reported relationship between theoretically unrelated items. The mean of these items was calculated to create an anchor variable for the purpose of facilitating a comparison with variables understood to have greater predictive capacity.
Firstly, the correlation between the anchor scales across T1 and T2 was strong (r = .662 p < .001). Secondly, men were found to have higher average mean scores for anchor items (M=3.23, SD = 1.131) than women (M = 2.840, SD = .940) with this difference statistically significant [ t (214) = 2.572, p = .011], although this only indicates that they are more likely that women to engage in car care activities. The bivariate relationships between participants’ anchor scores and social desirability, age, crashes and offences history were examined. The correlations were generally not strong, ranging from .009 (age) to .218 (DBQ Aggressive Violations). The bivariate analysis showed small but statistically significant correlations of .146 between the anchor items and offences incurred in the past three years (p = .033) and .218 between these items and the DBQ Aggressive violations scale (p = .001). However a comparison of correlations related to the anchor items and correlations between other items (see Table 2) shows that effects associated with anchor items, including those found to be statistically significant, were generally lower than those between recognised road safety variables.
Proceedings of the 5th International Conference on Applied Human Factors and Ergonomics AHFE 2014, Kraków, Poland 19-23 July 2014 Edited by T. Ahram, W. Karwowski and T. Marek
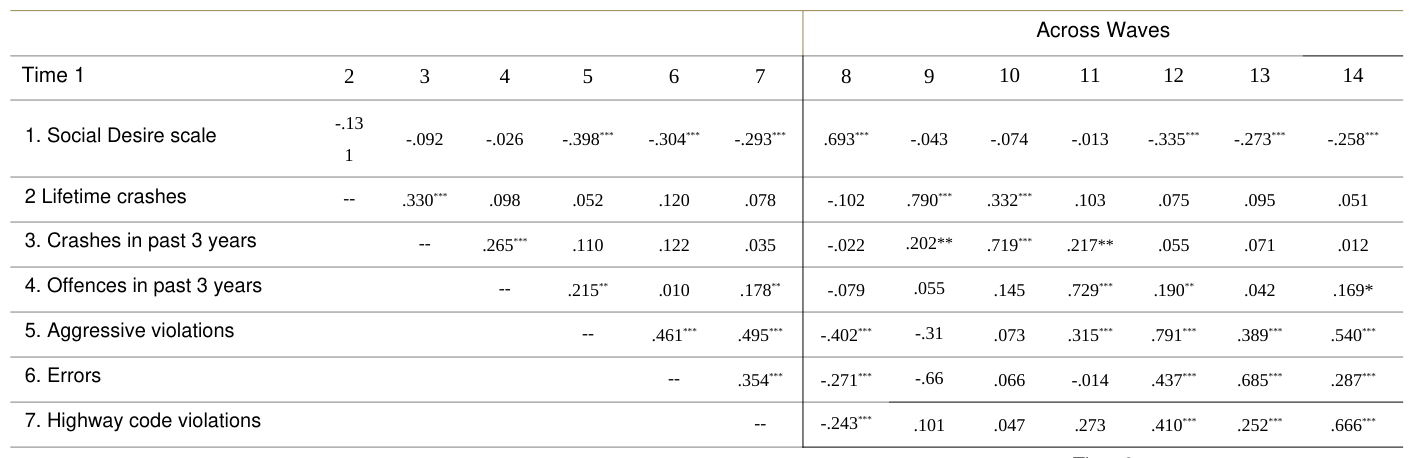
Table 2. Pearson correlations between the major driving variables for Time 1and Time 2 Across Waves
10. T2 Crashes in past 3 years -- .281*** .001 .019 .076
11. T2 Offences in past 3 years -- .287*** .082 .321***
12. T2 Aggressive violations -- .575*** .613***
13. T2 Errors -- .470***
14. T2 Highway code violations --
*p < .05, ** p < .01, ***p < .001
https://openaccess.cms-conferences.org/#/publications/book/978-1-4951-2097-8 Human Aspects of Transportation I (2021)
Proceedings of the 5th International Conference on Applied Human Factors and Ergonomics AHFE 2014, Kraków, Poland 19-23 July 2014 Edited by T. Ahram, W. Karwowski and T. Marek
Correlations The bivariate relationships between participants’ self-reported crashes, offences, DBQ factors and social desirability scores are presented in Table 2. The social desirability scales, at both Time 1 and at Time 2, were found to be negatively correlated with all three DBQ sub scales, both within each survey wave and across the two waves.1This bivariate relationship can be understood as showing those individuals with higher scores on the social desirability scale, i.e. individuals who displayed a high propensity to present themselves in the best possible light, were more likely to report lower rates of aberrant driving behaviours, such as speeding. Conversely, those who are the least likely to be concerned by how their behaviour is perceived by others, were more likely to report aberrant driving behaviour, as assessed by the three DBQ sub scales.
Partial correlations The relationship between social desirability and key survey items was further examined by way of a partial correlation as shown in Table 3. The use of anchor scales (or marker variables) involves considering the observed relationships between items that are theoretically unrelated to the constructs of interest in reference to possible CMV effects. The use of partial correlations can provide a simple statistical control for this effect (Podsakoff et al., 2003).
Table 3: Correlations between self-reported crash involvement, offences and DBQ Scales, before and after controlling for social desirability factor scores at Time 2.
Very small but consistent differences between standard correlations and those obtained after controlling for social desirability effects were observed while significance remained unaffected in each instance.2 Similarly, controlling for the anchor scales in this manner produced negligible changes to the data (results not shown).
1 Similar results were observed when using dichotomised versions of the lie scale i.e. significant relationships were observed with DBQ subscales but not crashes or offences at both Time 1 and Time 2 (results not shown).
Proceedings of the 5th International Conference on Applied Human Factors and Ergonomics AHFE 2014, Kraków, Poland 19-23 July 2014 Edited by T. Ahram, W. Karwowski and T. Marek
Results of comparison of effects across survey waves The second aim of the study was to explore for the existence of unstable effects with the data. The relationships between key road safety variables appearing in Table 2 were examined to determine the extent to which unstable effects associated with CMV were present. Correlations occurring within waves were squared and then combined, and average effects sizes were recorded after dividing by the number of effects.3 Conducting the analysis of effects sizes in larger groupings provided a measure by which to compare differences between the effects of interest.
A comparison of individual correlations occurring within waves and between waves showed that generally the highest correlations were observed within waves. Of the 21 individual correlations observed at Time 1, only 4 were lower than the figure produced by comparing Time 1 items with items at Time 2. Similarly, of the 21 individual correlations observed at Time 2, 5 were lower than those produced by the equivalent correlation across survey times.
After averaging the correlations, it was found that overall the correlations within Waves were 19.6% stronger than those found between the waves. This finding was also consistent for both surveys, with the effects within Wave 1 being 17.3% stronger than those detected across the waves and the effects within Wave 2 found to be 21.1% stronger than those between waves.
A further analysis of individual items and crashes in the past three years produced some interesting results. The relationship between the DBQ factors (aggressive violations, errors and highway code violations) and crashes in the past 3 years was found to be 41.47% greater than effect found across waves. However the difference in the relationships between the DBQ factors and offences in the last 3 years was not so pronounced. The within-waves effect between the DBQ factors and offence in past 3 years was 11.01% stronger than the effect found across waves.
Anchor scales A final analysis was conducted comparing the relationship between key variables with the anchor scale (e.g., unrelated items) to explore whether different types of scales and items may be more susceptible to CMV effects. Anchor scales are of interest in that, unlike the items examined above, no relationship would normally be expected to be present between these items and variables describing driving behaviours and driving history. As noted previously, the correlation between the anchor scales across T1 and T2 was strong. The correlations between the anchor scales and SD scales were negligible and statistically non-significant. Examination of the comparative strength of these correlations found that the effects within Waves were 10.1% stronger than those found between the waves. This figure was half of the average difference observed from the similar analysis conducted on the road safety related items.
Checking for confounding factors An additional analysis was conducted to assess whether the observed results could reflect some actual change in driving behaviours occurring in the survey period. Could some other event explain the difference in strength between the different correlation types and did the observed results hold true for all drivers? To test for this, survey respondents had been asked whether any changes in their general driving behaviour had occurred in the two months period between the two surveys. Over four-fifths of respondents (81.2%) indicated that their driving was not at all different or not much different since completing the first survey, while 14.5% of respondents felt that their driving was now somewhat different or very different. Analysis of the data revealed that the proportion of respondents in the latter group who self-reported being detected for a traffic offence (28%) in the intervening period was twice that of those in the no change group (13.8%). Just 4.2% of respondents indicated that they were unsure. Two cohorts were subsequently created: (a) one group whose driving was effectively unchanged and (b) drivers who indicated an alteration to their driving behaviours.
Analysis of these two cohorts showed that for both groups the within wave correlations were stronger than the intercorrelations. The effects within waves for the no change cohort were 20.37% stronger than across waves while effects for respondents who reported a difference in driving were 48% stronger within waves than across. This difference in results produced by the two cohorts is consistent with the expectation that respondents who 2 Similar results were found following examination of partial correlations of items at Time 1 (results not shown). 3 Similar effects were obtained after converting effects to z scores (results not shown)
Proceedings of the 5th International Conference on Applied Human Factors and Ergonomics AHFE 2014, Kraków, Poland 19-23 July 2014 Edited by T. Ahram, W. Karwowski and T. Marek
experienced a change in their driving would have lower correlations across the survey waves. The greater difference (48%) reflects the weaker between waves correlations present amongst the drivers who reported changes in their driving behaviours.
Relationships involving the anchor scale and road safety items were also examined for these two driving cohorts. Drivers reporting little or no change in their driving behaviour also were found to have within-wave correlations that were on average 7.1% stronger than across waves. However a different result was obtained for the drivers who reported their driving was somewhat different or very different at the second survey. For this group the anchor scales were found to be 34.3% stronger than those within waves. This finding is in line with expectations, given that responses at Time 2 for this cohort changed somewhat to reflect their new driving experiences, but their responses to anchor scale items did not change to the same degree. This finding may also reflect the extent to which anchor scales, in this context, measure a more stable trait than other variables in this study.
DISCUSSION
SD and CMV effects within the current sample The current study aimed to explore for the existence of CMV effects. More specifically, it aimed: (a) to measure the relationship between SD and self-reported driving history as measured by the DBQ, crash and traffic offence history (b) to determine whether the presence of SD is consistent across time and (c) the extent to which unstable effects associated with CMV may be present. The key findings will be discussed below.
In regards to the existence of social desirability, no differences between men and women were found, however age does appear to be a factor, with older drivers slightly more likely to display a greater concern for how they present socially than younger drivers. Social desirability, as measured by the scales employed in this study, was found to be moderately correlated with the DBQ subscales but not with crashes and offences as reported in the past three years. While there were not strong SD effects when describing crashes, it is worth noting that no other items in this study, other than offences, were found to be associated with crashes, that is, no subjective measures were associated with crashes.
Study participants who displayed greater concern for how they present socially had lower mean DBQ scores than those who appeared less affected by these considerations. The aforementioned findings are interesting in light of the results of a meta-analysis of the DBQ, which showed that mean scores for violations, and to a lesser extent errors, correlated negatively with age (de Winter and Dodou, 2010). In terms of stability, unlike other scales, no significant differences were found between the means of the lie scales, or for the anchor scales, over the two survey waves.
The results from the zero-order correlations and partial correlations suggest that social desirability does contribute to the variation in responses to traffic related survey items. However correlations and statistical significance levels were largely unaffected after controlling for social desirability. This result differs from findings obtained by Harrison (2010), af Wåhlberg (2010) and af Wåhlberg and Melin (2012) but is consistent with Conner and Lai (2005), although the latter study did not provide details of this aspect of the analysis. It is interesting to note that social desirability was found to be associated with driver behaviours, as recorded by the responses to the DBQ, but not actual crashes or offences (albeit self-reported).
Given the anonymous nature of data collection for this study, it is possible that such effects could differ if obvious mediating factors had been present that could encourage favourable responses. Nevertheless one notable finding of the current study is that respondents who scored higher on the social desirability scale were also less likely to report aberrant driving behaviours as measured by the DBQ. Conversely drivers with less of a tendency to engage in social desirability responding reported a higher frequency of aberrant driving behaviours recorded using the DBQ.
This can be interpreted in a number of ways, the first being that respondents in the current sample answered truthfully in relation to their driving behaviours. This is suggested by the direction of the correlations effects and the stability of findings after controlling for social desirability, as measured by the lie scales. The second interpretation is, of course, that responses to road safety are affected by a desire to create a favourable impression, as measured by the social desirability scale. In this sense the study findings may reflect one issue associated with self-report surveys,
Proceedings of the 5th International Conference on Applied Human Factors and Ergonomics AHFE 2014, Kraków, Poland 19-23 July 2014 Edited by T. Ahram, W. Karwowski and T. Marek
whereby comparisons of self-reported data with independent sources have lead researchers to conclude that self- reported responses may reflect self-perceptions rather than actual behaviours (Arnedt, Geddes and MacLean, 2005; Berlin, Reagan and Bliss, 2012; Fildes, Rumbold and Leening, 1991; Greaves and Ellison, 2011).
A third consideration could be that the analysis is capturing a trait shared between the DBQ and SD measures. For example it is possible that drivers who are inclined to drive in a more dangerous manner may also be less inclined to be concerned about how they present to others, as measured by the SD scale. This would explain the presence of the observed correlations but the absence of any change after controlling for SD. The lie scale employed in this scale, and possibly other lie scales, may not be effective tools for detecting this trait among some driver cohorts. The findings in relation to socially desirable responding can also be considered in light of the study by Van Hemert, Van de Vijver, Poortinga and Georgas, (2002) in which international differences in responses to the four scales of the Eysenck Personality Questionnaire were assessed. Australia was found to have the fourth lowest rating for responses to the lie scale among the 36 countries examined, suggesting that the effects of socially desirable responding may not be as pronounced in Australia as elsewhere.
The second aim of the study was to examine whether CMV effects could be identified by comparing unrelated items. The use of unrelated items (i.e. anchor questions) also failed to reveal the existence of CMV effects in that no significant correlations or partialling effects were found that would suggest an artificial association between the variables had occurred. Further research would be ideal with larger sample sizes (and different anchor items) to determine the usefulness of unrelated items to identify CMV effects.
The third component of this study examined unstable CMV effects through a comparison of the strength of the correlations within and between the two survey waves. In contrast to the rather mixed findings related to the lie scales, the comparison of the strength of the correlations within and across the survey waves showed that the overall effects within-waves were about 20% stronger than those found between the waves. This is consistent with previous research which calculated that up to 26.3% of the variance measured in a typical research measure can be attributed to CMV biases (Cote and Buckley, 1987) and research that showed that behaviour measures from self-reports exclusively accounted for 11% more of the variance than when behaviour measures had been measured using an objective source (Armatige and Conner, 2001).
It is acknowledged that while some of the effects examined are small, however when viewed in the context of overall trends within this sample, the overall 20% difference detected is notable. In relation to the correlations between the DBQ factors and crashes in the past three years, the fact that over 40% of the difference in effect size was attributable to bias associated with distortions occurring when the predictor and independent variables are drawn from the same source, highlights the potential distortions which CMV effects can create. While in the current study the relationship between the DBQ and crashes was weak and statistically non-significant, the potential inflationary effects identified in this study have the ability to distort findings in which stronger and statistically significant associations have been identified between key road safety items.
In the case of the anchor scales, this “stronger within wave effect” was half as great as that observed when recognised road safety measures were compared across the waves. This reduction of effect may be explained by the suggestion that some constructs may be more prone to CMV effects than others (Crampton & Wagner, 1994; Spector, 2006). The study findings also cast new light on results in which small associations have been found between road safety batteries and key outcome variables, such as crashes, with the strong suggestion that CMV could be inflating these recorded relationship. With this in mind, it is notable that the correlations between DBQ violations and errors were high. Given that these are considered distinct (that is uncorrelated) factors, method bias could be affecting the strength of the observed relationships.
Study Limitations A number of limitations should be borne in mind when interpreting the results. Firstly, it is possible that sample bias may be present within the sample population due to non-random sampling. While the sample represented a range of driver types, in regard to age, years licensed and kilometers driven, the representativeness of the sample may not be easily transferable to other populations, such as professional drivers and individuals driving in rural areas. The sample may also reflect the survey distribution, which was primarily disseminated electronically. As such caution should be applied when generalising the findings to the wider population.
Future research Replication of this study would be enhanced with a larger sample size and the inclusion of additional questionnaire items to accompany the DBQ. The use of official data, such as crash records, would enable a comparable analysis to
Proceedings of the 5th International Conference on Applied Human Factors and Ergonomics AHFE 2014, Kraków, Poland 19-23 July 2014 Edited by T. Ahram, W. Karwowski and T. Marek
be undertaken utilising data drawn from an independent source. In addition, test for alternative causes of CMV, such as transient mood state, could be included in future research designs. Despite the minimal impact of controlling for SD, the findings of this study suggest that SD scales should be included in studies which utilise self-report data as SD was found to be negatively correlated the DBQ factors and this association was statistically significant. Taken together, addressing the potential distorting effects of CMV effects on study findings remains problematic for researchers and ongoing efforts to understand, measure and minimise this error should be encouraged.
REFERENCES
af Wåhlberg, A. (2009). Driver Behaviour and Accident Research Methodology: Unresolved Problems.
Farnham, UK: Ashgate. af Wåhlberg, A., Dorn, L., and Kline, T (2010). The effect of social desirability on self-reported and recorded road traffic accidents. Transportation Research Part F, 13, 106-114. af Wåhlberg, A. (2010). Social desirability effects in driver behaviour inventories. Journal of Safety Research, 41,
99-106 af Wåhlberg, A. and Melin, L (2012) On the validity of lie scales: Research paper available at: http://www.researchgate.net/profile/Anders_Af_Wahlberg/publications/ (online). Available from: www.psyk.uu.se/hemsidor/busdriver [Accessed 10/11/12] Arnedt, J. T., Geddes, M. A. C., and MacLean, A. W. (2005). Comparative sensitivity of a simulated driving task to
self-report, physiological, and other performance measures during prolonged wakefulness. Journal of psychosomatic research, 58(1), 61-71. Armitage, C. J., and Conner, M. (2001). Efficacy of the theory of planned behaviour: A meta-analytic review.
British journal of social psychology, 40(4), 471-499. Ashley, A., and Holtgraves, T. (2003). Repressors and memory: Effects of self-deception, impression management, and mood: Journal of Research in Personality 37(4) Aug 2003, 284-296. Berlin, S., Reagan, I. J., and Bliss, J. P. (2012). Participant characteristics and speeding behavior during an advisory
warning and cash incentive intervention. In Proceedings of the Human Factors and Ergonomics Society Annual Meeting (Vol. 56, No. 1, pp. 1044-1048). Sage Publications. Blockey, P.N., and Hartley, L.R. (1995). Aberrant driving behaviour: errors and violations. Ergonomics, 38, 1759-1771 Cohen, J., Cohen, P., West, S. G., and Aiken, L. S. (2013). Applied multiple regression/correlation analysis for the
behavioral sciences. Routledge. Conner, M., and Lai, F. (2005). Evaluation of the effectiveness of the National Driver Improvement Scheme. Cote, J. A., and Buckley, R. (1987). Estimating trait, method, and error variance: Generalizing across 70 construct validation studies. Journal of Marketing Research, 24, 315–318. Crampton, S. M., & Wagner, J. A. (1994). Percept-percept inflation in microorganizational research: An
investigation of prevalence and effect. Journal of Applied Psychology, 79(1), 67. Crowne, DP and Marlowe, D., (1960). A new scale of social desirability independent of psychopathology. Journal of Consulting Psychology 24, 349-354. de Winter, J.C.F., and Dodou, D. (2010). The Driver Behaviour Questionnaire as a predictor of accidents: A meta-
analysis. Journal of Safety Research, 41, 463–470. Fildes, B. N., Rumbold, G., and Leening, A. (1991). Speed behaviour and drivers’ attitude to speeding. Monash University Accident Research Centre, Report, 16. Freeman, J. E., Barraclough, P., Davey, J. D., af Wåhlberg, A., and Watson, B. C. (2013). The wrong tool for the
job? The predictive powers of the DBQ in a sample of Queensland motorists. In Dorn, Lisa & Sullman, Mark (Eds.) Driver Behaviour and Training, Aldershot: Ashgate Publishing, Greaves, S. P., and Ellison, A. B. (2011). Personality, risk aversion and speeding: An empirical investigation.
Accident Analysis and Prevention, 43(5), 1828-1836. Harrison, W. A. (2010). Is it finally time to kill self-report outcome measures in road safety? An investigation of common method variance in three surveys of a cohort of young drivers that included the Driver Behaviour Questionnaire. Paper presented at the Australasian Road Safety, Research, Policing and Education Conference, Canberra. Johnson, T., and Van de Vijver, F., (2002). Social Desirability in Cross-Cultural Research, In Cross-Cultural
Survey Methods Harkness, J., van de Viver, F., and Mohler P., (eds). New York: Wiley Press.
Proceedings of the 5th International Conference on Applied Human Factors and Ergonomics AHFE 2014, Kraków, Poland 19-23 July 2014 Edited by T. Ahram, W. Karwowski and T. Marek
Kurtz, J., Tarquini, S., and Iobst, E. (2008). Socially desirable responding in personality assessment: Still more substance than style. Personality and Individual Differences, 45(1), 22–27. Lajunen, T., Corry, A., Summala, H., and Hartley, L. (1997). Impression management and self- deception in traffic
behaviour inventories. Personality and Individual Differences, 22, 341–353. McCrae, R. (1986). Well-being scales do not measure social desirability. Journal of Gerontology, 41(3), 390–392. McCrae, R., and Costa, P., (1983). Social desirability scales: More substance than style. Journal of Consulting and Clinical Psychology, 51(6), 882–888. Ozkan, T., and Lajunen, T., (2005). A new addition to DBQ: positive driver behaviours scale. Transportation
Research Part F, 8, 355-368. Parker, D., McDonald, L., Rabbitt, P. and Sutcliffe, P. (2000). Elderly drivers and their accidents: the aging driver questionnaire. Accident Analysis and Prevention, 32, 2000, pp.751-759. Paulhus, D., (1984). Two-component models of social desirability responding. Journal of Personality and Social
Psychology, 46(3), 598–609. Paulhus, D., (1991). Measurement and control of response bias. In J.P. Robinson, P.R. Shaver, and L.S. Wrightsman (Eds.), Measures of personality and social psychological attitudes. San Diego: Academic Press. Paulhus, D., (1994). Balanced Inventory of Desirable Responding: Reference manual for BIDR Version 6.
Unpublished manuscript, University of British Columbia, Vancouver, Canada. Paulhus, D. and Reid, D. (1989). Partitioning the Marlowe Crowne into two components: Self deception and impression management. Unpublished manuscript. Podsakoff, P. M., MacKenzie, S. B., Lee, J. Y., and Podsakoff, N. P. (2003). Common method biases in behavioral
research: A critical review of the literature and recommended remedies. Journal of applied psychology, 88(5), 879-903. Reason, J., Manstead, A., Stradling, S., Baxter, J., and Campbell, K. (1990). Errors and violations: a real distinction? Ergonomics, 33, 1315-1332. Reio, T. G. (2010). The threat of common method variance bias to theory building. Human Resource Development
Review, 9(4), 405-411. Rushton, J. P., Brainerd, C. J., and Pressley, M. (1983). Behavioral development and construct validity: The principle of aggregation. Psychological Bulletin, 94(1), 18. Sackeim, H., and Gur, R., (1978). Self-deception, self-confrontation, and consciousness. Consciousness and Self-
Regulation, 2, 139–197. Spector, P. E. (1987). Method variance as an artifact in self-reported affect and perceptions at work: myth or significant problem?. Journal of Applied Psychology, 72(3), 438. Stöber, J., Dette, D. E., & Musch, J. (2002). Comparing continuous and dichotomous scoring of the Balanced
Inventory of Desirable Responding. Journal of Personality Assessment, 78(2), 370-389. Uziel, L. (2010). Rethinking Social Desirability Scales From Impression Management to Interpersonally Oriented Self-Control. Perspectives on Psychological Science, 5(3), 243-262. Van Hemert, D. A., Van de Vijver, F. J., Poortinga, Y. H., and Georgas, J. (2002). Structural and functional
equivalence of the Eysenck Personality Questionnaire within and between countries. Personality and Individual Differences, 33(8), 1229-1249.
LISTED IN THE AHFE DIGITAL BOOKSTORE CATALOGUE
Explore the complete digital volume
Advances in Human Aspects of Transportation: Part I
Read this individual research paper free through the original publisher, or explore the full digital proceedings book.
ISBN 978-1-4951-2097-8
Explore this ISBN in the AHFE Bookstore ↗Listed in the July 2026 bookstore catalogue; search by ISBN to confirm current availability · Digital book purchase optional