Mieko Ohsuga, Hidenori Boutani (2021). Detection of a Decrease in Concentration Using Indices Derived from Heart Rate and Respiration Toward Affective Human-Robot Interaction. In: Advances in Human Aspects of Transportation: Part I. AHFE Open Access, vol. 15. https://doi.org/10.54941/ahfe100641
The present paper refers the method to detect the degraded concentration of human who is engaged in computer work or watching television in order to find the appropriate timing for robot’s interrupt. The heart rate and respiratory measures were confirmed to change depending on the degree of concentration by an experiment. Principle component analysis was applied and two measure components were selected and rotated by the varimax method. The first principle component represented large low frequency component of heart rate variability (HRV), low respiratory frequency and large respiratory irregularity, while the second component represented high heart rate, small high frequency component of HRV. It was suggested that the first principle component can be used to discriminate between concentrated and degraded concentrated sates of human.
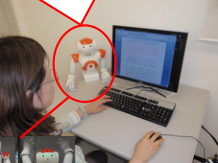
For an affective human-robot interaction, the adaptive control of robot’s behaviors depending on human states is important. We are trying to detect a decrease in concentration of human who is working or doing something not to make an alarm but to capture opportunity to interrupt without giving nuisance. Two situations where a robot approaches to human are assumed; one is a short break recommendation during a long-lasting computer work, the other is a promotion for doing a light exercise during watching television in the living room (Yamada, et al. 2011, see Figure 1).
Many studies demonstrated the availability of non-invasive physiological indices especially autonomic indices to recognize emotions in the space of arousal and valence (Pattyn, 2008, Valenza, 2012). In this paper, our attention is focused on the indices derived from electrocardiogram (ECG) and respiration, which are more likely to be measured non-intrusively, that is without attaching sensors. Our previous study showed that heart rate variability (HRV) and respiratory measures changed significantly during a monotonous task (Ohsuga, 2001).
In the present study, we focused on the former situation and executed an experiment with tasks simulating computer work measuring ECG and respiration. We selected the appropriate measures to detect the decrease of concentration and an algorism was studied to detect the decrease in concentration introducing principle component analysis.
“Let’s do exercise!”
“Let’s take a short break!” a) b)
“Knee up!”
Figure 1. Envisioned applications. a) short break recommendation during a computer work, b) promotion of a light exercise during watching TV
METHOD
Participants Eight healthy paid volunteers (7 males and 1 female) aged 20-22 years participated in the experiment. Each participant gave a written informed consent.
The experiment reported in this paper was executed with the permission of the president of Osaka Institute of Technology in accordance with the report of the Life Science Ethics Committee of Osaka Institute of Technology.
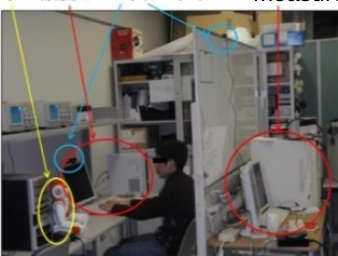
Experimental conditions The participants were required to be engaged in six 20-min tasks using a personal computer. Eleven kinds of tasks were prepared which were similar to those they experience in a daily life; for example, inputting characters, simple calculation, word processing, drawing graphs or tables, programing with C language, writing an essay, making a presentation, searching papers on a specific theme, and answering the questionnaires on English literacy or common knowledge. They selected three tasks during which they judged that they might be able to maintain their concentrations. They also choose other three tasks during which they thought that they would be bored. Figure 2 shows the experimental setting.
NAO
Web Camera
PC for measurement PC for task
Figure 2. Experimental setting.
Measurement Chest ECG was measured using disposal electrodes and a bio-amplifier (BA1008, Degitex Lab.). Respiratory movement (RSP) was detected by a carbon tube sensor (TR-751T, Nihon Kohden) attached around abdomen. Face expression and the behavior of the participant were captured by two web cameras. Human Aspects of Transportation I (2021)
An upper-body humanoid robot “NAO” (ALDEBARAN) was used to recommend the participants to take a short break for stretching twice for each task with 7-10 min intervals. The participants were instructed that they were welcome to ignore the robot’s offer if they were unwilling to accept. After every robot’s call, they were required to rate their states (concentration, drowsiness, irritation and strain) and the degree of nuisance of the robot with 5- points scale. Thus, twelve data sets were obtained for one participant.
Extraction and selection of indices Instantaneous heart rate (HR) was obtained from ECG beat by beat. They were converted into equi-internal data by third order spline interpolation with the sampling rate of 20 Hz. Averaged heart rate was calculated at every 5 s using low pass filtered data with cut off frequency 0.4 Hz. The components of heart rate variability were quantified via FFT spectral analysis at every 5 s, using 51.2 s frames consisting of 30 s of data weighted by a Hamming window and the remainders filled with zeroes. The mean amplitudes were obtained for the low- frequency band (LF; 0.039-0.137 Hz), mid-frequency band (MF; 0.078-0.137 Hz), high-frequency band (HF; 0.156-0.605 Hz) and respiratory frequency component (RF; (GF-0.05) - (GF+0.05) Hz) (see Figure 3). GF is the gravity frequency (GF) of RSP that is an amplitude weighted mean frequency. CV (coefficient of variance) measures of HRV, which is the measures divided by the averaged HR, were also obtained.
The peak frequency (PF), above-mentioned GF and frequency components of RSP were obtained by FFT using the same method applied to HRV. The absolute difference between PF and GF (|PF-GF|) was calculated as an index of respiratory irregularity (see Figure 4).
The data sets with large (4 or 5) and small (1 or 2) scores of subjective rating on “concentration” were selected for each participant respectively. If multiple data sets showed even score, “drowsiness”, “irritation”, “strain” and the degree of nuisance were compared in this order. The averaged values of the measures for two 4-min periods before robot’s calling were obtained and applied the paired t-test.
Discrimination between concentrated and degraded concentrated states We applied the principle component analysis to the selected indices. The size of data set was 8 participants x 12 trials. In order to cope with the individual differences, Z scores were calculated and analyzed using the quantified indices of 12 trials for each participant. After a varimax rotation was conducted for two major principle components, the principle component scores were obtained. They were compared as to the subjective ratings.
RESULTS AND DISCUSSIONS
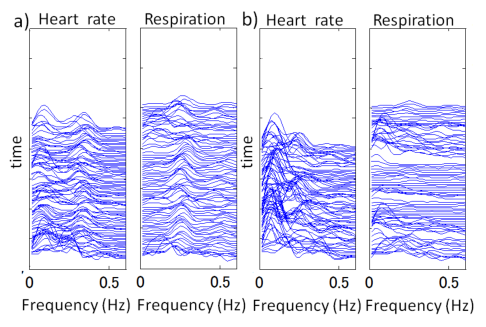
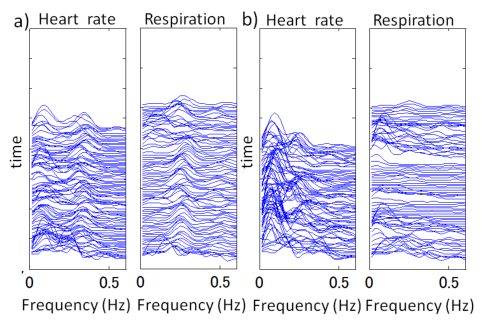
Figure 5 shows typical examples of HR and RSP in the concentrated state (a) and those in the degraded concentration (b). Figure 6 shows the amplitude spectral arrays for the same data as shown in Figure 5. The increase in the irregularity of RSP and lower component of both HRV and RSP are observed during less concentration. These results are consistent with our previous study (Ohsuga, 2001).
These observations were confirmed by the paired t-test (see Figure 7). Both raw and CV values of HRV_LF and HRV_MF, respiratory amplitude both of whole frequency band (RSP_all) and lower band (RSP_LF), and the respiratory irregularity (|PF-GF|) were significantly larger during degraded concentrated state (p<0.001). Both respiratory frequency measures (PF, GF) showed significant lower values in less concentration (p<0.001).
Whole HRV (HRV_all) and respiratory amplitude of higher frequency band (RSP_HF) moderately increased in the degraded concentration (p<0.05).
data17-9
data17-9 re s p
h rt[ b p m ]
0 2 4 6
Heart Rate Respiration a)
0 20 40 60 80 100 120 40 60 80 100 120
0 20 40 60 80 100 120 - 2
re s p
h rt[ b p m ]
0 2 4 6
120 140 160 180 200 220 240 40 60 80 100 120
120 140 160 180 200 220 240 - 2
re s p
h rt[ b p m ]
0 2 4 6
240 260 280 300 320 340 360 40 60 80 100 120
240 260 280 300 320 340 360 - 2
re s p
h rt[ b p m ]
0 2 4 6
360 380 400 420 440 460 480 40 60 80 100 120
360 380 400 420 440 460 480 - 2
data17-7
data17-7 re s p
h rt[ b p m ]
0 2 4 6
Heart Rate Respiration b)
0 20 40 60 80 100 120 40 60 80 100 120
0 20 40 60 80 100 120 - 2
re s p
h rt[ b p m ]
0 2 4 6
120 140 160 180 200 220 240 40 60 80 100 120
120 140 160 180 200 220 240 - 2
re s p
h rt[ b p m ]
0 2 4 6
240 260 280 300 320 340 360 40 60 80 100 120
240 260 280 300 320 340 360 - 2
re s p
h rt[ b p m ]
0 2 4 6
360 380 400 420 440 460 480 40 60 80 100 120
360 380 400 420 440 460 480 - 2
time (s) time (s)
Figure 6. Amplitude spectral arrays for the same data as shown in Figure 5.Figure 5. Examples of heart rate and respiration. a) concentrated state, b) degraded concentrated state [bpm] [%] [%] b) HRV_LF(CV) c) HRV_HF(CV)
10
10
90 a) HR
8
8
80
6
6
70
4
4
n.s.
60
n.s.
2
2
**
~ ~
0
0
0
C D C D C D d) RSP_LF e) RSP_HF f) RSP_GF g) |PF-GF| [A.U.] [A.U.] [Hz] [Hz]
0.4
0.2
120
**
60
80
40
0.3
0.1
40
20
** ~ ~
0
0
0
** *
0
C D C D C D C D
Figure 7. Comparison of indices between most concentrated trial (C) and most degraded concentrated trial (D) for each participant and the results of paired t-test. https://openaccess.cms-conferences.org/#/publications/book/978-1-4951-2097-8
Figure available in the original PDF paper.
As the HRV and respiratory measures were confirmed to change depending on the degree of concentration of the participants, we selected the indices for further analysis. One index form an index group with similar meaning was selected respectively; HRV_LF(CV) , HRV_HF(CV) for two frequency bands of HRV, RSP_GF for respiratory frequency and |PF-GF| for respiratory irregularity. The measures of respiratory amplitude were excluded because they depend on the condition of sensor attachment, while HR was included because it is used for quantification of CV of HRV.
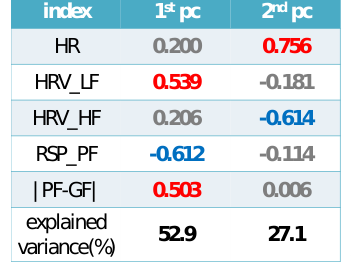
Table 1 shows the principle components coefficients after the varimax rotation. The percentages of the variance explained by each principal component are 52.9 % and 27.1 % respectively. Accumulated explained variance was 80%. The first principle component has a large coefficient for HRV_LF, a low one for RESP_PF and large one for respiratory irregularity, which represents the degraded concentration states. On the other hand, the second component has a high coefficient for heart rate and a small one for HRV_HF, which represents arousal level.
Each trial data for all participants was plotted in the principle component space (see Figure 8). The state having not less than 3.5 in the average of the rating score of “degraded concentration (reversed score of concentration)” and “drowsiness” is considered to be “degraded concentration” state, while the state which shows the score not more than 2 is considered to be ‘concentration’ state. In Figure 8, red triangles designate for the degraded concentrated states; green squares for the concentrated states; black circles for others. Large triangles designates for the most ‘degraded concentrated’ state in each participant and large squares for the most ‘concentrated’ state in each participant. Most triangles are found in the right half of the space, while the squares are located in the left half. A few exceptional instances are found, however the two extreme trials for each participants are perfectly divided into the two half spaces.
Figure 8. Each trial data of all participants plotted in principle component space. Red triangles designate for the degraded concentrated states; green squares for the concentrated states; black circles for others. See text for details.
Figure available in the original PDF paper.
CONCLUSIONS AND FUTURE WORK The measures derived from electrocardiogram and respiration were confirmed to change depending on the degree of concentration. The results of the principle component analysis suggested that the degraded concentration can be detected using these measures. We are now working for the method to detect the degraded concentration in real time and also for the non-intrusive measurement of electrocardiogram and respiration using sensors embedded in a chair.
ACKNOWLEGEMENT A part of this work was supported by JSPS KAKENHI Grant Number 24500263.
REFERENCES
Ohsuga, M., Shimono, F., Genno, H. (1996) “Assessment of phasic work stress using autonomic indices”, Int. J. of Psychophysiol., 40, pp.211-220, 2001. Pattyn, N., Neyt, X., Henderickx, D., Soetens, E. (2008) “Psychophysiological investigations of vigilance decrement: boredom
or cognitive fatigue?”. Physiol. & Behavior, Volume 93, pp.369-378. Valenza, G., Lanata, A., Scilingo, E.P. (2012) “The role of nonlinear dynamics in affective valence and arousal recognition”.
IEEE trans. on Affective Computing, Volume 3, Number 2, pp.237-249. Yamada, E., Ohsuga, M., Hashimoto, W., Inoue, Y., Nakaizumi, F. (2011) “Proposal of system which promotes physical activity at home and effects of promotion using a low-cost home robot”. Proc. of the fourth Int. Conf. on Human-Environment System, pp. 79-84.
LISTED IN THE AHFE DIGITAL BOOKSTORE CATALOGUE
Explore the complete digital volume
Advances in Human Aspects of Transportation: Part I
Read this individual research paper free through the original publisher, or explore the full digital proceedings book.
ISBN 978-1-4951-2097-8
Explore this ISBN in the AHFE Bookstore ↗Listed in the July 2026 bookstore catalogue; search by ISBN to confirm current availability · Digital book purchase optional