Po-Hung Lin, Hao-Sian Jhang (2020). Effects of Display Technique, Image Content, and Environment on User Performance of Auto-stereoscopic Mobile Phones. In: Advances in The Ergonomics in Manufacturing: Managing the Enterprise of the Future. AHFE Open Access, vol. 12. https://doi.org/10.54941/ahfe100453
With the evolution of the technology, mobile devices have gradually become an indispensable part of life. Meanwhile, the display technology is converted from 2D display to 3D display. In this study, we investigated the effects of display technique, image content, and dynamic & static environments on user performance of a auto-stereoscopic mobile phone. Eighteen subjects were recruited in this study. A three way full factorial design was used to investigate the effect of display technique (2D and 3D), environment (a controlled laboratory, and a carriage of a Mass Rapid Transit (MRT), and a car), and image content (picture, video and game) on usability and the change of critical fusion frequency (CFF). The ANOVA results indicated that display technique was significant on usability and the change of CFF, where viewing the 3D display induces more fatigue than viewing the 2D display. The results also showed that environment was significant on usability and the change of CFF, while the performance in a laboratory is better than that in a carriage of MRT and a car. Finally, the results indicated that image content was significant on the change of CFF, while highest visual fatigue was found in game playing.
Ever since the debut of the movie Avatar, a wave of craze of 3D was drawn over the globe. With the advancement of technology and maturing of techniques, 3D stereoscopic displays also improved to auto-stereoscopic technology gradually. The 3D technology is applied in many areas so far whilst uses are quite broad, including on televisions, movies and gaming devices; some manufacturers even introduced same auto-stereoscopic technology into mobile phones. Hence, comparing to traditional 2D interfaces, 3D interfaces contain better image qualities. IJsselsteijn et al. (2000) pointed out that three-dimensional displays are capable of compensating poor image qualities. Kalich et al. (2003) pointed out that three-dimensional displays provide a wider field of visions. Furthermore, Kooi & Toet (2003) proposed that binocular viewers may pass uncorrelated noises easily to see relevant signals which represent the objects in the scene, while Watkins et al. (2001) also pointed out that binocular visual input improves the details and backgrounds of viewers’ consciousness significantly, especially in unfamiliar or complex scenes.
However, there are still some drawbacks for 3D image, such as crosstalk. Pastoor (1995) indicated that crosstalk may be the main reason for visual fatigue and headache. IJsselsteijn et al. (2005) indicated that due to the perception characteristic of crosstalk, image distortion was increased when numbers of crosstalk increased. Lee et al (2010) further indicated that short viewing distance could improve visual fatigue when viewing 3D context. Combining advantages and disadvantages of the display technique mentioned above, evaluation of visional performances of 2D and 3D techniques shall be processed in this study.
For 3D video or movie, Lee & Song (2012) indicated that 36% people watching 3D movies have high visual fatigue, and 7% of them have extremely high visual fatigue. Yang & Sheedy (2011) indicated that viewing 3D movies has the effect on accommodation and convergence, and results in severely visual and moving discomfort. With regard to game, Kuze & Ukai (2008) had investigated the subjective visual fatigue when playing 3D games. Stoffregen et al. (2008) also pointed out playing games more than 50 minutes could have the significant motion sickness. Therefore, different image contents for 3D mobile phone were worthy to be investigated.
The portability of mobile devices brings about the versatility of usage contexts and scenarios, which in turn renders the ambient environment an important factor affecting user performance. One of the prominent characteristics of usage contexts on the go is vibration. Vibration environment can make people feel dizzy, tired, and even interrupted. Past studies have showed that people’s visual performance is affected by vibration . This study investigated three environments where people used to manipulate mobile phones: a controlled laboratory, a carriage of Mass Rapid Transit (MRT), and a car. Based on above arguments, display technique, image content and environment were the three factors investigated in this study.
METHOD
Experimental design Three independent variables were evaluated in this study: display technique, image content, and dynamic & static environments. The two display technologies were 2D display and 3D display, image content was consisted of the picture, video and game, the environments were classified a controlled laboratory, and a carriage of a Mass Rapid Transit (MRT), and a car. Therefore, a three way full factorial design for 2 (display technology) × 3 (image content) × 3 (environment) combinations was used.
Subjects Eighteen college students, including 6 males and 12 females, were recruited in this study. No subject was color blind and all had normal or corrected-to-normal vision.
Apparatus A Stereo Fly Test (Stereo Optical Co., Inc., USA) was used to test the stereoscopic vision of subjects. The change of critical fusion frequency (CFF) was measured with a NEITZ Handy flicker. A HTC EVO 3D (4.96 × 2.56 × 0.47 inch, 960 × 540 pixels) was the auto-stereoscopic phone used in this study. LT Lutron (LX-103) light meter was used to measure the illuminations in the three environments.
Experimental scenario The experiment was conducted in a carriage of MRT system, in a laboratory and in a car. For the MRT, the selected route was from Nangang Exhibition Center station to Kunyang station, whose travel duration was approximately four minutes. To avoid crowdedness, off-peak hours (about 9 to 11 AM and 3 to 5 PM) were used to conduct the experiment. The illumination range in a carriage of MRT was from 150 to 250 lux. The illumination of the laboratory and the car was set at 200 lux in average in order to keep the illumination levels in the three environments approximately equal.
Task and procedure In the experiment, image content was consisted of images, videos and games. Fifteen 3D images were selected and demonstrated twice. We then randomly demonstrate these thirty images through slide show with eight seconds interval and the total duration was approximately four minutes. Four minutes 3D video was made through “movie maker” software. “Need For Speed Shift” was the 3D automobile race game with about four minutes per route for subjects to play.
The experimental procedure was as follows: (1) The visual acuity of the subjects was obtained using the vision tester. If the score obtained was lower than 0.8 or
subjects did not pass the Stereo Fly Test, the subject was not allowed to take in the experiment.
(2) The CFF threshold of a subject was reported twice before each treatment. The first time, the CFF value was adjusted from high frequency to low frequency and the second time from low to high. Then, the CFF threshold was the average of these two values.
(3) The participant was asked to adjust the seat to make them comfortable.
(4) Five minutes training time was provided for the subjects to familiarize and manipulate the mobile phone.
(5) Conducting an experimental treatment among images, videos, and games.
(6) As in Step (2), the CFF threshold was obtained after each treatment.
(7) Finally, the subject was asked to fill-in the system usability scale.
(8) Ten minutes break was given for subjects.
(9) Repeat step (2)-(8) until the completion of all experimental combinations.
Experimental variables and data analysis Two dependent measures were analyzed: usability and change of CFF. Usability was defined as the extent to which a product can be used by specified users to achieve specified goals with effectiveness, efficiency, and satisfaction in a specified context of use . In this study, a system usability scale (SUS) questionnaire was used to investigate users’ usability of mobile displays. The change of CFF was the difference between the CFF thresholds before and after treatments.
We conducted analysis of variance (ANOVA) on usability and change of CFF. Helmet test was used to test the significance among each level of dependent variable. All statistical analyses were calculated with the Statistical Products Services Solution (SPSS).
RESULTS AND DISCUSSION
The ANOVA table for each dependent variable is shown in Table 1.
Table 1. ANOVA results of dependent variables Source Usability Change of CFF
Usability The ANOVA results for usability are shown in Table 1, which indicates that display technique (F(1, 68) =28.217, p < 0.01) and environment (F(2, 68) =3.818, p < 0.05) were the significant factors. The mean usability of 2D and 3D techniques were 76.57 and 68.98, which indicated that the usabiltiy of 2D was significantly better than that of 3D. It could be reasonable since a mobile phone with 2D technique is everywhere and people could get to use it easily. On the other hand, 3D technique is not available for every mobile phone and it has the limitation that not every image or video in a mobile phone can be presented in 3D. That could be a reason why the usabiltiy of 2D was significantly better than that of 3D.
In addition, environment (F(2, 68) =3.818, p < 0.05) was also a significant factor. The mean usability of laboratory, MRT, and car were 73.75, 72.685, and 71.898, resespectively. The usability was decreased as environment changed. The results were further analyzed by the Helmet test, revealing that usability on environment was laboratory > MRT = car, which means that usability of static environment (laboratory) was significantly higher than those of dynamic environments (MRT and car). However, no significant difference was found for usability between MRT and car (P>0.05). One of the most important reason might be the vibration. Vibration environment can make people feel dizzy, tired, and even interrupted. Past studies have showed that people’s visual performance is affected by vibration . Similarly, due to vibration, people can not manipulate the interface stably in vibration environments, such as MRT and car in this study. Hence, it is quite reasonable that usability of laboratory was significantly higher than those of MRT and car.
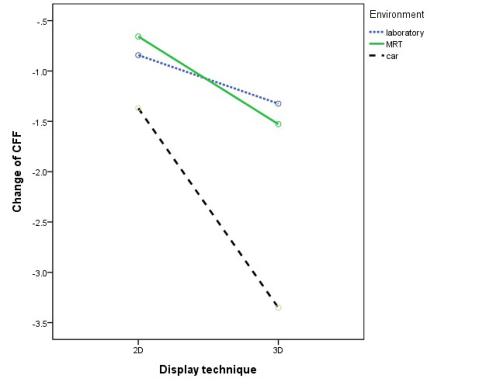
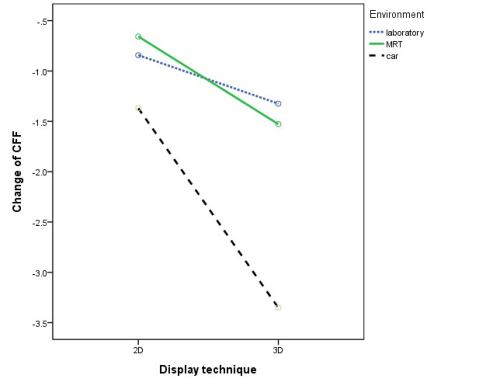
Change of CFF The ANOVA results for change of CFF are shown in Table 1, which indicates that display technique (F(1, 68) =23.377, p < 0.01), environment (F(2, 68) =8.449, p < 0.01), image content (F(2, 68) =8.927, p < 0.01), display technique × environment (F(2, 68) =4.475, p < 0.05), and environment × image content (F(2, 68) =3.229, p < 0.05) were the significant factors. Therefore, the two interactions need to be discussed in advance. For the interaction between display technique and environment, as shown in Fig. 1, the change of CFF decreased as the display technigue was changed from 2D to 3D. Compared with laboratory, the change of CFF in MRT increased when the display technique was changed from 2D to 3D. It might be reasonble since viewing in MRT makes people feel more dizzy and tired and resulted in high visual fatigue, especially for 3D environment.
For the interaction between environment and image content, as shown in Fig. 2, the change of CFF was decreased as the environment changed from MRT to car. During the experiment, subjects reported that they felt more vibration in car than in MRT. It might be reasonable since sitting in a cabinet of MRT is more stable than sitting in a car. Moreover, the change of CFF seems the same when environment was changed from laboratory to MRT. However, comparing to images and videos, subjects’ change of CFF increased drastically when playing games. The reason might be that playing games needs more concentration and gets involoved with the senario easily, and therefore visual fatigue is increased dramatically.
Figure 1. The interaction between display techniqueFigure 2. The interaction between environment and image and environment content
Then we discuss the simple main effect. As shown in Table 1, ANOVA results indicated that display technique was a significant factor. The mean change of CFF in 2D and 3D were -0.957 and -2.068, which indicated that the change of CFF in 2D was significantly better than that in 3D. It might be reasonable because viewing 3D could make people feel dizzy, tired, and even uncomfortable. In addition, environment was also a significant factor. The mean change of CFF in laboratory, MRT, and car were -1.083, -1.093, and -2.361, resespectively. The change of CFF increased as environment was changed. The Helmet test further indicated that significant differences were found among laboratory, MRT and car. It could be reasonable that the change of CFF in vibration environments are worse than that in non-vibration environment. To go a step further, the significant difference between MRT and car is quite reasonalbe because subjects also reported that sitting in a car is more vibratile than that in the MRT. Finally, ANOVA results indicated that image content was significant. The mean change of CFF in images, videos, and games were -1.167, -1.449, and -1.921, resectively. It indicated that the change of CFF increased as image content was changed. The Helmet test further indicated that significant differences were found among images, videos and games.
CONCLUSIONS
The study explores the effect of display technique, image content, and environment on usability and the change of CFF. The results indicated that display technique was significant on usability and the change of CFF, where 3D technique performed better than that of 2D. The results also demonstrated that environment was significant on usability and the change of CFF. The Helmet test indicated that laboratory has the highest usability and lowest visual fatigue. The results further indicated that image content, the interactions between display technique and environment, between environment and image content were significant on the change of CFF. The Helmet test for image content showed that significant differences were found among images, videos and games, where highest visual fatigue was found in game playing.
REFERENCES
IJsselsteijn, W. A., Ridder, H. de. and Vliegen, J., (2000), “Subjective evaluation of stereoscopic images: effects of camera parameters and display duration”, IEEE TRANSACTIONS ON CIRCUITS AND SYSTEMS FOR VIDEO TECHNOLOGY, Volume 10, No.2, pp. 225–233.
ISO 9241 (1998), “Ergonomic Requirements for Office Work with Visual Display Terminals (VDTs)- Part 11: Guidance on Usability”.
Kalich, M. E., Rash, C. E., Pol, C. van de., Rowe, T. L., Lont, L. M. and Peterson, R. D., (2003), “ Biocular image misalignment tolerance” in: Helmet- and Head-Mounted Displays VIII: Technologies and Applications, C.E. Rash, C.E. Reese (Eds.) , pp. 284–295. Kuze, J., Ukai, K., (2008), “Subjective evaluation of visual fatigue caused by motion images”, DISPLAYS, Volume 29, pp. 159-
166. Kooi, F. L. and Toet, A., (2003), “Additive and subtractive transparent depth displays”, THE INTERNATIONAL SOCIETY FOR OPTICAL ENGINEERING, pp. 58–65. Lee, E. C., Heo, H. and Park, K. R., (2010), “The Comparative Measurements of Eyestrain Caused by 2D and 3D Displays”,
IEEE TRANSACTIONS ON CONSUMER, pp. 1677-1683. Lee, JH. and Song, JK,. (2012),”Individual Variation in 3D Visual Fatigue Caused by Stereoscopic Images”, IEEE TRANSACTIONS ON CONSUMER ELECTRONICS, pp. 500-504. Lewis, C. H. and Griffin, M. J. 1979. “Effect of character size on the legibility of numeric displays during vertical whole-body vibration”. JOURNAL OF SOUND AND VIBRATION, Volume 67, No.4, pp. 562-565. Lewis, C. H. and Griffin, M. J. 1980. “Predicting the effects of vibration frequency and axis, and seating conditions on the
reading of numeric displays”. ERGONOMICS, Volume 23, No. 5, pp. 485-499. Lin, C. J., et al. 2008. “Visual performance and fatigue in reading vibrating numeric displays”. DISPLAYS, Volume, 29, No, 4, pp. 386-392. Pastoor, S., (1995),”Human factors of 3D imaging: results of recent research at Heinrich-Hertz-Institute Berlin”, Proceedings of
the International Display Workshop, pp. 95. Stoffregen, T. A.and Smart, L. J. Jr. (1998). “Postural instability precedes motion sickness”, BRAIN RESEARCH BULLETIN, Volume, 47, No.55, pp.437-448. Yang, SN., Sheedy, JE., (2011), “Effects of Vergence and Accommodative Responses on Viewer's Comfort in Viewing 3D
Stimuli”, Stereoscopic displays and applications XXII. Yau, Y., Chao, C. and Hwang, S. 2008. “Optimization of Chinese interface design in motion environments”. DISPLAYS, Volume 29, No. 3, pp. 308-315.
LISTED IN THE AHFE DIGITAL BOOKSTORE CATALOGUE
Explore the complete digital volume
Advances in The Ergonomics in Manufacturing: Managing the Enterprise of the Future
Read this individual research paper free through the original publisher, or explore the full digital proceedings book.
ISBN 978-1-4951-2103-6
Explore this ISBN in the AHFE Bookstore ↗Listed in the July 2026 bookstore catalogue; search by ISBN to confirm current availability · Digital book purchase optional