Bronislaw Kapitaniak, Elżbieta Gadzicka, Marta Walczak, Marcin Kosobudzki, Zbigniew Jóźwiak, Piotr Viebig, Agata Szyjkowska, Teresa Makowiec-Dabrowska, Jadwiga Siedlecka, Alicja Bortkiewicz (2020). Visual Strategy on Driving in Simulator of Urban Bus. In: Advances in Science, Technology, Higher Education and Society in the Conceptual Age: STHESCA. AHFE Open Access, vol. 10. https://doi.org/10.54941/ahfe100393
A group of professional bus drivers have done two rides on a city bus simulator – the fist one into the city centre and the other one in the suburbs. One dangerous incident was simulated during each ride. The visual strategy was evaluated by the FaceLab system comprising two pairs of cameras, one facing the road and the other to the left side. The main selected criteria of the visual strategy included the number and duration of gaze fixations. Furthermore, eyelid movements (PERCLOS index) and pupil diameter were recorded. The results were subjected to a statistical analysis.
While visual strategy during driving has been extensively studied, much less is known about the visual strategy employed during driving the city bus by professional drivers. The study of this strategy is very important for the safety of driving and the optimal methods of driver training. One of the primary purposes of the present study was to evaluate this strategy and verify the extent to which it affects the safety of driving. The professional drivers were selected for the study in order to eliminate the learning effect, and thus enable studying driving strategies that have been well mastered and to some extent automated.
MATERIAL AND METHODS The tests have been done on a prototype city bus simulator produced by Aerospace Industry (Figure 1). The simulator consists of a bus cabin equipped with all the original controls, and a 4.5m-high wide screen with a 270° field of view. The image on the screen, generated in the HD (high definition) system, is displayed using five projectors. This produces the illusion of completely real conditions. The cabin is suspended on a movable platform with six degrees of freedom, so that it is possible to simulate all movements of the vehicle, including those resulting from rough road surface. The simulator offers the option to adjust the intensity of pedestrian and automobile traffic, the type of lighting and weather conditions, adhesion conditions, time of day, etc.
In the bus driving simulator, it is possible to include stressful (action-reaction) events in the driving scenario. This involves precisely pre-programmed and controlled intrusion of a phantom AI (artificial intelligence) car to simulate a dangerous event that forces the driver to react quickly and avoid the collision or minimize its effects.
Fig. 1. Aerospace Industry city bus simulator
Visual driving strategy was tested by FaceLab system, allowing contactless testing. This choice was dictated by the requirement of the total non-invasiveness of the applied research methodology. Two pairs of FaceLab cameras were installed in the cabin - the first in front of the driver's seat, the other on the right-hand side of the driver. The task of the first pair of cameras was to track driver’s eye movements while he/she was driving the bus; the other pair served to monitor the movements of passengers getting into and off the bus and those standing at the bus stop, and observe the environment in the side mirror. Two scenery cameras were installed behind the driver in order to record the driver's field of view during both rides. Deployment of the FaceLab cameras in the driver’s cabin is shown in Fig. 2.
Fig. 2. Deployment of FaceLab cameras in the driver cabin during testing
The study subjects included a group of professional drivers of city buses. Each driver had two rides about 40 minutes each, one in the central part of the town and the other in the suburbs. The rides differed in the number of turns, maneuvering difficulty resulting from the limited width of the streets, urban structure (density of buildings), and the distance between stops. Number of stops in both runs was similar. The characteristics of both rides is presented in Table 1. The "city center" ride was assumed to be "difficult" and the "peripheral" one was deemed to be "easy". The intensity of vehicle and pedestrian traffic was adjusted to a similar level. All study subjects were asked to drive as close as possible to the usual driving under natural conditions. At the end of each ride, a stressful situation was arranged involving sudden intrusion of the AI car phantom that violated the right of way. This situation was generated in a similar manner during both rides.
Table 1: Ride characteristics number of stops number of left turns number of right turns
Visual strategy was evaluated using two indicators: the number of fixations and time of fixation on each of the elements of the field of view. During both rides, the emerging field of view of the scenery camera 1 has been divided into four zones: the peripheral left, peripheral right, lower central and upper central (Fig. 3).
During the accident-like event, the analysis comprised all elements in the visual field.
Analysis of the data was carried out using the Captive software package that allowed the integration of the results of all measurements made and the synchronization of these results with video recording coming from the FaceLab scenery camera filming the central field of vision of the driver. This makes it possible to observe the variability of all parameters monitored in real time of the events, thus enabling full analysis of the reaction of the driver. It is possible, for example, to monitor the speed, acceleration, steering wheel movements, braking, etc.
Characteristics of the braking episodes during both rides were used as one of the elements of the assessment strategies. The CAPTIV package allows analyzing of rapid braking episodes by employing a numerical parameter which, when exceeded, causes that the braking is classified as violent, and quick presentation of the resultant data in the tabular form. The strategy for smooth driving was evaluated from the number of smooth and rapid braking episodes and their proportion.
RESULTS
Due to the fact that the tests are not yet complete, the results presented below apply only to the group of 10 drivers. All our results will be published after completion of all testing.
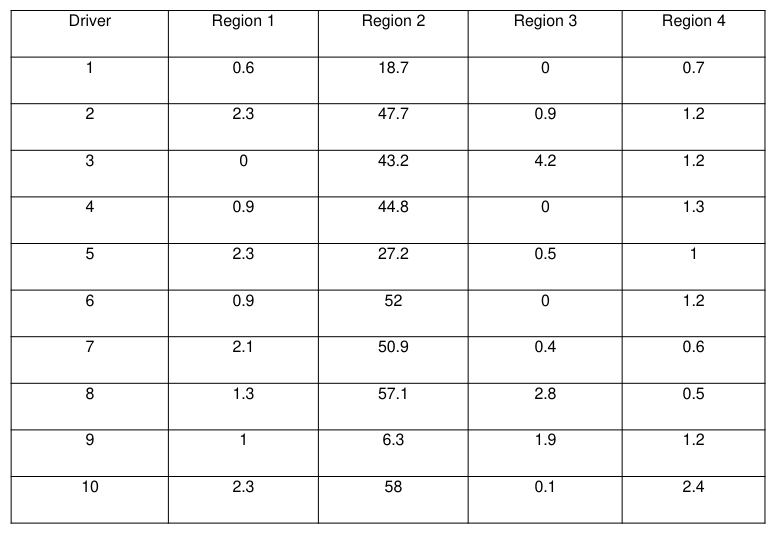
Visual Strategy Visual strategy of the drivers was assessed from the distribution of numerous gaze fixations and their duration in the four zones of the central visual field (Fig.3). Table 2 shows the distribution of gaze fixations in individual drivers.
Fig. 3. Zones of the central visual field
Table 2. Distribution of gaze fixations in individual drivers Driver Region 1 Region 2 Region 3 Region 4
Driving Strategy
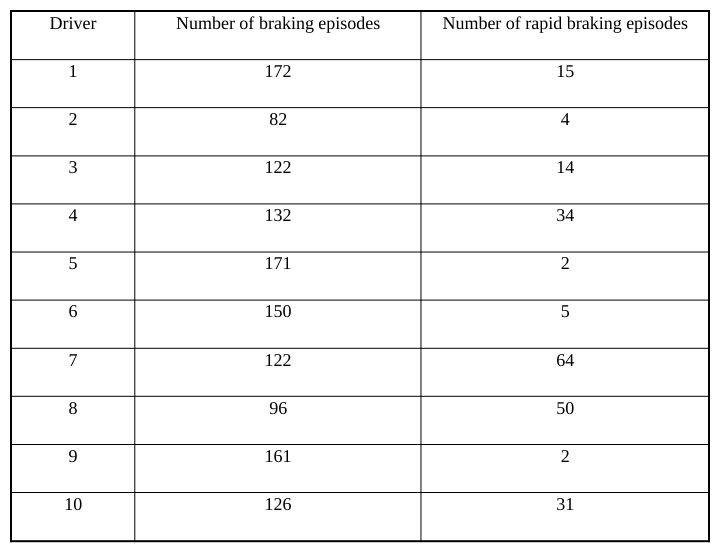
Assessment of the strategy for smooth driving was based on the braking characteristics during both rides. The analysis of the number of smooth and rapid braking episodes is given in table 3, and their proportions are presented in Fig. 4.
Table 3. Number of smooth and rapid braking episodes in individual drivers Driver Number of braking episodes Number of rapid braking episodes
Fig. 4. Proportions of smooth and rapid braking episodes in individual drivers
9
RAPID BRAKING EPISODES
8
7
6
5
4
3
2
1
0 20 40 60 80 100 120 140 160 180 200
DISCUSSION
The preliminary results obtained in a group of 10 drivers allow the assessment of both their visual strategies while driving, as well as their overall strategy of driving. The results obtained using the FaceLab system point to strong preferences for gazing at the central zone of vision, including the road, especially its portion visible in front of the driver, and the traffic signs. Almost 40 % of the fixations occur at that zone and the fixation times are longest. This is a general trend, although individual differences are quite large.
The results of measurements of smooth and violent braking episodes show a very large discrepancy between the individual drivers. Individual differences, both in terms of absolute numbers and proportions are very important and may indicate a large difference in the driving strategy. These data will be correlated with the results of psychological tests of the drivers in a search for a relationship between temperament, personality, degree of susceptibility to stress, etc., and indicators of the type of inhibition. Detection of such a relationship would permit this method of evaluating the quality of driving to be used as an objective method.
CONCLUSIONS
The reported preliminary results confirm that eye-tracking is a method that allows for precise assessment of visual driving strategies. The studied group of 10 drivers is not sufficiently numerous to perform a statistical analysis.
Data from the simulation allow an accurate assessment of the quality of driving. This applies particularly to the braking strategy, but more detailed analysis of data on the evolution of the speed and acceleration also seems very promising.
The final results of the research shall make it possible to develop a program for optimization of driver training and improve traffic safety.
REFERENCES
Edquist, J., Horberry, T., Hosking, S. & Johnston, I. (2011). “Effects of advertising billboards during simulated driving”, APPL.
ERGON Volume 42 No. 4. Fiedler, S., Glöckner, A. (2012). “The Dynamics of Decision Making in Risky Choice: An Eye-Tracking Analysis”, FRONT PSYCHOL No. 3. Kandil, F.I., Rotter, A. & Lappe, M. (2010). ”Car drivers attend to different gaze targets when negotiating closed vs. open
bends”, J. VIS. Volume 10 No. 4. Lang L.. Qi H. (2008). “The Study of Driver Fatigue Monitor Algorithm Combined PERCLOS and AECS“, in: Proceedings of the International Conference on Computer Science and Software Engineering, Washington, DC, USA. Lehtonen, E., Lappi, O., Kotkanen, H. & Summala H. (2013). “Look-ahead fixations in curve driving”, ERGONOMICS Volume
56 No. 1. Muttart, J.W., Peck, L.R., Guderian, S., Bartlett, W., Ton, L.P., Kauderer, C., Fisher, D.L. & Manning, J.E. (2011). “Glancing and Stopping Behavior of Motorcyclists and Car Drivers at Intersections”, TRANSP. RES.REC Volume 2265. Rayner, K. (2009). “Eye movements in reading and attention in reading, scene perception, and visual search”, THE
QUARTERLY JOURNAL OF EXPERIMENTAL PSYCHOLOGY Volume 62 No. 8. Schleicher, R., Galley, N., Briest, S. & Galley, L. (2008). “Blinks and saccades as indicators of fatigue in sleepiness warnings: looking tired?”, ERGONOMICS Volume 51 No. 7. Shin, D., Sakai, H. & Uchiyama, Y. (2011). “Slow eye movement detection can prevent sleep-related accidents effectively in a
simulated driving task”, J. SLEEP RES Volume 20 No. 3. Trivedi, M.M., Gandhi, T. & McCall, J. (2007). “Looking-in and looking-out of a vehicle: Computer-vision-based enhanced vehicle safety“, IEEE TRANSACTIONS ON INTELLIGENT TRANSPORTATION SYSTEMS Volume 8 No. 1. Van Loon, E.M., Khashawi, F. & Underwood, G. (2010). “Visual strategies used for time-to-arrival judgments in driving“.
PERCEPTION Volume 39 No. 9.
LISTED IN THE AHFE DIGITAL BOOKSTORE CATALOGUE
Explore the complete digital volume
Advances in Science, Technology, Higher Education and Society in the Conceptual Age: STHESCA
Read this individual research paper free through the original publisher, or explore the full digital proceedings book.
ISBN 978-1-4951-2110-4
Explore this ISBN in the AHFE Bookstore ↗Listed in the July 2026 bookstore catalogue; search by ISBN to confirm current availability · Digital book purchase optional