Xinbo Wu, Rong Liu, Mohammad Mohiuddin Choudhury, Hung Kay Daniel Chow, Chongyang Ye, Hoi Hung Ho (2022). Infrared Thermal Mapping of Young Male Body following Different Physical Exercises. In: Human Factors for Apparel and Textile Engineering. AHFE Open Access, vol. 32, pp. 31–38. https://doi.org/10.54941/ahfe1001535
1 Institute of Textiles and Clothing, the Hong Kong Polytechnic University, Hong Kong SAR, China; Laboratory for Artificial Intelligence in Design, Hong Kong Science Park, New Territories, Hong Kong SAR, China ↗
2 Institute of Textiles and Clothing, the Hong Kong Polytechnic University, Hong Kong, SAR, China ↗
This study investigated the thermal mapping of the young male bodies following different physical exercises based on a designed experimental protocol. Thermal mappings of the male subjects when being resting, walking, and running for 48 minutes were recorded at the determined timelines using a digital infrared thermal detection system. The anterior and posterior body of the subject was divided into 54 specific zones. The experimental results indicated the body zones with the higher surface temperatures and the largest variations when performed protocoled exercises. The body sweating mapping was also visualized. The study method and outcomes provide a valuable reference for structure and material design of the functional / intelligent sensing garment system used for sports or physical exercises.
Temperature distribution of the human body is affected by complex factors such as heat exchange between the human body and the external environ- ment, physical exercises, body postures, lifestyles, habits, metabolic levels, and sympathetic nerve activities (Geneva et al. 2019). The types, intensities, and statuses of exercises can vary the functions of local tissues and promote blood circulation, in turn causing changes in body surface temperature (Amin et al. 2021, Beliveau et al. 2020, Low et al. 2020) and moisture distributions. Thermo biological diagnosis has been applied as one of the important appro- aches to monitor and evaluate athletes’ performance in sports. Body surface heat and thermal profiles under different sporty exercises provide nume- rous information that allow us to understand the physical fitness of athletes and also the appropriateness of the interventions (e.g., wearing modalities, clothing materials, or physiological sensors) in the application.
technology has been widely used in aerospace, military, and industrial fields, while its application in sporty monitoring and medical treatment remains under development. Owing to its efficiency, safety, and low cost, IRT has been increasingly regarded as a useful tool to detect body thermal changes through characterizing the increases or decreases of skin surface temperature and their thermal imaging have been also employed as one type of physiolo- gical sensor in sports training (Perpetuini et al. 2021) to monitor and prevent exercise injuries (Sillero-Quintana et al. 2021), estimate superficial vascular status (Leñero-Bardallo et al. 2021), and track athletes recovery (Ferreira- Júnior et al. 2021). However, to date, few studies have reported the changes of body surface temperature and sweating zones in one protocol under dif- ferent exercise levels and intensities. Therefore, the aims of this study were to 1) investigate the whole-body temperature distributions of young males under different physical exercise states based on a designed trial protocol, 2) determine the body zones showing the most obvious surface tempera- ture variations under different exercise conditions, 3) observe corresponding sweating patterns, and 4) compare thermal and sweating mappings between the studied subjects. The study outcomes will facilitate the understanding of the thermal and sweating profiles of exercise bodies and estimating sports performance with aid of an economic but effective approach.
METHODOLOGY
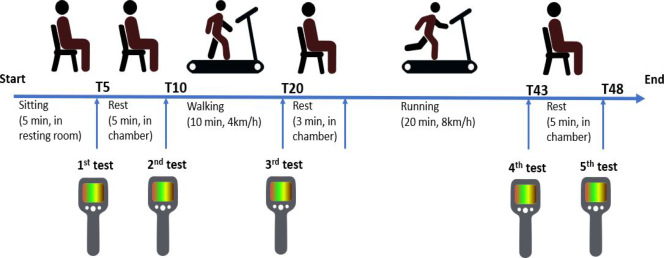
Experimental protocol: Two healthy male subjects (age:30 years old, wei- ght:60kg, and height:165cm; and age:32 years old, weight:58kg, and hei- ght:181cm) were recruited. Prior to the trial, the subjects completed the infor- med written consent that was approved by the Human Subjects Ethics Com- mittee of the Hong Kong Polytechnic University (HSEARS20210721003, 21/July/2021). Figure 1 illustrates the applied experimental protocol for lasting 48 mins in total. During experimental exercises, the subjects dres- sed in sports shorts and socks only without permission of using a towel to wipe sweat. They were instructed the trial procedures and performed a 5-min resting in a conditioned room with a temperature of 26.5±0.2oC and relative humidity of 50 ± 2%. Then the subject moved to an exercise chamber with a temperature of 29.1 ± 0.1oC and relative humidity of 40 ± 2% for another 5- min equilibrium. Following it, the subjects walked for 10-min on a treadmill at a stable velocity of 4km/h. After 3-min resting, subjects performed run- ning at the race of 8km/h for 20-min, then followed by a 5-min resting in the same exercise chamber. Subjects’ body surface temperatures were recorded at the five different moments, that is, after 5 mins of resting in the conditioned room (T5), after 5-min of resting in the exercise chamber (T10), after 10-min walking exercise (T20), after 20-min running exercise (T43), and after 5-min resting in the chamber at the end of the trial (T48).
Thermographic image capture and temperature zone determination: The studied subjects were positioned in an orthostatic position during thermogra- phic recording. Four thermographic images were recorded at each specific testing moment by using a thermographic camera (model: E8-XT, FLIR Systems, Sweden; thermal sensitivity: 0.05oC; resolution: 320 × 240 pixels;
Infrared Thermal Mapping of Young Male Body following Different Physical Exercises 33
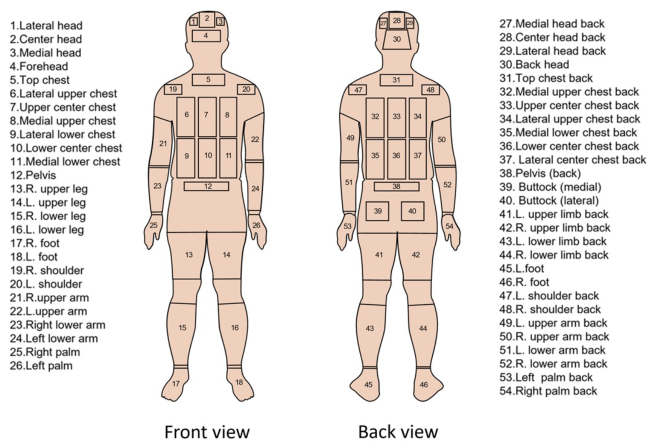
Figure 1: The designed experimental protocol.Figure 2: The determined 54 body zones for thermal mapping and analysis (L: left, R: right).
temperature range: -20–550 oC; spectral range: 7.5–13 µm; and accuracy of ±2%). The camera was placed at 1 meter far from the front and back sides of the subjects, respectively. Fifty-four quadrangles configuration zones over the whole body were divided including, (a) 26 zones at anterior body and (b) 28 zones at posterior body. Figure 2 depicts the sites of the divided 54 body temperature zones for thermal analysis. The mean values of the temperature pixels within each zone were processed and analyzed by using FLIR TOOL software (FLIR, Sweden).
RESULTS AND DISCUSSIONS Thermal Distribution Over Body Surface Zones
Table 1 indicates the maximum and minimum temperature values distribu- ted at the determined body zones of the studied two male subjects during
Table 1. Temperature values distributed at the tested body zones of the studied subjects.
Table available in the original PDF paper.
Test time Order The highest temperature zones The lowest temperature zones Subject 1 Subject 2 Subject 1 Subject 2 Zone Max. Zone Max Zone Min Zone Min. No. Temp. No. Temp. No. Temp. No. Temp.
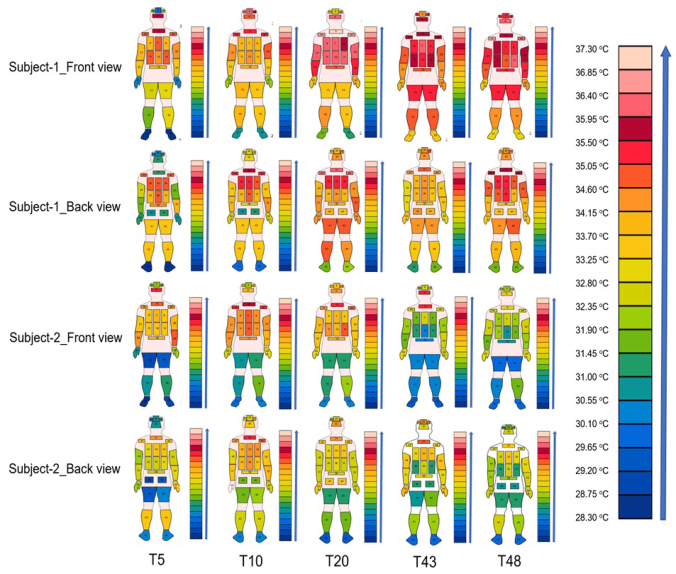
the different recording times. Obvious variations on the body surface tempe- rature were found when subjects were being different exercise conditions. For example, subject 1 showed 28.3–35.9oC on average in resting and 31.3–36.1oC on average in running. The zones with higher temperatures concentrated at the upper body and the head, while the zones with lower temperatures distributed at the lower limbs and upper arms.
Thermal Mapping Analysis
Figure 3 illustrates the temperature distribution diagrams of the two studied subjects at their anterior and posterior bodies when being under different conditions (that is, at different recording moments, T5, T10, T20, T43 and T48) according to the trial protocol. In general, the lowest and the high- est average temperatures were observed at conditions 1 (T5: after 5 mins of resting in the conditioned room) and 3 (T20: after 10-min walking exercise in the chamber), respectively.
Infrared Thermal Mapping of Young Male Body following Different Physical Exercises 35
Figure 3: Body mapping of the thermal distribution at different recording times.
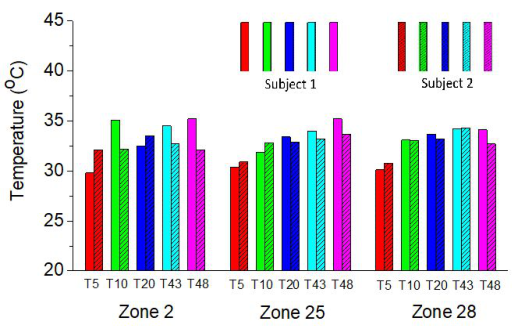
In general, the two subjects presented different trends in thermal mapping when being exercise conditions. The obvious differences between the two subjects on the body surface temperature can be found at zones 2 (foreh- ead), 25 (right palm) and 28 (back head) from conditions 1 to 5 as shown in Figure 4.
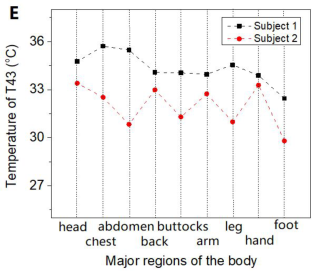
Figure 4: Obvious differences on the body surface temperatures between the two subjects at the three testing zones.Figure 5: Skin surface temperature distributed at the nine major body regions of the two subjects at the five different recording times (A: nine major body regions; B: T5; C: T10; D: T20; E: T43 and F: T48).
Temperature Variations within one Exercise Cycle The 54 body zones were further integrated into the nine major regions: (a) head (8 zones: 1, 2, 3, 4, 27, 28, 29 and 30), (b) chest (6 zones: 5, 6, 7, 8, 19 and 20), (c) abdomen (4 zones: 9, 10, 11 and 12), (d) back (9 zones: 31, 32, 33, 34, 35, 36, 37, 47 and 48), (e) buttocks (3 zones: 38, 39 and 40), (f) arm (8 zones: 21, 22, 23, 24, 49, 50, 51 and 52) (g) leg (8 zones:13, 14, 15, 16, 41, 42, 43 and 44), (h) hand (4 zones: 25, 26, 53 and 54), and (I) foot (4 zones: 17, 18, 45 and 46), as shown in Figure 5A. The temperatu- res of all the major body parts were calculated manually from the absolute
Infrared Thermal Mapping of Young Male Body following Different Physical Exercises 37
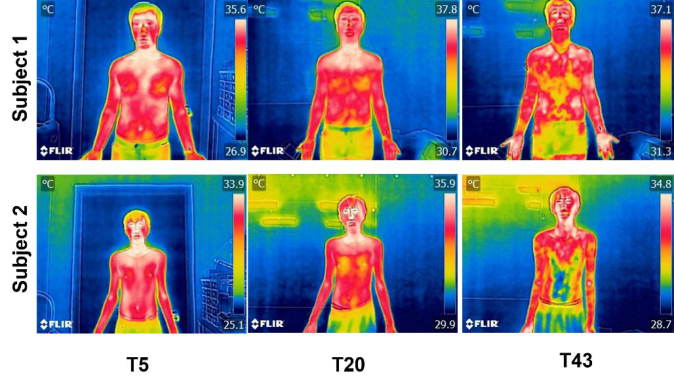
Figure 6: Analysis of sweating zones of the two subjects under different recording times after performing different exercises.
mean of the average temperatures of the included body zones by using FLIR TOOL software. Figure 5 (B-F) illustrates the skin surface temperature values of the nine major body regions of the two subjects at the five different recor- ding times. The temperature values at the nine body regions maintained the similar distribution profiles for the two subjects. However, the variations of temperature values exist difference. For example, the temperature values of subject 1 on head and upper body increased significantly when transitioned from a rest state to an exercise state while the temperature of subject 2 did not increase but decrease at the most body regions. It was found that sub- ject 2 produced plenty of sweat when being running, which could take away more body heat in turn causing a drop in the skin surface temperature. This result was consistent with the sweating data analysis.
Sweating Mapping Analysis
Figure 6 shows the infrared thermograms of the two subjects under the three testing conditions (resting T5, after walking T20, and after running T43). Obvious changes in body surface temperature occurred at the subjects’ ante- rior chest and abdomen which were largely caused by the increased exercise intensities from resting to running conditions. Meanwhile, the sweat liquid staying at the body surface induced the decreased body temperature, for example, a Y-shaped sweating area was observed at the chest and abdomen in the recording time T43 on subject 2.
CONCLUSION
In this study, the distributions and changes of body surface temperature and sweat mappings of young male subjects were investigated with the aid of infrared thermal imaging technology when the subjects performed different
sports exercises. The study results indicated that the higher body surface tem- perature distributed at the heads and chests of the studied subjects. More differences on the body surface temperatures between the two male subjects occurred at the heads, feet, and hands. Moreover, a Y-shaped sweating area appeared on the subject’s anterior chest and abdomen after intensive exerci- ses. These results provide a valuable quantitative and qualitative reference for enhancing the understanding of body surface thermal and moisture distri- butions for functional material/clothing design and wearable or intelligent product development in future work.
ACKNOWLEDGMENT
The authors would like to acknowledge Innovation and Technology Fund through project ITP/097/18TP, the Laboratory for Artificial Intelligence in Design through project RP1-5, Innovation and Technology Fund, Hong Kong SAR, and Departmental General Research Fund of the Hong Kong Polytechnic University through project G-UAHB to support this study.
REFERENCES
Amin SB, Hansen AB, Mugele H, Willmer F, Gross F, et al. (2021). Whole body passive heating versus dynamic lower body exercise: a comparison of peripheral hemodynamic profiles. Journal of Applied Physiology, 130, pp. 160–171. Beliveau J, Perreault-Briere M, Jeker D, Deshayes TA, Durán-Suárez A, et al. (2020).
Permanent tattooing has no impact on local sweat rate, sweat sodium concentra- tion and skin temperature or prediction of whole-body sweat sodium concentra- tion during moderate-intensity cycling in a warm environment. European Journal of Applied Physiology, 120, pp. 1111–1122. Ferreira-Júnior JB, Chaves SF, Pinheiro MH, Rezende VH, Freitas ED, et al. (2021).
Is skin temperature associated with muscle recovery status following a single bout of leg press? Physiological Measurement, 42, 034002. Geneva II, Cuzzo B, Fazili T, Javaid W. (2019). Open forum infectious diseases, Oxford University Press US, ofz032. Leñero-Bardallo J, Serrano C, Acha B, Pérez-Carrasco J, Bernabeu-Wittel J. (2021).
Thermography for the differential diagnosis of vascular malformations. Clinical and Experimental Dermatology, 46, pp. 314–318. Low DA, Jones H, Cable NT, Alexander LM, Kenney WL. (2020). Historical reviews of the assessment of human cardiovascular function: interrogation and understan- ding of the control of skin blood flow. European Journal of Applied Physiology, 120, pp. 1–16. Perpetuini D, Formenti D, Cardone D, Filippini C, Merla A. (2021). Regions of inte-
rest selection and thermal imaging data analysis in sports and exercise science: a narrative review. Physiological Measurement,42(8), 08TR01. Sillero-Quintana M, Gomez-Carmona PM, Fernández-Cuevas I. (2021). Infrared thermography as a means of monitoring and preventing sports injuries, in: book of Innovative Research in Thermal Imaging for Biology and Medicine, IGI Global, pp. 165–198.
LISTED IN THE AHFE DIGITAL BOOKSTORE CATALOGUE
Explore the complete digital volume
Human Factors for Apparel and Textile Engineering
Read this individual research paper free through the original publisher, or explore the full digital proceedings book.
ISBN 978-1-958651-08-7
Explore this ISBN in the AHFE Bookstore ↗Listed in the July 2026 bookstore catalogue; search by ISBN to confirm current availability · Digital book purchase optional