Norbert Gomolla, Herwig Zeiner, Roland Unterberger, Raúl Miñón Jiménez, Philipp Hartlieb (2022). Time-Aware and Spatial Oriented Driven User Interfaces in the Context of Safe Zones for Underground Mining. In: Cognitive Computing and Internet of Things. AHFE Open Access, vol. 43, pp. 23–29. https://doi.org/10.54941/ahfe1001835
This paper deals with visualization of time and safety critical data collected in underground mining operations. These data contain information of the rock mass and its behavior, the environmental conditions as well as general geometric, and time dependent information. Eventually, the combination of the data shall secure safe and sustainable extraction of valuable raw materials by combining information from a wide range of sensors in a data-driven Internet of Things platform, performing suitable evaluations, and, finally, feeding back the extracted learning to all stakeholders involved in a convenient and platform independent way from mine management to foremen and equipment operators. The results are novel visualization techniques for underground mining. The most suitable UIs in heavy duty mining operations are robust and customizable, using latest web technology in their dashboards. Depending on the required user category, the dashboard display may be configured accordingly. In this work we focus on the workers’ and the mine operators’ (e.g. underground, on-site workers including technicians and engineers) needs to display in real-time relevant operational information on immediate or urgent tasks/actions.
Underground mining is extremely relevant for the supply of raw materials which are extracted from deep layers of the earth by complex processes. Due to the characteristics of mines, mine operators and their workers must carry out their duties in critical and hazardous environments such as dea- ling with complicated geotechnical conditions where rock bursts or other seismic events could occur (Wagner 2019). Consequently, mining processes must guarantee adequately stable underground conditions, including also atmospheric working environments, control of emissions, and controlled
interaction between people and machines. This is of utmost importance for a safe and sustainable mining operation.
Fortunately, digitization in mining is progressing thanks to several sci- entific advances. The advances are mainly made in IoT with increasingly energy-efficient sensors, in network infrastructure, and in deployment of new data-driven IoT platforms with latest web technologies. With this, new forms of integrated applications are being built and deployed in mining. For insta- nce, traditionally, rock bolts, alongside with wire mesh and shotcrete, are utilized to maintain the shape and structure of underground environments. Currently, with decreasing prices and sizes of suitable sensors, so called “Intelligent Rock Bolts” have emerged aiming and providing feedback on the stresses forces and stresses acting on the rock bolts in a very dense network (spacing of bolts is in the range of 1*1m). This allows to draw conclusions about the integrity of the entire underground structure, i.e detecting defor- mations or upcoming hazardous situations, in almost real time (Song 2017; illuMINEation 2021; Nöger et al 2021). Hence, safety of mining operations can be boosted by providing an IoT platform with Big Data support able to manage the data acquired from sensors installed throughout the mine, pro- cessing it, and, finally, providing real-time alarms and notifications when specific dangers are detected or even trigger an actuator.
However, besides the management of the data, in order to adequately inte- ract with mine workers, specific user interfaces including useful visualizations for the mining context need to be provided. These new user interfaces must support underground workers in a new way. They require the right informa- tion at both the right place and time and will be used in the mine as well as support mine management in the planning and operation phases. For this purpose, time-aware visualizations incorporating spatial information in an integrated fashion must be conceptualized for the underground workers.
In addition, the geometrical situation underground is constantly changing, as this is where the raw material is being mined. Consequently, during mining progress, the information and the associated visualization must be constantly adapted. In the implementation of safety zones, the information obtained is primarily used to track the operating status in the mine and to provide the workers with the best possible support in their work.
The contribution of this paper is the proposal of these novel user interfaces dedicated to assist underground workers while improving their safety in the context of safe zone in mine domains. For this purpose, key requirements are considered including the necessity of adaptive user interfaces, the adequate support for time-aware and spatial oriented visualizations, and the possibi- lity to configure the user interfaces taking aspects like the target device or the user profile into consideration. Moreover, the underlying technical compo- nents required to integrate these interfaces with a Big Data / IoT platform are described.
Background and Related Work This section describes the background and related work in several relevant topics in the field of safety zones in mining, time-aware and location-aware
Time-Aware and Spatial Oriented Driven User Interfaces in the Context of Safe Zones 25
visualization, and the integration in relevant data-driven Internet of Things Platforms.
In contrast to many other industrial sectors, mining operations usually deal with constantly changing conditions, both in space/geometry and time. In this context, i.e. information on the behavior of the rock mass when expo- sed to stress changes induced by excavation processes and opening of new underground spaces is an essential tool for planning and even more for safe and sustainable operations. New approaches are made to enhance the under- standing of the mining environment by implementing advanced sensors in all stages of the excavation process. The information gathered contains data on elongation, stress, and deformation acting on rock bolts and general rock sup- port measures (Song et al. 2017; Singh et al. 2018), mining induced seismicity and micro-seismic events, geologic, geochemical, and structural information of the rock and rock mass (Navarro et al. 2018) as well as information on environmental conditions (i.e. air quality). All this data is available in 3D in combination with the time-line (measurement spacing can range betw- een cm- and m-scale and frequency can be anything from seconds to daily or monthly). In order for achieving information on the safety of operations and identifying potentially hazardous situations, this data has to be combi- ned with the actual position of the workforce and mining equipment, both in mining infrastructure and current working areas. illuMINEation, a cur- rent project funded by the European Union’s Horizon 2020 program, tackles the above mentioned issues by implementing new and innovative sensors in mining operations, but also using existing information and “old-school”mea- surement systems, and finally feeding this information to an IoT-platform capable of combining the data sets in a meaningful way, deriving suitable output on safety and efficiency of operations.
Visualization aims to gain insights through the visual representation of data. This implies that data is the basis for any kind of visualization. There- fore, research on visualization techniques, concepts or methods must be based on a description of the type of data addressed. In our case, the application domain is mining; in particular, the analysis of time- and location-oriented data is an important task in many application scenarios. Numerous resea- rch papers on this topic have been published in recent years. Most of them deal only with one specific problem. It is enormously difficult to consider all aspects for the end user when visualizing time and location-oriented data. However, in recent years, a variety of techniques for visualizing such data has been published. Especially Aigner (Aigner 2011) gives an excellent ove- rview of the time-oriented aspects of data visualization. Additionally, Bernard (Bernhard et.al. 2019), Yuan (Yuan et.al 2021), and Hassan (Hassan 2021) can be named as relevant literature.
Regarding the integration with data platforms, in the last years several platforms aiming at managing data at distinct levels of the data life-cycle are emerging. Generally, these platforms offer a way to visualize the data or at least a service layer suitable for being connected with external user interfaces or dashboards. For instance, Cloudera (Cloudera 2022) provides the possibility to create customized dashboards and AWS promotes the use of third-party products to visualize data such as DOMO, QLINK, TIBCO
(AWS 2022). However, this general purpose visualization tool does not provide the specific visualizations proposed in this paper for the mining domain.
USER INTERFACES IN THE CONTEXT OF SAFE ZONES FOR UNDERGROUND MINING In this section, we give a brief outline of our multidisciplinary research meth- odology. Typical IoT-applications work with sensor data. These are usually processed accordingly. After this initial pre-processing of the data, it is either visualized immediately or even more complex analysis procedures are applied and then the data sources are visualized. When dealing with visualization, the involvement of the user is of crucial importance. User involvement is done for validating mock-ups and proof-of-concepts.
New Visualization Concepts In the mining sector, desktop applications that are not connected through a network with each other are often still used. Each application has its own specific form of visualization. This is sufficient when individual decisions are made. However, when integrated decisions must be made, a new form of visualization is needed. In order to make informed decisions, a holistic overview of information, states, and situations is required as well as special subject-specific detailed visualizations or diagrams. To do so, users at various locations and on different devices (workstations, notebooks, tablets or smart- phones) with a specific operating system use different visualization software. Consequently, to meet these key requirements, a web-based approach was chosen.
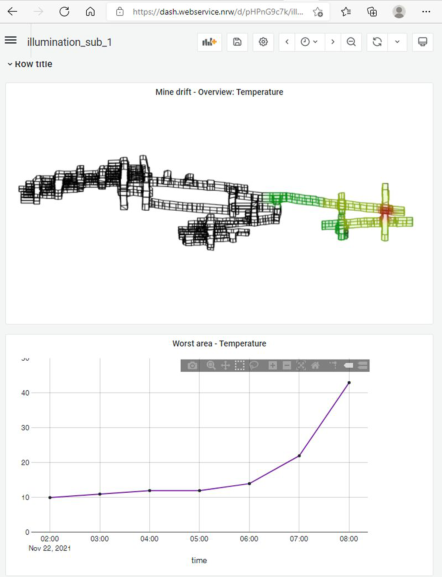
In this scenario, the main objective is to properly relate spatial informa- tion with temporal information in a single and intuitive user interface. This requires data to be efficiently and near real-time managed for a suitable preparation for adaptive visualization, which is critical in the mine domain where the environment is constantly being changed by the operations perfor- med. In this domain, the available data are mostly time series, videos, point clouds, and 3D drawings and maps, which have to be represented in the visualization. To be able to use these data for location and time dependent visualizations, an appropriate storage system is needed supporting spatial and temporal queries. Then, from this data, further information is calculated and combined to create new visualizations. Figure 1 provides an example of this concept where the drawing of a mine drift together with temperature repre- sentation is shown. The representation of the mine follows the selected time range in the temperature diagram.
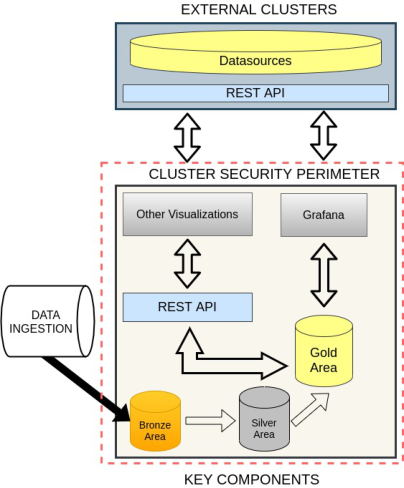
Integration in an Internet of Things Platform The provision of a novel user interface requires an underlying platform to address key aspects such as the data storage or access. For this purpose, Figure 2 presents key components required to deal with these issues and, as a consequence, establishes a favorable scenario to boost the desired user interfaces.
Time-Aware and Spatial Oriented Driven User Interfaces in the Context of Safe Zones 27
Figure 1: Mine drift and temperature flow.Figure 2: Key components to support novel user interfaces.
External components must satisfy the cluster security perimeter require- ments to interact with inside components. Regarding visualizations, Grafana is proposed to provide complex dashboards. However, when required, this approach allows also the integration of other types of user interfaces. Three distinct data areas have been designed: 1) bronze for raw data ingested from other sources, 2) silver for data prepared as input for operational or analytic processes, and 3) gold for data suitable to be provided to the users.
This approach can be extrapolated to the cloud continuum, enabling the deployment of these components in edge-fog-cloud computing layers while considering the specifications of each layer. In this way, edge layers can be considered inside the mine to manage distinct sensors/devices, fog layers out- side the mine boosting data aggregations and merging data from distinct sources, and cloud layers to analyze data from distinct mines. For this pur- pose, inter-layer communication is provided by using streaming technologies such as the publish-subscribe paradigm.
INITIAL TESTS AND FIRST RESULTS The overall approaches were tested within the European Research project illuMINEation (illuMINEation-Project 2021). Together with the universities, mining equipment manufacturers, and mine operators, the main points for a safety zone concept were established. Surveys and focused meetings were held for this purpose. On their basis, concepts for improved measurement, evaluation, and display of, for example, rock mass stability and atmospheric environment were developed. After initial tests with simulated and offline data, the visualization concepts were presented to stakeholders and then tests were conducted in mines. The scope of installations in mines will now be increased and user experience with the system will be incorporated to improve usability.
In addition to these initial tests, we performed simulations with rock bolts. This generated data was then also used for our visualization tests. These simulations and tests show that rock mass stability and atmospheric condi- tions can be better captured by increasing sensor density. As a consequence, a higher sensor density leads to more complex user interfaces. With parame- terizable novel dashboards and a linkage of spatial images of the mine with these measurement data, this challenging complexity is handled. During the first tests, this procedure has proven itself.
CONCLUSION
In this paper we have discussed the development of novel user interfaces in the context of mining. The use time and location dependent information was justified in a single and usable user interface to boost future applications of many relevant novel visualizations in critical environments. Moreover, the safety zone scenario was briefly outlined to present an example of these cri- tical contexts. In this work we also briefly highlighted the complexity of integrating and building these user interfaces. From our point of view it is important that flexible web-based and parameterizable solutions are used
Time-Aware and Spatial Oriented Driven User Interfaces in the Context of Safe Zones 29
here, which can also be easily adapted to new requirements in this challenging environment. In future work, we will extend the implementation of this novel concept to extrapolate it to changing visualization requirements of other use cases.
ACKNOWLEDGMENT
This work has received funding, in the context of IlluMINEation pro- ject, from the European Union’s Horizon 2020 research and innovation programme under grant agreement No. 869379.
REFERENCES
Aigner, W., Miksch, S., Schumann, H., & Tominski, C. (2011). Visualization of timeoriented data. Springer Science & Business Media. AWS third-party Dashboards (2022): https://aws.amazon.com/marketplace/solutio
ns/data-analytics/data-visualization-dashboards. Accessed: 2022-02-11 Bernard, J., Hutter, M., Reinemuth, H., Pfeifer, H., Bors, C., & Kohlhammer, J. (2019). Visual-Interactive Preprocessing of Multivariate Time Series Data. In Computer Graphics Forum (Vol. 38, No. 3, pp. 401–412). Cloudera Dashboards (2022) https://docs.cloudera.com/documentation/enterprise
/6/6.3/topics/cm_dg_dashboards.html. Accessed: 2022-02-11 Hassan, K. A. (2021). It’s About Time: User-centered Evaluation of Visual Representations for Temporal Data (Doctoral dissertation, Linköping University Electronic Press). illuMINEation-Project (2021). https://www.illumineation-h2020.eu/. Accessed 2022-02-11 Navarro, J., Sanchidrián, J. A., Segarra, P., Castedo, R., Costamagna, E., & López, L.
M. (2018). Detection of potential overbreak zones in tunnel blasting from MWD data. Tunnelling and Underground Space Technology, 82, pp. 504–516. Nöger, M., Hartlieb, P., Moser, P., Griesser, T., Ladinig, T., Dendl, D. (2021). The potential of a mine-wide digital rock mass condition monitoring system. In 5th International Future Mining Conference. Singh, A., Singh, U. K., & Kumar, D. (2018, March). IoT in mining for sensing,
monitoring and prediction of underground mines roof support. In 2018 4th International Conference on Recent Advances in Information Technology (RAIT) (pp. 1–5). IEEE Song, G., Li, W., Wang, B., Ho, S. C. M. (2017). A review of rock bolt monitoring using smart sensors. Sensors (Basel, Switzerland) 17(4), 776. https://doi.org/10. 3390/s17040776 Wagner, H. (2019). Deep mining: a rock engineering challenge. Rock Mechanics and
Rock Engineering, 52(5), 1417–1446. Yuan, J., Chen, C., Yang, W., Liu, M., Xia, J., & Liu, S. (2021). A survey of visual analytics techniques for machine learning. Computational Visual Media, 7(1), 3–36.
LISTED IN THE AHFE DIGITAL BOOKSTORE CATALOGUE
Explore the complete digital volume
Cognitive Computing and Internet of Things
Read this individual research paper free through the original publisher, or explore the full digital proceedings book.
ISBN 978-1-958651-19-3
Explore this ISBN in the AHFE Bookstore ↗Listed in the July 2026 bookstore catalogue; search by ISBN to confirm current availability · Digital book purchase optional