Lucas Paletta, Wolfgang Weiss, Ciprian Alexandrescu, Diana Nastase, Michael Schneeberger, Martin Pszeida, Sandra Draxler, Jochen A Mosbacher, Herwig Zeiner (2026). Stress and Recovery Signatures from Wearable Biosignal Data in the Production Environment. In: Cognitive Computing and Internet of Things. AHFE Open Access, vol. 205, pp. 186–196. https://doi.org/10.54941/ahfe1007373
Production work involves time pressure, variable workload, and shift schedules that may contribute to sustained psychophysiological strain. Wearable sensing can support continuous, low-burden monitoring of stress and recovery and may inform resilience-oriented workplace interventions. This pilot study examined stress and recovery signatures in an industrial electronics production context by combining multi-day wearable biosignal tracking with validated self-assessments. Sixteen employees, predominantly shopfloor operators, participated in a one-week field study across four shifts, including two day shifts and two night shifts. The sample included 8 women and 8 men (M age = 47.3 years, SD = 10.7). Participants wore a biosignal tracker during work, leisure time, and sleep. Measures included heart rate, heart rate variability[DS1.1][l1.2] (HRV), baseline calibration during sitting and standing, and questionnaires assessing resilience, perceived stress, well-being, affect, and short-term recovery-stress states. Analytics of wearable data focused on shift-level HRV changes and rule-based bouncing-back features, including stress peaks, peak amplitude, and recovery time. Results indicated mostly normal-to-high resilience, low-to-normal perceived stress, and generally preserved well-being, although some participants showed reduced well-being and high perceived stress. The short version of Perceived Stress Scale (PSS-4) total scores were negatively associated with HRV, and day shift analyses linked decreasing HRV to increasing mental strain. Additionally, the rate of stress peaks that caused long-term recovery periods was positively associated with the change in short-term physical-strain scores. The findings support the feasibility of wearable biosignal analytics for exploratory stress and recovery assessment in production work.
Advanced production systems increasingly depend on human operators who work under fluctuating workload, time pressure, changing task demands, and shift schedules. These demands can contribute to psychophysiological
Stress and Recovery Signatures From Wearable Biosignal Data 187 strain when recovery opportunities and individual resources are insufficient. At the same time, resilience and adaptive coping may buffer adverse effects and support sustained work capacity (Karhula et al., 2013; Paletta et al., 2024; Lenger et al., 2025; Paletta et al., 2025). The present pilot study addresses this demand-resource balance in a real electronics production environment by combining wearable biosignal monitoring with self-assessment.
The study was conducted at an advanced electronics manufacturing site and followed employees across one week including two day shifts and two night shifts. Stress and recovery were conceptualized as dynamic processes rather than as single-point outcomes. The study data underlying this paper describe HRV as lower during work and late-night periods, moderate during pauses, and higher during sleep, indicating that physiological strain and relief can be represented as time-varying biosignal signatures across work, breaks, leisure, and sleep.
The paper reports the available cohort characteristics, study workflow, self-report instruments, heart rate and HRV framework, and the experimental results contained in the study material. The contribution is a pilot-level evaluation of whether wearable HRV being– specified by SDNN (Standard Deviation of Normal-to-Normal intervals; Shaffer & Ginsberg, 2017), shift- level deltas, and rule-based recovery features can be meaningfully related to perceived stress, well-being, resilience, and short-term recovery-stress states in production work.
RELATED WORK
Occupational stress research increasingly conceptualizes stress as a psychophysiological process involving perceived demands, available resources, and recovery opportunities. The Perceived Stress Scale (PSS) quantifies the extent to which situations are appraised as unpredictable, uncontrollable, and overloaded (Cohen et al., 1983). The present study used the four-item short form, PSS-4, which was introduced for efficient survey- based assessment of perceived stress (Cohen & Williamson, 1988).
Heart rate variability (HRV) is a central marker of autonomic regulation. Standard HRV guidelines define time-domain metrics such as SDNN as indices of variability in normal-to-normal intervals and emphasize that interpretation depends on recording context, duration, artefact handling, and physiological state (Task Force, 1996). High HRV-SDNN indicates better autonomic flexibility and stress resilience, whereas low HRV-SDNN indicates reduced adaptability and higher physiological strain. Recent reviews describe SDNN and related metrics as indicators of regulatory adaptability across short and longer monitoring windows (Shaffer & Ginsberg, 2017). Meta-analytic evidence supports HRV as a stress-sensitive marker, while also highlighting heterogeneity across stressors, protocols, and application contexts (Kim et al., 2018).
The neurovisceral integration perspective links HRV to prefrontal- autonomic regulation, self-regulation, and flexible adaptation (Thayer et al., 2009; Thayer et al., 2012). This perspective is especially relevant
for resilience-oriented workplace assessment, because higher HRV is not merely an indicator of low arousal but can also reflect preserved regulatory capacity under demand. Therefore, HRV can be interpreted alongside self- reported resilience and well-being rather than only as an inverse stress marker.
Resilience assessment in this study is grounded in the Brief Resilience Scale (BRS), which directly targets the ability to recover or bounce back from stress (Smith et al., 2008). This construct is closely aligned with the study innovation of estimating stress events, stress peaks, peak amplitude, and recovery time from wearable biosignal streams. Subjective well-being was assessed with the WHO-5 Well-Being Index, a brief and widely reviewed measure of psychological well-being (Topp et al., 2015).
Momentary affective state was assessed using a PANAS-based short form. The original PANAS distinguishes positive and negative affect and is suitable for state-sensitive repeated assessment (Watson et al., 1988). The 10-item form “PANAS-N” used in the study is closest to the International Positive and Negative Affect Schedule (Short Form, I-PANAS-SF), while retaining items from the PANAS item family (Thompson, 2007).
The four-item SRSS (Short-term Recovery-Stress States) questionnaire assessed the current recovery–stress states across recovery and stress dimensions, based on the conceptual structure described in Kellmann et al. (2018). The items represented physical and emotional strain as well as physical and mental recovery, enabling repeated low-burden assessments at defined timepoints within each shift.
In manufacturing, combining continuous HR/HRV tracking with repeated questionnaire sampling is valuable because production work contains both high-demand episodes and potential recovery phases. The protocol by Paletta et al. (2025) proposed wearable-based estimation of recovery-stress states at manufacturing sites and provides the methodological precursor for the bouncing-back and recovery-time logic evaluated in the present pilot dataset.
STUDY PLAN The study was designed as a one-week field study at an advanced electronics manufacturing site (Timisoara, Romania). Sixteen employees participated, with a balanced sex distribution of 8 women and 8 men. Participants were predominantly shopfloor and technical employees, and the study period comprised four shifts: two day shifts and two night shifts.
Participants wore a biosignal tracker (Garmin Vivosmart 5; Garmin Ltd., Switzerland) throughout the study period, including work, leisure time, and sleep where available. The wearable data comprised heart rate (raw and smoothed HR) and heart rate variability quantified as SDNN in milliseconds.
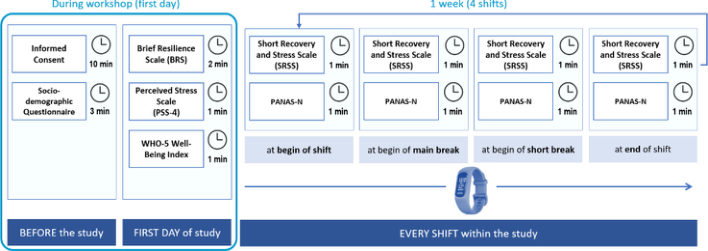
Figure 1: Study workflow for the resilience field study, including baseline questionnaires during the introductory workshop and repeated SRSS/PANAS-N assessments at defined shift timepoints combined with continuous wearable biosignal tracking.
The study started with an introductory workshop on the first day (Figure 1). Before field measurements began, participants completed informed consent, which took approximately 10 minutes, followed by a socio-demographic questionnaire of about 3 minutes. On the first study day, participants then completed three baseline self-assessment instruments: the Brief Resilience Scale (BRS; about 2 minutes), the Perceived Stress Scale (PSS-4; about 1 minute), and the WHO-5 Well-Being Index (about 1 minute). This workshop phase established the baseline assessment before the repeated shift measurements.
The English questionnaires were translated into Romanian, expert- reviewed, and independently back-translated, confirming consistency with the original English items before administration in Romanian.
During the study week, measurements were conducted within each shift. At four predefined timepoints - beginning of shift, beginning of the main break, beginning of the short break, and end of shift - participants completed short, repeated questionnaires. At each timepoint, the Short Recovery and Stress Scale (SRSS) and the PANAS-N short form each required about 1 minute. In parallel, the wearable tracker continuously recorded physiological signals, enabling linkage of HR/HRV patterns with repeated subjective stress, recovery, and affect assessments.
The study combined continuous wearable biosignal recording, baseline calibration, and repeated self-assessments. The tracker recorded HR continuously throughout the study period. HRV-SDNN was recorded continuously during work and, depending on individual participation and motivation, also during leisure time and sleep. A short baseline calibration during the introductory workshop compared sitting and standing conditions to support physiological interpretation.
Self-report measures covered trait-like and repeated state assessments. The BRS captured resilience and individual bouncing-back capacity, while the PSS-4 captured perceived stress using the total score (maximum score = 16). Subjective well-being was assessed with WHO-5. During shifts, PANAS-N measured affective state and SRSS captured short-term recovery-stress states at shift start, breaks, and shift end.
METHODS FOR STRESS AND RESILIENCE COMPUTING The computational approach used wearable HR and HRV data as continuous physiological indicators and combined them with validated or scale-inspired self-reports. HRV was represented as SDNN in milliseconds. In the study logic, lower HRV was interpreted as a potential stress-related signature during work and late-night phases, moderate HRV as partial recovery during pauses, and higher HRV as relief or recovery during sleep. This interpretation was treated as context-dependent rather than diagnostic at the individual level.
Shift-level stress signatures were computed from start-end deltas in HRV. The expected stress pattern was a negative HRV delta, indicating reduced autonomic variability across the shift, together with a positive change in subjective strain. Conversely, recovery or relief would be expressed by increased HRV and decreased subjective strain.
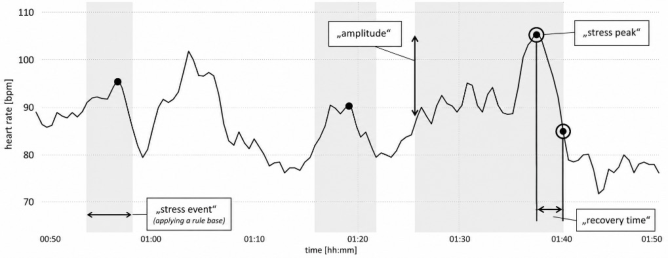
The second computation target was resilience-oriented recovery analysis. The concept was operationalized through bouncing-back and recovery time. It required rule-based detection of stress-relevant events in the biosignal stream, identification of the stress peak, quantification of peak amplitude, and estimation of the time needed to return toward a recovery state (Figure 2). A stress event was defined as a rule-based detection of a physiologically relevant episode. Heart rate was smoothed using a 5-min rolling median, and a stress peak was defined when HR exceeded the individual baseline by more than 2 SD. Peak amplitude described the deviation from baseline. Recovery time was calculated from the HR peak until HR returned below baseline + 1 SD within the subsequent 2–5 min window. Peaks not returning to this range were classified as prolonged-recovery events, indicating reduced bouncing- back capacity and sustained physiological strain.
Figure 2: HR peak and recovery time defining bouncing-back features.
Questionnaire-biosignal associations were evaluated using Pearson and Spearman correlations between HRV-SDNN and the PSS-4 total score. Item- level correlations were inspected for PSS-4 items and selected WHO-5 and BRS items. Because the pilot sample comprised n = 16 participants and several exploratory tests were conducted, all inferential results should be interpreted as nominal, hypothesis-generating evidence rather than confirmatory proof.
The main wearable-derived features were mean HRV-SDNN, delta HRV, stress-event frequency, stress-peak amplitude, and recovery time. Mean
Stress and Recovery Signatures From Wearable Biosignal Data 191 HRV-SDNN was interpreted as autonomic variability and regulatory flexibility. Delta HRV was defined as end-of-shift HRV minus start-of-shift HRV; negative values indicated reduced HRV across the shift. Delta score was defined analogously as end-of-shift self-report score minus start-of-shift score; positive values indicated increasing subjective strain.
EXPERIMENTAL RESULTS Descriptive Statistics
The cohort consisted of 16 employees from the industrial production site, with a balanced sex distribution of 8 female and 8 male participants. Participants had a mean age of 47.3 +/- 10.7 years, mean body weight of 84.2 +/- 15.1 kg, and mean height of 168.8 +/- 7.3 cm. Participants typically had about 5-10 years of work experience at Flex and about 5 years in their current position. The largest subgroup comprised shopfloor operators (n = 8), followed by technicians (n = 4), one supervisor, and one material controller; for two participants, the work category was not specified. Overall, the sample represented operational shopfloor and technical production work.
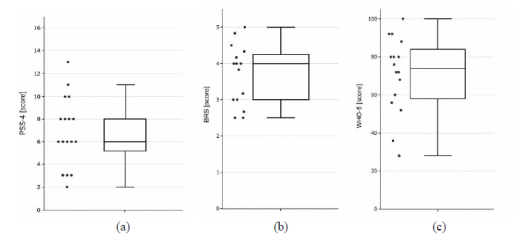
PSS-4 scores ranged from approximately 2.0 to 13.0, with a median close to 6.0 and an interquartile range of roughly 5.0–8.0 (Figure 3a). Thus, most participants reported moderate perceived stress, while higher stress levels were visible in a smaller subgroup of participants. BRS scores ranged from approximately 2.5 to 5.0, with a median close to 4.0 and an interquartile range of roughly 3.0-4.3 (Figure 3b). Thus, most participants reported moderate to high resilience, while reduced resilience was visible only in a minority of participants. WHO-5 scores covered a broad range from approximately 28 to 100, with a median around 73-75 and most participants scoring between about 58 and 84 (Figure 3c). This suggests generally preserved well-being, although the lower values around 28-36 indicate a small subgroup with reduced or very low well-being. The baseline self-reports characterize a cohort with moderate perceived stress, generally preserved resilience, and mostly normal well-being. The variability is important, however, because the lower WHO-5 values and higher PSS-4 scores suggest that individual strain profiles differed meaningfully across participants.
Figure 3: Distribution of baseline self-report scores for (a) perceived stress (PSS-4), (b) resilience (BRS), and (c) well-being (WHO-5) in the study cohort.
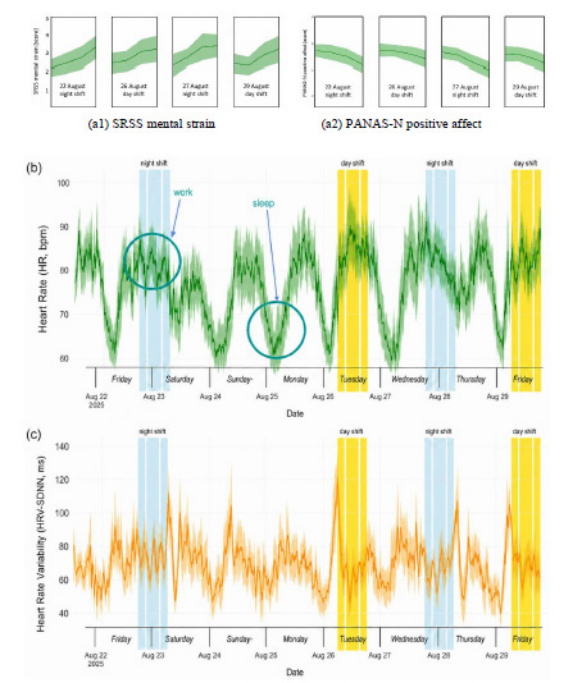
For the day shift start-end comparison reported in Figure 4a1, SRSS mental strain increased rom the beginning to the end of the shift. The chart data indicate start M = 2.44 and end M = 3.23, with corresponding dispersion
values SD = 1.03 and SD = 1.38. Figure 4a2 shows a decrease of positive affect within shift work.
Continuous heart-rate trajectories show pronounced fluctuations across work, leisure, and sleep periods in Figure 4b. Highlighted shift windows indicate elevated HR during work phases, while lower HR periods are consistent with recovery or sleep. Work time periods lasted 145-310 min. interrupted by breaks in each shift. In Figure 4c HRV-SDNN trajectories show time-varying autonomic variability across the same period. Lower HRV-SDNN during demanding or shift-related phases and higher values during recovery phases support the interpretation of HRV as a dynamic marker of strain and recovery. HRV-SDNN decreased from the beginning to the end of the shift, with chart values indicating start M = 87.17 ms and end M = 71.63 ms; corresponding dispersion values were SD = 26.15 ms and SD = 18.73 ms. This descriptive pattern is consistent with the expected stress signature: subjective mental strain increased while HRV-SDNN decreased across the shift.
Figure 4: Quantitative assessment of strain and physiological dynamics, depicting cohort-specific values of M and SD. (a1) SRSS mental strain and (a2) PANAS-N positive affect across shifts. (b) Continuous HRV-SDNN trajectory across the study week. (c) Continuous heart-rate trajectory with highlighted shift and recovery periods.
Stress and Recovery Signatures From Wearable Biosignal Data 193 Inference Statistics
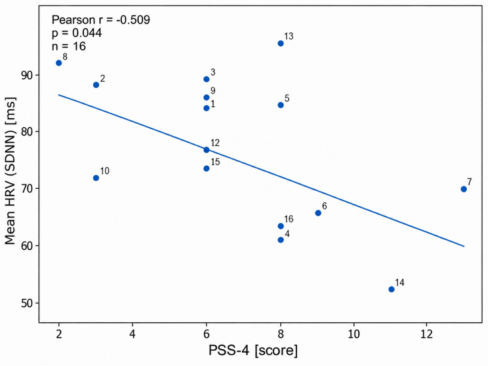
Figure 5 shows that the perceived-stress total score (PSS-4 total score) had a moderate negative association with mean HRV-SDNN. The Pearson correlation was r = –.509, p = .044*1, and the Spearman correlation was rho = –.554, p = .026* (Table 1). Participants with higher perceived stress therefore tended to show lower mean HRV-SDNN PSS-4 item-level correlations (Table 2) showed that PSS-4_4 (difficulties piling up so high that they could not be overcome) had the strongest negative association with HRV-SDNN. PSS-4_3 (things going one’s way) showed a positive association in its raw item direction; because this item is reverse- scored for the total PSS-4 stress score, its stress-direction interpretation is the inverse. PSS-4_1 and PSS-4_2 were not nominally significant. Additional nominally significant item-level associations were observed for WHO_1 (cheerful and in good spirits) and BRS_5 (coming through difficult times with little trouble), both positively associated with HRV-SDNN (Table 3). This pattern supports the interpretation that well-being and resilience-related coping are linked to higher autonomic variability.
The study also reports a day shift start-end association between biosignal change and mental-strain change: delta HRV was negatively associated with delta SRSS mental-strain score (Pearson r = –.428, p = .038). This result follows the expected direction, indicating that larger decreases in HRV were associated with larger increases in subjective mental strain.
Figure 5: Scatter plot showing the association between perceived stress (PSS-4 total score) and mean HRV-SDNN derived from wearable biosignal data.Table 1: Correlation between perceived-stress total score and HRV-SDNN.
Table available in the original PDF paper.
Variable Pearson r Pearson p Spearman rho Spearman p PSS-4 total score –.509 .044* –.554 .026*
1Note. * indicates statistically significant correlations at p < .05; ** indicates highly significant correlations at p < .01.
Table 2: PSS-4 item-level correlations with HRV (SDNN).
Table available in the original PDF paper.
Variable Pearson r Pearson p Spearman rho Spearman p PSS-4_1 –.081 .764 –.092 .734 PSS-4_2 .224 .404 .262 .326
Table 3: Additional nominally significant item-level associations with HRV-SDNN.
Table available in the original PDF paper.
Variable Pearson r Pearson p Spearman rho Spearman p WHO_1 .653 .006** .691 .003** BRS_5 .536 .032* .503 .047*
Table 4: Day shift inference result reported in the study.
Table available in the original PDF paper.
Association Pearson r p-value Interpretation Δ HRV vs. Δ SRSS mental-strain score (day shifts) –.428 .038* Decreasing HRV is associated with increasing mental strain
For the day shift data, the analysis showed a significant negative association between changes in HRV and changes in SRSS mental-strain scores (Table 4). Specifically, the reported Pearson correlation was r = –.428 with p = .038*. This indicates that stronger reductions in HRV from shift start to shift end were associated with stronger increases in subjectively reported mental strain. Thus, the physiological marker and the self-report measure converged on a stress-related pattern: reduced autonomic variability across the shift corresponded to higher perceived mental strain.
In the context of the investigation of bouncing-back features, Spearman correlation analysis resulted in a significant positive association between the number of stress peaks per hour that provoked long periods of recovery and the change in SRSS physical-strain scores, rho = .605, p = .013*. Shifts characterized by more frequent prolonged physiological recovery episodes were therefore also characterized by stronger increases in subjectively perceived physical strain. This supports the interpretation of long recovery time after stress peaks as a meaningful digital marker of reduced physiological recovery capacity during work.
Because the sample was small and the analyses were exploratory, this result should be interpreted as hypothesis-generating and should be validated in larger datasets with correction for multiple comparisons.
SUMMARY AND CONCLUSIONS This paper reports a pilot field study on stress and recovery signatures derived from wearable biosignal data in an industrial production environment. Sixteen employees from an advanced electronics manufacturing site
Stress and Recovery Signatures From Wearable Biosignal Data 195 participated in a one-week study with continuous HR/HRV tracking and repeated self-assessment across work, breaks, leisure, and sleep. The data support the feasibility of combining wearable HRV-SDNN with short self- report instruments, including PSS-4, BRS, WHO-5, PANAS-N, and SRSS- inspired recovery-stress items.
The strongest questionnaire-biosignal result was the negative association between PSS-4 total score and HRV-SDNN: higher perceived stress was associated with lower HRV in both Pearson and Spearman analyses. At item level, PSS-4_4 showed the strongest negative relationship with HRV, while PSS-4_3 required reverse-scoring interpretation. WHO_1 and BRS_5 were positively related to HRV, suggesting that well-being and resilience-related coping are linked to higher autonomic variability. The day-shift analysis further showed the expected combined pattern of decreasing HRV and increasing mental strain from start to end of shift.
The innovation perspective is the transition from static stress scoring toward dynamic stress and recovery computing. Rule-based detection of stress events, stress peaks, amplitude, and recovery time provides a practical basis for estimating bouncing-back behaviour from wearable data. In this pilot dataset, long-recovery peaks were positively associated with increasing physical strain, supporting recovery time as a candidate digital resilience marker.
Future work should validate the approach in larger samples, across additional shift types, and with predefined thresholds for stress-event detection. Statistical analyses should include correction for multiple comparisons, mixed-effects models for repeated shift measurements, individual baseline calibration, artefact-control procedures for wearable HRV, and validation against contextual work-task information. These steps are required to distinguish stable trait differences from within-shift stress and recovery dynamics.
In practice, these results support the development of wearable-based stress and recovery monitoring for industrial workplaces, enabling early detection of strain, individual recovery profiling, and data-informed decisions on breaks, task rotation, and resilience-oriented work design.
ACKNOWLEDGMENT
This work was funded in part by the FAIRWork project (grant No. 101069499) under the Horizon Europe research and innovation programme of the European Commission.
REFERENCES
Cohen, S., Kamarck, T., & Mermelstein, R. (1983). A global measure of perceived stress. Journal of Health and Social Behavior, 24(4), 385-396. https://doi. org/10.2307/2136404 Cohen, S., & Williamson, G. M. (1988). Perceived stress in a probability sample of
the United States. In S. Spacapan & S. Oskamp (Eds.), The social psychology of health: Claremont Symposium on Applied Social Psychology, pp. 31–67, Sage. Karhula, K., Härmä, M., Sallinen, M., Hublin, C., Virkkala, J., Kivimäki, M., Vahtera, J., & Puttonen, S. (2013). Association of job strain with working hours, shift-dependent perceived workload, sleepiness and recovery. Ergonomics, 56(11), 1640–1651. https://doi.org/10.1080/00140139.2013.837514
Kellmann, M., Kölling, S., Hitzschke, B., & Ferrauti, A. (2018). Recovery and stress in sport: A manual for testing and assessment. Routledge. https://doi. org/10.4324/9780429423857 Kim, H.-G., Cheon, E. J., Bai, D.-S., Lee, Y. H., & Koo, B.-H. (2018). Stress and
heart rate variability: A meta-analysis and review of the literature. Psychiatry Investigation, 15(3), 235–245. https://doi.org/10.30773/pi.2017.08.17 Lenger, M., Schönthaler, E.M.D, Hantke, A., Dalkner, N., Guggemos, S., Pszeida, M., Mosbacher, J.A., Draxler, S., Lutz, T., Russegger, S., Nateqi, J., Albert, D., Paletta, L., Reininghaus, E.Z. (2025). Impact of an App-Based Resilience Training on Enhancing Stress Regulation and Mental Health, Neuropsychobiology, 84 (3): 121–132. https://doi.org/10.1159/000544149 Paletta, L., Zeiner, H., Schneeberger, M., Pszeida, M., Mosbacher, J.A., Tschuden,
J. (2024). Resilience Scores for Decision Support Using Wearable Biosignal Data with Requirements on Fair and Transparent AI, 2024 IEEE 29th International Conference on Emerging Technologies and Factory Automation (ETFA), Padova, Italy, 2024, pp. 1–4, https://doi.org/10.1109/ETFA61755.2024.10710860. Paletta, L., Schneeberger, M., Pszeida, M., Zeiner, H., & Mosbacher, J. (2025).
Research protocol for the estimation of recovery-stress states of workers at the manufacturing site using wearables. In L. Paletta (Ed.), Cognitive Computing and Internet of Things. AHFE Open Access, 165. AHFE International. https://doi. org/10.54941/ahfe1006093 Shaffer, F., & Ginsberg, J. P. (2017). An overview of heart rate variability metrics and norms. Frontiers in Public Health, 5, 258. https://doi.org/10.3389/ fpubh.2017.00258 Smith, B. W., Dalen, J., Wiggins, K., Tooley, E., Christopher, P., & Bernard,
J. (2008). The Brief Resilience Scale: Assessing the ability to bounce back. International Journal of Behavioral Medicine, 15(3), 194–200. https://doi. org/10.1080/10705500802222972 Task Force of the European Society of Cardiology and the North American Society of Pacing and Electrophysiology. (1996). Heart rate variability: Standards of measurement, physiological interpretation, and clinical use. Circulation, 93(5), 1043-1065. https://doi.org/10.1161/01.CIR.93.5.1043 Thayer, J. F., Ahs, F., Fredrikson, M., Sollers, J. J., III, & Wager, T. D. (2012). A meta-
analysis of heart rate variability and neuroimaging studies: Implications for heart rate variability as a marker of stress and health. Neuroscience & Biobehavioral Reviews, 36(2), 747–756. https://doi.org/10.1016/j.neubiorev.2011.11.009 Thayer, J. F., Hansen, A. L., Saus-Rose, E., & Johnsen, B. H. (2009). Heart rate variability, prefrontal neural function, and cognitive performance: The neurovisceral integration perspective on self-regulation, adaptation, and health. Annals of Behavioral Medicine, 37(2), 141–153. https://doi.org/10.1007/s12160- 009-9101-z Thompson, E. R. (2007). Development and validation of an internationally reliable
short-form of the Positive and Negative Affect Schedule (PANAS). Journal of Cross- Cultural Psychology, 38(2), 227–242. https://doi.org/10.1177/0022022106297301 Topp, C. W., Ostergaard, S. D., Sondergaard, S., & Bech, P. (2015). The WHO-5 Well-Being Index: A systematic review of the literature. Psychotherapy and Psychosomatics, 84(3), 167–176. https://doi.org/10.1159/000376585 Watson, D., Clark, L. A., & Tellegen, A. (1988). Development and validation of brief
measures of positive and negative affect: The PANAS scales. Journal of Personality and Social Psychology, 54(6), 1063–1070. https://doi.org/10.1037/0022- 3514.54.6.1063
LISTED IN THE AHFE DIGITAL BOOKSTORE CATALOGUE
Explore the complete digital volume
Cognitive Computing and Internet of Things
Read this individual research paper free through the original publisher, or explore the full digital proceedings book.
ISBN 978-1-964867-81-6
Explore this ISBN in the AHFE Bookstore ↗Listed in the July 2026 bookstore catalogue; search by ISBN to confirm current availability · Digital book purchase optional