Xiaohui Du, Shaowen Ding, Andi Wei, Xiaoyu Cao (2026). Perceived Light Environment in Closed Space Based on EEG Analysis. In: Cognitive Computing and Internet of Things. AHFE Open Access, vol. 205, pp. 127–137. https://doi.org/10.54941/ahfe1007367
In order to study the impact of enclosed space lighting environment on human psychological perception and work efficiency, an experimental environment was constructed using VR (virtual reality) technology, and subjective perception and EEG signal acquisition experiments were conducted on the lighting environment in the virtual environment. Four working conditions were established by combining different color temperatures (3000 K, 5000 K) and different illuminance levels (300 lx, 1000 lx). The results show that: (1) The comprehensive evaluation score of low color temperature scenes in a narrow-confined sleeping space was 90% higher than that of high color temperature scenes. (2) Illumination and color temperature in a narrow-confined sleeping space had a certain impact on EEG, and showed a significant negative correlation with relaxation coefficient.
In industrial safety protection regulations, a confined space specifically refers to a sealed and enclosed on-site environment, such as mines, cabins, and computer rooms. Due to space limitations at site entrances and exits, it is difficult to enter and exit. Sealed spaces at sea are commonly found in ship cabins, where staff live and reside. In space, a space station is a sealed space where space rockets are launched from the ground to form the Tianhe core module, Mengtian module, and Wentian experimental module in an orbit about 400 kilometers above the Earth’s surface. Astronauts need to conduct space research activities in a sealed space for up to a year. Continuously improving the comfort level of enclosed indoor environments is an important way to improve the physical and mental health of workers, keep their bodies in good condition, and make full use of various factors in the space environment to enhance work ability and operational performance.
At present, the development and widespread application of automation, informatization, and intelligent technologies in confined spaces have made environmental control and demand increasingly complex, and the interaction perception between people and the environment has also become more complex. In response to the increase in work task duration, how to optimize the lighting environment in confined spaces has become a focus of attention. Rui and Yang (2021) found that illumination is positively correlated with Received March 6, 2026; Revised April 7, 2026; Accepted April 25, 2026; Available online July 20, 2026
clarity, while color temperature is negatively correlated with warmth. Zhang et al. (2022) found that different forms of lighting environments in classrooms have a greater impact on people’s environmental perception, eye movement, and physiological data. In artificial lighting environments, people have a stronger sense of brightness but a lower sense of relaxation. However, at an intermediate color temperature of 4500 K, people feel the most spacious. The above research scenarios mainly focus on educational buildings, office buildings, and exhibition buildings. Regarding the health issues of personnel in special workplaces, the enclosed space lighting environment has gradually attracted attention to the physiological and psychological performance of users. Revell et al. (2010) found that human physiological and psychological performance is best when the light environment is set at 5500 K in a confined workspace. An et al. (2019) demonstrated that in a closed environment for long-term operations, the intensity and perception of light can reduce the environmental suitability of special workers. Liu et al. (2023) simulated and compared the effects of six lighting conditions on visual resolution, distance perception, and subjective perception reaction time in the light environment of a space station. This study involves manned spacecraft space, but did not investigate work efficiency. Yu et al. (2019) analyzed the subjective fatigue recovery effect of LED lighting in a closed cabin under different color temperature environments using the Karolinska Sleepiness Scale, in order to optimize the work efficiency of operators. The study used an indirect measurement method for work efficiency. The lighting environment can have a certain impact on people’s psychological perception, and inappropriate lighting schemes can make people uncomfortable, thereby affecting the psychological state of special operators in enclosed spaces and affecting their work.
At present, some research teams have conducted light environment simulation experiments using VR. For example, Wu Hao’s research has proven the feasibility of VR technology in simulating light environments (Wu et al., 2023), while Chamilothori et al.’s research has shown that the closer the environmental representation of virtual environments is to the simulated real environment, the closer the user’s reaction is to the real environment (Chamilothori et al., 2019). Therefore, this paper conducts a simulation experiment of microgravity conditions in a closed space light environment based on VR devices to study the changes in human subjective perception and EEG signals under four lighting scenarios, forming a subjective and objective test correlation, and providing data reference for optimizing the light environment of space stations.
RESEARCH METHODS Experimental Plan
Firstly, the construction of virtual scenes. The experimental scene consists of four lighting scenarios. In order to facilitate scene switching during the experiment, VR virtual reality technology was used to simulate a narrow and enclosed sleeping space. Use the Sket up2019 software to model and adjust
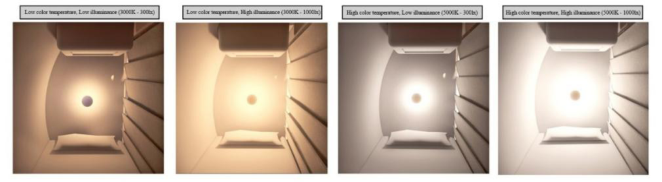
Perceived Light Environment in Closed Space Based on EEG Analysis 129 the illuminance, color temperature and other parameters of the lamps. The illuminance parameters are set using the light module in the software. The accurate illuminance values are set by adjusting the luminous flux. The color temperature parameters are adjusted in the rendering interface to ensure the accuracy of the color temperature illuminance values. And the contrast correction is made by wearing VR virtual glasses and the lighting parameters of the real scene. Color matching and mapping in the material library. After completing the design of its lighting, color, and material, use the enscpe plugin to render the 3D model and connect it to the HTC VIVE pro 2.0 external head mounted device. This research method can effectively achieve the transformation of different experimental scenarios in narrow and enclosed spaces, with strong realism, which is helpful for experimental development. The setting of lighting parameters refers to the Chinese architectural lighting design standards (Ministry of Housing and Urban-Rural Development, 2024). The illuminance is represented by low illuminance of 300lx and high illuminance of 1000lx, and the color temperature is represented by low color temperature of 3000k and high color temperature of 5000k. Four lighting scene experiments were conducted with color temperature * illuminance (Figure 1).
Secondly, a head down bed rest experiment was conducted to create a microgravity perception state.
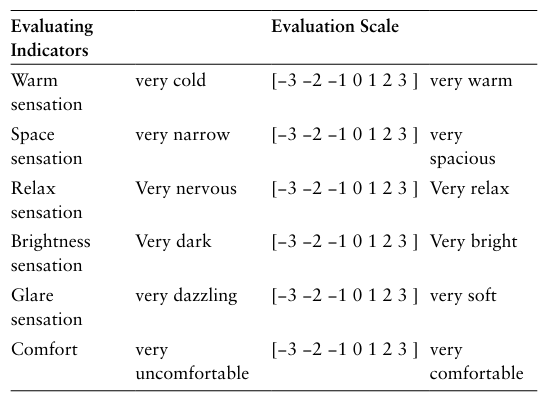
Thirdly, subjective evaluation questionnaire design. The questionnaire structure adopts the Method of Semantic Differential, proposed by American psychologist Osgood. It measures psychological feelings through a semantic difference scale, consisting of a pair of antonyms, used to quantify people’s perception and attitude differences (Azizpour et al., 2012). The questionnaire was set up on a 7-point Likert scale (e.g. very uncomfortable, somewhat uncomfortable, uncomfortable, average, comfortable, somewhat comfortable, very comfortable), evaluating participants’ perceptions of warmth, spaciousness, relaxation, brightness, softness, and comfort in lighting environments.
Fourth, connect the EEG signal acquisition device. Electroencephalography (EEG) is a weak rhythmic electrical signal generated by the synchronous discharge of a large number of neurons in the brain when billions of neurons communicate with chemicals through electrical pulses, which can be detected by scalp electrodes. It is the “language” or “electrical activity” of brain nerve cell activity, and its recording requires the use of electroencephalography equipment. This experiment used Mitsar-EEG-202 to collect EEG signals with a sampling rate of 128Hz. The 32 channels of the device were distributed according to the international 10-20 system.
Figure 1: Four lighting scenarios in experiment.Table 1: Subjective evaluation questionnaire in Experiment.
Experimental Procedure This experiment recruited 30 participants, including 19 males and 11 females, aged between 18–60 years old. They were in good health, had good sleep patterns, and had normal vision or corrected vision. For the convenience of the experiment, the subjects are architecture students who have been using the professional classroom space for a long time. The subjects had no vigorous exercise, smoking, drinking, or other behaviors on the day before the experiment, and had sufficient sleep. Experimental monitoring of indoor temperature, humidity, and noise, with an average temperature of 23°C; The average relative humidity is 18%, and the simulated background noise is 56dB. The experiment consists of six steps. (1) Experimental preparation: Participants enter the laboratory, wear VR devices and physiological signal acquisition devices, close their eyes and rest to maintain a stable metabolic rate of around 1.0met and adapt to the experimental environment. (2) From the 15th to the 18th minute, this stage is the physiological baseline testing phase, during which the main trial collects various physiological baseline data. (3) The 18th to 20th minutes are the stage of lighting scene perception. The subjects enter a randomly presented lighting scene for perceptual experience, and their physiological indicators, including EEG signals, will be recorded. (4) From the 20th to the 22nd minute, during the task phase, participants complete the questionnaire under the guidance of the main examiner. (5) From the 22nd to the 25th minute, during the rest phase, after the first lighting scene experiment is completed, the subjects take a 3-minute break. (6) The subjects enter the next virtual lighting space scene and continue the testing of steps (2) - (5) until the experiment of four lighting scenes is completed. After completion, exit the experiment and have another participant continue with the experimental procedure.
DATA ANALYSIS METHOD EEG signals are non-stationary random signals with infinite duration and total energy, but they are considered stationary in a short period of time. Therefore, a window function needs to be added before signal processing. This study uses power spectral density to analyze the frequency domain characteristics of motor imagery EEG signals, and uses the non parametric Pwelch function to calculate power spectral density (PSD). PSD can be used to analyze the spectral characteristics of signals, thereby helping us understand the energy distribution of signals. PWelch is an improved periodogram method with better variance performance than the original periodogram method (Zhao et al., 2023). The calculation steps for PSD eigenvectors are as follows: (1) Divide the N-length signal into overlapping segments, with each segment having a length M = N/L, and apply a specified window to each segment of the EEG signal xp (n). So the periodogram Jp (w) of a signal is:
Equations and mathematical formulas are available in the original paper PDF.
2 M 1
n U w n M
w (n) is the window function, and this study uses the Hamming window. (2) The Fourier transform is applied to calculate the periodogram of each window segment in windowed data, which is called the modified periodogram.
(3) The PSD estimate of the signal is obtained by averaging the modified periodogram to obtain a spectral estimate
L
x p i B w J w L
However, the execution of motor imagery tasks is affected by the current state of the subjects, and they cannot maintain consistent amplitudes. Therefore, the estimated PsD needs to be normalized.
w x x w
B w B w W B w B w B w (3)
max min
( ) In formula (3):W is the number of ; ( ) − x B w is a standardized PSD feature. The study in reference (Lu et al., 2020) shows that EEG signals can effectively reflect the physiological signal of the impact of illumination on light comfort. The total power consumption of brain activity is negatively correlated with light comfort. In order to objectively grade mental activities, 32 electrode positions including FPZ, FP1, F1, F2, OZ were selected to evaluate the degree of mental relaxation of the subjects. The relaxation coefficient F is used to reflect the relaxation state of the subjects in different lighting scenarios. Observe the F-value of each electrode position in the whole brain [37-40]. Calculation formula (4):
α θ β
F : relaxation coefficient, P α: PSD power values of α wave P β: PSD power values of β wave P θ: PSD power values of θ wave
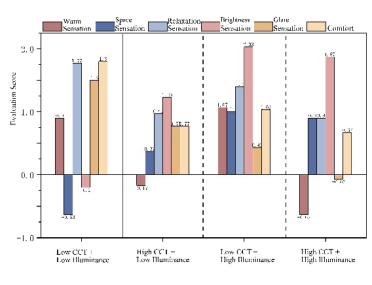
Figure 2 shows the subjective perception mean comparison under different lighting scenarios. It can be seen that in terms of brightness and spatial perception, the low color temperature and high illumination scenes (3000K-1000Lx) have the highest evaluation scores, with scores of 2.03 and 1.0 respectively. Participants feel that the brightness is the brightest and the space is the most spacious. In terms of relaxation, softness, and comfort, the low color temperature and low light scenes (3000K–300Lx) have the highest evaluation scores, with scores of 1.77, 1.5, and 1.8, respectively. Participants feel the most relaxed, the light feels the softest, and the lighting environment feels the most comfortable. However, the evaluation scores for spatial and brightness sensations in this scene are the lowest, with scores of −0.65 and −0.2, respectively. Overall, the comprehensive evaluation score of low color temperature scenes in confined sleeping spaces is higher than that of high color temperature scenes.
Figure 2: Comparison of subjective perception evaluation under different lighting scenarios.
EEG Analysis (1) Average power spectral density distribution
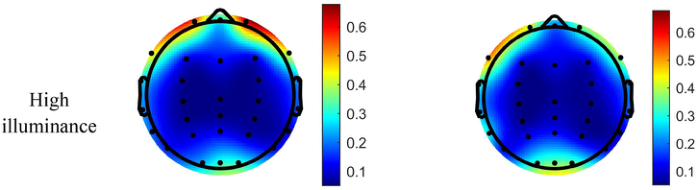
In order to accurately compare the effects of different lighting scenarios on subjects’ comfort, the average power spectral density of each channel in the most active cortical region during the lighting experiment was calculated. Figure 3 shows the brain topography of the average power spectral density distribution. It can be observed that under low light conditions, brain activity is mainly concentrated in the occipital lobe, with the red area being larger than under high light conditions, indicating that the visual system of the
Perceived Light Environment in Closed Space Based on EEG Analysis 133 brain is more sensitive when there is insufficient light. The frontal lobe area is most active at low color temperature and high light intensity, with the red area being the largest, indicating that the cognitive processing load of the brain may be increasing.
Figure 3: Brain topographic map of average power spectral density distribution of each channel.
(2) EEG Characteristic Changes
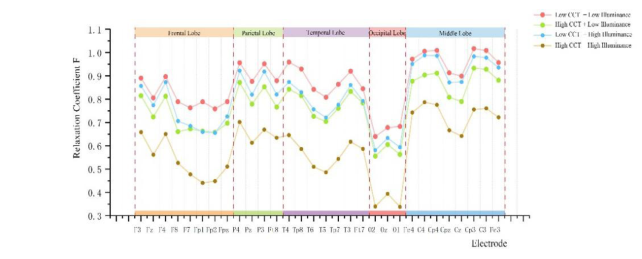
Figure 4 shows the trend of fatigue index F values for four lighting environment scenarios at different electrode positions. It can be seen that the F values for each electrode position in the high color temperature and high illumination scenarios (5000K–1000LX) are lower than the other three lighting scenarios. This indicates that the high color temperature and high illumination environment makes the brain’s physiological state more alert, which is not conducive to the subjects’ full relaxation and rest. In contrast, the low color temperature and low light environment (3000K–300LX) makes people feel relaxed and easy to fall asleep, making it the most suitable lighting scene for sleep among the four lighting environments. The occipital lobe of the brain is mainly responsible for processing visual information. From the distribution of electrode positions in the cerebral lobe region, the relaxation index F of the occipital lobe region (O1/O2/O3) is at its lowest value in all four scenarios. The F-value of electrode position O1 in the occipital lobe area is the lowest in high color temperature and high illumination scenes, at 0.338. It indicates that the neural activity of the subjects is enhanced in this scene. When combined with Figure 2, the high brightness of this scene leads to greater visual stimulation and more active visual activity in the human body.
Figure 4: Relaxation coefficient F value trend variation of whole brain electrode positions under different lighting scenarios.
Correlation Analysis of Subjective and Objective Indicators
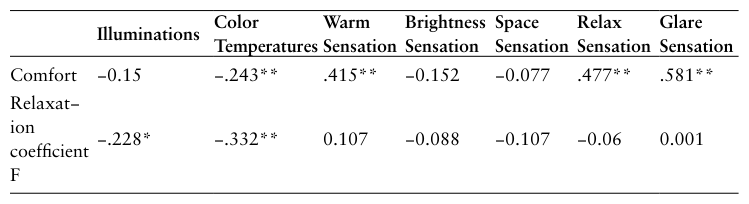
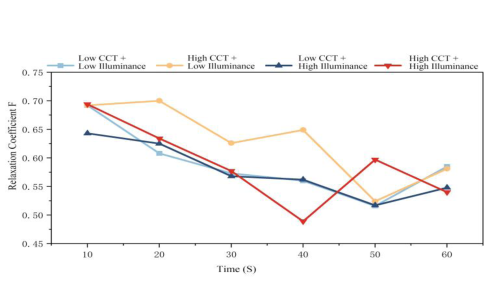
Table 2 shows the correlation analysis between subjective and objective indicators. It can be seen that firstly, in a narrow and enclosed sleeping space, the correlation between soft lighting and comfort is the highest, with a correlation coefficient of 0.581. Softness is the most important factor affecting comfort. Secondly, the subjective perception of the subjects’ psychology has no effect on the EEG signals, but the lighting environment has a certain impact on the EEG signals. The relaxation coefficient F is significantly correlated with illuminance and color temperature, with correlation coefficients of −0.228 and −0.332, respectively. This indicates that in statistical significance, the higher the illumination, the higher the color temperature, the smaller the relaxation coefficient F, and the more alert the brain state of the subjects. Figure 5 shows the trend of relaxation coefficient F over time under different lighting scenarios. It can be seen that with the increase of time, although the relaxation coefficient F of the four lighting scenes fluctuates slightly, the overall value shows a decreasing state. This indicates that as time goes on, people gradually adapt to the environment, but the visual cognitive load gradually increases.
Table 2: Correlation analysis of subjective and objective indicators.Figure 5: Trend of relaxation coefficient F over time.
Comfort Evaluation Taking comfort as the dependent variable y and warmth, space, relaxation, brightness, softness, color temperature, and relaxation coefficient F as independent variables x, the model results show that the multivariate correlation coefficient R is 0.705 and the determination coefficient R² is 0.497, indicating that the model can explain 49.7% of the total variation in comfort. The adjusted R² is 0.474, further considering the influence of the number of independent variables and sample size on explanatory power, indicating that the model has a medium to high explanatory power. The standard error of regression estimation is 0.620. The analysis of variance (ANOVA) showed that the regression model as a whole reached a significant level (F (5,113) = 22.303, p < 0.001), as shown in Table 3.
y x x x
0.187 0.015 +0.534 +0.308 comfort warm sensation relaxation sensation glare sensation − x x 0.313 +0.088 illuminance
F
Table 3: Results of multiple linear regression analysis of factors influencing comfort (N = 119).
Table available in the original PDF paper.
Beta (β) t p
Predictor Variable B Standard Error (Constant) 0.187 0.153 1.222 0.224 warm sensation −0.015 0.089 −0.015 −0.171 0.014
color temperature −0.095 0.071 −0.111 −1.335 0.185
0.088 0.071 0.090 1.242 0.017
Relaxation coefficient F
CONCLUSION
People’s bodies are restricted in confined sleeping spaces, but their visual perception is more acute. The main conclusions are as follows: (1) The comprehensive evaluation score of low color temperature scenes in
confined sleeping spaces is higher than that of high color temperature scenes. Among them, the comprehensive evaluation score of low color temperature and high illumination lighting scenes is the highest at 1.16 points, and the comprehensive evaluation score of high color temperature and high illumination lighting scenes is the lowest at 0.61 points. (2) In a confined sleeping space, as time goes by, people gradually adapt to the environment, but the visual cognitive load gradually increases. (3) The illumination and color temperature in a confined sleeping space
have a certain impact on EEG signals, and show a significant negative correlation with the relaxation coefficient, with correlation coefficients of -0.228 and -0.332, respectively.
ACKNOWLEDGMENT
This research is supported by Foundation of National Key Laboratory of Human Factors Engineering (). Grant no: HFNKL 2023WN01.
REFERENCES
An, G. H., Fan, L. J., Li, C., et al. (2019). Characteristics of environmental adaptability of military personnel during long-term performance in an enclosed environment. Journal of Military Medicine, 44(12), 881–888. (In Chinese) Azizpour, F., Moghimi, S., Lim, C. H., et al. (2012). A thermal comfort investigation
of a facility department of a hospital in hot-humid climate: Correlation between objective and subjective measurements. Indoor and Built Environment, 22, 836– 845. Chamilothori, K., Wienold, J., & Andersen, M. (2019). Adequacy of immersive virtual reality for the perception of daylit spaces: Comparison of real and virtual environments. Leukos, 15(1–4), 203–226. Dang, R., & Yang, D. (2021). The influence of illuminance and correlated color
temperature on visual perception in museum lighting. Journal of Illumination Engineering, 32(3), 112–115, 123.(In Chinese) Liu, B., Li, T. Y., & Su, H. (2023). Research on the light environment and human factors lighting of space stations for human adaptation. Manned Spaceflight, 29(3), 309–316. Lu, M., Hu, S., Mao, Z., Liang, P., Song, X., & Guan, H. (2020). Research on work
efficiency and light comfort based on EEG evaluation method. Building and Environment, 183, 107122. Ministry of Housing and Urban-Rural Development. (2024). Design standards for building lighting (GB/T 50034-2024). China Architecture Publishing & Media Co., Ltd. Revell, V. L., Barrett, D. C. G., Schlangen, L. J. M., et al. (2010). Predicting human
nocturnal nonvisual responses to monochromatic and polychromatic light with a melanopsin photosensitivity function. Chronobiology International, 27(9/10), 1762–1777.
Perceived Light Environment in Closed Space Based on EEG Analysis 137 Yu, M. J., Yuan, Q. J. Z., Zhao, D., et al. (2019). Investigation of the impact of light
environments on visual fatigue and recovery during VDT operations in enclosed cabins. Journal of Safety and Environment, 24(12), 4754–4760. (In Chinese) Wu, H., Du, X. H., & Yu, Y. (2023). Exploration of indoor light environment perception in unit style office space based on VR experiment. Architecture and Culture, (10), 34–37. Zhang, Y. C., Du, X. H., & Zhao, S. J. (2022). Research on interaction effect of
thermal, light and acoustic environment on human comfort in waiting hall of high-speed railway station. Building and Environment, 207, 108494. Zhao, D. C., Shen, L. H., Yu, J. J., et al. (2023). Classification of electroencephalogram signals based on common space pattern and power spectrum density. Science Technology and Engineering, 23(10), 4272–4278.
LISTED IN THE AHFE DIGITAL BOOKSTORE CATALOGUE
Explore the complete digital volume
Cognitive Computing and Internet of Things
Read this individual research paper free through the original publisher, or explore the full digital proceedings book.
ISBN 978-1-964867-81-6
Explore this ISBN in the AHFE Bookstore ↗Listed in the July 2026 bookstore catalogue; search by ISBN to confirm current availability · Digital book purchase optional