Yuhong Chen, Lilu Tang, Dan Zhang (2023). Emotional Effects of Color in Noisy Environment: A Virtual Reality Study on Subway Platforms. In: Human Factors in Architecture, Sustainable Urban Planning and Infrastructure. AHFE Open Access, vol. 89, pp. 49–57. https://doi.org/10.54941/ahfe1003679
Color design is a potential way to improve the human experience of subway platform. This study investigated the effect of color on emotion and environmental preference in subway platforms. In particular, taking possible audio-visual interaction into account, this study investigated the differences in color-emotion effect under different noise levels. Virtual reality was used to simulate the subway platform environment, and 11 colors × 2 noise levels were examined. Participants’ emotions and preferences were measured by self-reports and EEG signals. The results indicated that the hue and color type of the subway platform have a significant influence on emotion and preference, and preference can be predicted by two emotion dimensions: pleasure and arousal. This study also found that environmental preference differed in different noise levels, and there was an interaction between hue and noise. These findings provided a basis for the color design of subway platforms to elicit more positive emotions.
Subway platforms, as important urban public spaces, are not always con- sidered as pleasant places. Specifically, stiff colors, inappropriate lighting, and ubiquitous noise can all contribute to a tedious, depressing, or anxiety subway platform experience. With the increasing number of subway stati- ons and the growing demand for high-quality urban spaces, how to improve the human experience in subway stations through design has become an important issue.
Among all the design factors, environmental color has been proven to have a significant impact on human emotion and environmental preferences (Kül- ler, Mikellides et al., 2009, Kwallek, Lewis et al., 1996). Therefore, color design is a potential way to improve the spatial experience of subway plat- forms. Color can be described by several parameters based on different color models. For example, the HSL model which is widely used in the field of architecture design, determines a color through three parameters: hue(H), saturation(S), and lightness(L) (Ibraheem, Hasan et al., 2012). Past studies have concluded that hue, saturation, and lightness all have an effect on
emotion. There has been proven a related physiological basis for the color- emotion effect. For example, the effects of colors differ in the level of central and autonomic nervous system arousal (Mikellides, 1990). Furthermore, the effect also stems from people’s cognitive impressions and mental associations (Kaya and Epps, 2004). Previous studies have tended to focus on a particu- lar color parameter. However, considering an in-depth application, it is also necessary to investigate the interaction of individual color parameters.
Although many studies have investigated the effects of different colors on emotion, few studies have examined the possible audio-visual interaction, i.e., whether the emotional effects of colors differ in noisy environments. Research has found that noise can cause negative emotions such as tension and anxiety, which affect human health (Reddy, Chakrabarti et al., 2012). And it has been shown that visual and auditory interactions exist (Bulkin and Groh, 2006). In the real world, an environment cannot be without sound. Therefore, the noise level needs to be taken into account for higher ecological validity.
Previous studies on architectural color usually use pictures to simulate an environment. However, virtual reality (VR) can provide a more immersive experience close to the real world (Scorpio, Laffi et al., 2020, Yildirim, Hida- yetoglu et al., 2019). Therefore, this study takes advantage of VR to make the result more valid.
In summary, this study has three main objectives: First, this study aims to explore the effects of multiple color parameters on emotion on subway platforms. Second, taking possible audio-visual interaction into account, this study aims to investigate the differences in color-emotion effects at diffe- rent noise levels. Third, this study aims to investigate the environmental preference in different color and noise environments and to explore the rela- tionship between environmental preference and emotion. Through the study of these issues, this study provided a reference for the color design of subway platforms to elicit more positive emotions.
METHODS
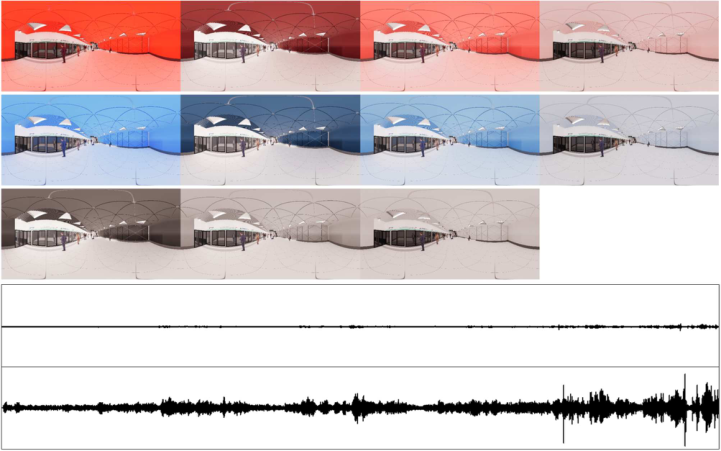
Experimental Materials The experimental materials were 22 VR environments with different colors and noise levels (Figure 1). The environment simulated a typical subway plat- form space in China. The model was an open copyright resource from 3D warehouse website (https://3dwarehouse.sketchup.com/model/1f22fc3c7eac ac2d967f16be0e0e0aab/subwayline8) and was modified according to the experiment design. 360
panoramic images of the environment were rendered using Enscape.
Red (H = 0
) and blue (H = 210
), the most representative warm and cool hues, were chosen for this experiment. Four color types were defined: Saturated (S = 80, L = 50), Dark (S = 40, L = 20), Middle (S = 40, L = 50), and Light (S = 40, L = 80). Eight chromatic colors were obtained according to the hue × color type, and three grey colors in high, medium, and low brightness were set as a comparison. Only the wall and ceiling were set as the color used for the experiment, as the other part of the scene remained the same.
Emotional Effects of Color in Noisy Environment: A Virtual Reality Study 51
Figure 1: Experiment materials.
There were two noise levels. The high noise level condition played the audio recorded at the peak of the subway station (about 80dB). The low noise level condition played the audio obtained by reducing the high noise audio by 20dB (about 60dB).
The eleven colors were matched with high and low noise to obtain 22 experimental materials. An additional material (white, low noise level) was set used as practice material before the experiment.
Emotion and Environmental Preference Measures Both self-reports and EEG were used to measure emotions. For self-report, the Chinese simplified version of the PAD three-dimensional emotion scale was used (Li, Zhou et al., 2005). The PAD model divides emotions into three dimensions: pleasure(P), arousal(A),and dominance(D) (Mehrabian and Rus- sell, 1974). The simplified Chinese version of the PAD scale measures each dimension by four items, and its reliability has been tested (Li, Zhou et al., 2005). The power spectral density(PSD) of electroencephalography (EEG) was used as another indicator of participants’ emotion. Several studies have used EEG to assess human emotional responses to environmental stimuli (Kim, Han et al., 2020, Wang, Jiang et al., 2020).
Environmental preference examined how much participants liked the envi- ronment and was measured by a 9-point Likert scale ranging from “disliked” to “liked”.
Participants The experiment was conducted in two sessions. In the first session, self-report data were collected from 35 participants (17 males and 18 females). In the
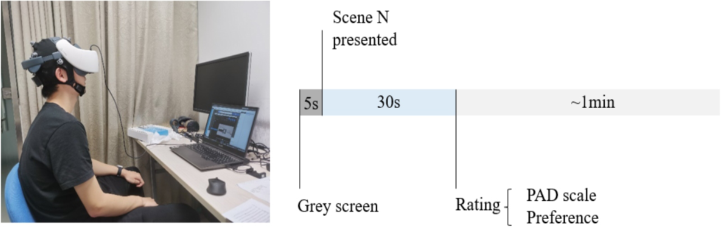
Figure 2: Photo and diagram of the experimental procedure.
second session, self-report and EEG data were collected from 18 participants (10 males and 8 females). All participants were Chinese students of Tsinghua University, aged 18–28 years old, with normal or corrected-to-normal vision, no color weakness, and normal hearing.
Experimental Procedure Experiments were conducted one participant at a time (Figure 2). In the first session, participants entered the lab and put on the VR headset (HTC Vive focus). In the second session, participants put on an EEG cap (Neuracle NeuSen W Wireless 8-channel EEG Acquisition System) first and then put on the VR headset. Before the experiment, the practice material was presen- ted to help participants get used to the VR environment and make sure they fully understood the experimental procedure.
Before each scene was presented, there was a 5s rest time, during which the screen was grey, and there was no noise. And then, each scene was presen- ted for 30s, during which participants experienced the environment. After that, participants verbally reported their PAD scale ratings and preference ratings. And the same test procedure for another scene repeated, until all 22 scenes had been tested. The sequence of the scenes was randomized for each participant to avoid possible effect of sequence.
RESULTS
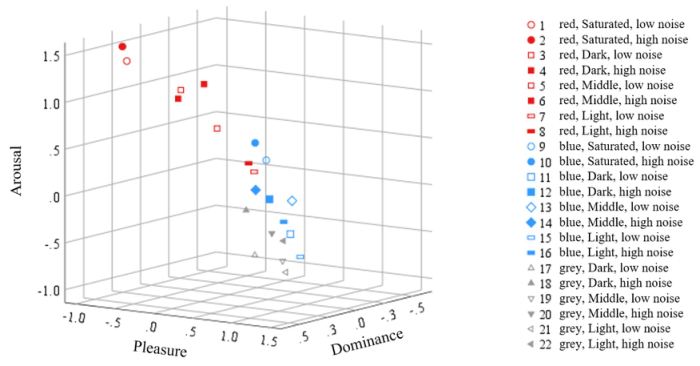
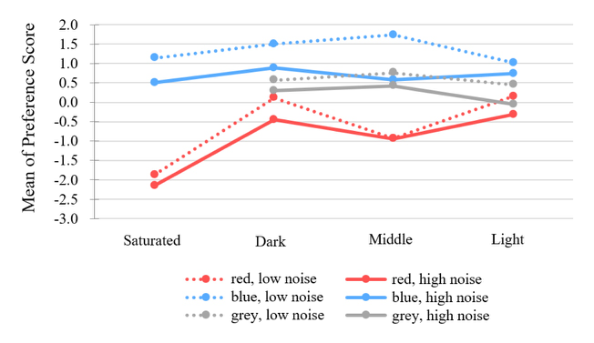
The self-reported data were analyzed using SPSS. Data from 53 samples from the two sessions were pooled. The means of P, A, and D of each scene was displayed in a three-dimensional scatter plot in Figure 3. The means of preference were plotted in Figure 4.
In order to investigate the effect of hue, color type, noise, and their intera- ctions, three-way repeated measures ANOVA for P, A, D, and preference was performed. The ANOVA results were shown in Table 1 and 2.
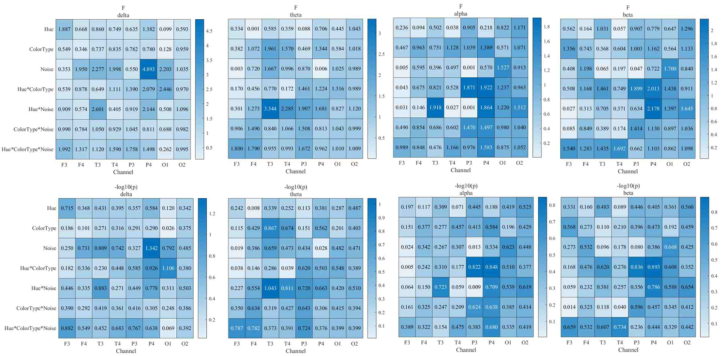
The EEG data were analyzed using Matlab and Fieldtrip toolbox. Fourteen valid samples were pre-processed, and then the power spectral densities of δ, θ, α, and β bands of each channel were calculated for each experimental condition. Finally, three-way repeated measures ANOVA on 8 channel × 4 bands were performed (Figure 5).
Emotional Effects of Color in Noisy Environment: A Virtual Reality Study 53
Figure 3: Three-dimensional scatter plot of the mean of P, A, and D of each scene.Figure 4: Line chart of the mean of preference of each scene.Table 1. The ANOVA results of self-reported emotion.
Hue 99.807*** 0.000 0.657 Color Type 12.145** 0.001 0.189 Noise 17.449*** 0.000 0.251 Hue × Color Type 35.963*** 0.000 0.247 Hue × Noise 5.027* 0.029 0.088 Color Type × Noise 0.414 0.743 0.008 Hue × Color Type × Noise 3.816* 0.016 0.068
* p<0.05,** p<0.01,*** p<0.001
Figure 5: Heat map of the F, −log10(p) values of ANOVA.
The Effect of Color on Emotion and Environmental Preference In terms of pleasure, the pleasure of red was significantly lower than blue (F(1, 52)=40.776, p<0.001, η2=0.440). The main effect of color type on pleasure was significant (F(3, 156)=5.961, p = 0.001, η2=0.103), indica- ting that the four color types differed in pleasure. The hue × color type interaction had a significant effect on pleasure (F(3, 156)=20.915, p<0.001, η2=0.287). Namely, for red versus blue, the color types differed in pleasure. In terms of arousal, red had a significantly higher arousal level than blue (F(1, 52)=55.108, p<0.001, η2=0.515). The main effect of color type was significant (F(3, 156)=38.053, p<0.001, η2=0.423), with Saturated having the greatest arousal, followed by Middle, Dark, and Light. Hue and color type interaction was not significant. In terms of dominance, the main effect of hue was not significant. The main effect of color type was significant (F(3, 156)=7.375, p<0.001, η2=0.124), and the dominance of Light type was the lowest. No significant difference was found in the PSD of the EEG data.
In terms of preference, the ANOVA results showed that blue was signifi- cantly preferred over red (F(1, 52)=99.807, p<0.001, η2=0.657). The main
Emotional Effects of Color in Noisy Environment: A Virtual Reality Study 55 effect of color type was significant (F(3, 156)=12.145, p = 0.001, η2=0.189), with Saturated having the lowest preference score. The hue × color type inte- raction was significant (F(3, 156)=35.963, p<0.001, η2=0.247). When the hue was red, the preference for Saturated was significantly lower than Dark, Middle, and Light, while when the hue was blue, Dark and Middle were significantly preferred than Light.
Effect of Noise on Color-Emotion Effect and Environmental Preference In terms of self-reported emotion, ANOVA results showed that pleasure was significantly lower in high noise than in low noise (F(1, 52)=11.740, p = 0.001, η2=0.184). Arousal was significantly higher for high noise than for low noise (F(1, 52)=4.568, p = 0.037, η2=0.081). There was no signifi- cant difference in dominance between high and low noise, and there was no interaction between noise and color. In terms of EEG, only the main effect of noise was significant in the P4 channel in the δ band, and the rest were not significant, and this result is not interpretable.
In terms of environmental preference, ANOVA results showed that the preference score of low noise was significantly higher than high noise (F(1, 52)=17.449, p<0.001, η2=0.251). The hue × noise interaction had a signi- ficant effect on preference (F(1, 52)=5.027, p = 0.029, η2=0.088). In the high noise context, the preference for a blue environment decreased more. However, the preference of blue was still above zero despite the high noise, indicating that blue had a strong moderating effect on the discomfort cau- sed by high noise. The effect of the color type × noise interaction was not significant.
Relationship Between Emotion and Environmental Preference To examine the relationship between PAD scores and preferences, a multi- ple linear regression was conducted. The results showed that P and A could predict preference with a regression equation:
Preference = 1.531P−0.413A−0.156 (p<0.001, adjusted R2=.964). This suggested that participants’ evaluation of the environment can be affe- cted by their perceived emotions. When pleasure was higher, and arousal was lower, the environment was preferred. The contribution of dominance was not significant, and this was probably because dominance induced by the scenes was relatively weak.
In addition, Pearson correlation coefficients were calculated between the power of each band of each channel and the P, A, D, and preference scores. There was only a very low correlation in some of the bands in some channels (|r|<0.2), which didn’t show a clear pattern.
CONCLUSION
This study focused on the color-emotion effect and environmental prefere- nce in a noisy environment, in this case, the subway platform. Using virtual reality, the experiment manipulated color parameters strictly and avoided
possible errors due to a lack of sense of reality. The study also examined color effect in high and low noise conditions and investigated the interactions between noise and color.
This study indicated that the color of the subway platform effect emotions and environmental preferences. In terms of self-reported emotion, red subway platforms were associated with significantly lower pleasure, and significantly higher arousal than blue. The color type Saturated had the highest arousal, followed by Middle, Dark, and Light. No significant difference was found in the emotion represented by EEG.
In terms of environmental preference, red environments were significan- tly less preferred than blue ones. There were also differences in preference between color types. The result also indicated that environmental preference could be predicted by pleasure and arousal.
This study also explored the differences in the emotional effects of color at different noise levels. High noise reduced the pleasure of most colors, but the pleasure of all blue colors were above zero. High noise also reduced prefere- nce, but blue reduced it more compared to red, possibly because participants in high-noise situations were more inclined to choose anxiety-relieving colors.
The findings of this study provide a basis for the color design of subway platforms to elicit more positive emotions. Considering emotion and prefe- rence, the best color for a low-noise environment is blue of the Middle type, and the best color for a high-noise environment is blue of the Light or the Dark type.
DISCUSSION
The results showed that in underground platforms with different noise levels, the most pleasure-eliciting and most preferred color was different. This sugge- sts that environments adjust their color according to different levels of noise. By changing colors based on noise, an environment can interact with people and correspond to their needs.
The results of this study showed that blue environments have a higher score of pleasure and preference than red ones. However, some other studies show different conclusions. A study concluded that blue interior spaces are signifi- cantly less pleasant than red interior spaces (Küller, Mikellides et al., 2009). Another two studies showed that people prefer red urban building facades (Wang, Zhang et al., 2020) and red concert hall interiors (Chen and Cabrera, 2021). This inconsistency can be explained in two aspects. On the one hand, this inconsistency may stem from different anticipation of different archite- cture functions. On the other hand, the inconsistency probably indicates the effect of noise. This implies that we should consider more sensory factors in design rather than just focusing on one single factor.
The participants in this study were all Chinese college students. Future studies can include participants from broader demographic backgrounds. Besides, to achieve a more realistic scene, future research can use VR videos that simulate the movement in three-dimensional space.
Emotional Effects of Color in Noisy Environment: A Virtual Reality Study 57
ACKNOWLEDGMENT
This work was supported by Undergraduate Education Innovation Grants, Tsinghua University.
REFERENCES
Bulkin, D. A. and J. M. Groh (2006). Seeing sounds: visual and auditory interactions in the brain. Current Opinion in Neurobiology 16(4) 415-419. Chen, Y. X. and D. Cabrera (2021). The effect of concert hall color on preference
and auditory perception. Applied Acoustics 171. Ibraheem, N. A., et al. (2012). Understanding color models: a review. ARPN Journal of science and technology 2(3) 265–275. Kaya, N. and H. H. Epps (2004). Relationship between color and emotion: A study
of college students. College student journal 38(3) 396–405. Kim, Y., J. Han and C. Chun (2020). Evaluation of comfort in subway stations via electroencephalography measurements in field experiments. Building and Environment 183. Küller, R., B. Mikellides and J. Janssens (2009). Color, arousal, and performance—A
comparison of three experiments. Color Research & Application: Endorsed by Inter-Society Color Council, The Colour Group (Great Britain), Canadian Soci- ety for Color, Color Science Association of Japan, Dutch Society for the Study of Color, The Swedish Colour Centre Foundation, Colour Society of Australia, Centre Français de la Couleur 34(2) 141–152. Kwallek, N., et al. (1996). Effects of nine monochromatic office interior colors on clerical tasks and worker mood. Color Research and Application 21(6) 448–458. Li, X., et al. (2005). The reliability and validity of the Chinese version of abbrevi-
ated PAD emotion scales. International Conference on Affective Computing and Intelligent Interaction, Springer. Mehrabian, A. and J. A. Russell (1974). The basic emotional impact of environments.
Perceptual and motor skills 38(1) 283–301. Mikellides, B. (1990). Color and physiological arousal. Journal of Architectural and Planning Research 13–20. Reddy, S. M., D. Chakrabarti and S. Karmakar (2012). Emotion and interior space
design: an ergonomic perspective. Work 41(Supplement 1) 1072-1078. Scorpio, M., et al. (2020). Virtual Reality for Smart Urban Lighting Design: Review, Applications and Opportunities. Energies 13(15). Wang, J., L. Zhang and A. Gou (2020). Study on the preference of city color image
selection based on the logistic model: A case study of Shanghai. Color Research & Application 45(3) 542–557. Wang, Y., et al. (2020). Physiological and Psychological Effects of Watching Videos of Different Durations Showing Urban Bamboo Forests with Varied Structures. International Journal of Environmental Research and Public Health 17(10). Yildirim, K., et al. (2019). Effects on Students’ Perceptual Evaluations of The
Wall Colors Used in Design Studios by The Virtual Reality Method. Iconarp International Journal of Architecture and Planning 7(1) 99–120.
LISTED IN THE AHFE DIGITAL BOOKSTORE CATALOGUE
Explore the complete digital volume
Human Factors in Architecture, Sustainable Urban Planning and Infrastructure
Read this individual research paper free through the original publisher, or explore the full digital proceedings book.
ISBN 978-1-958651-65-0
Explore this ISBN in the AHFE Bookstore ↗Listed in the July 2026 bookstore catalogue; search by ISBN to confirm current availability · Digital book purchase optional