Yoshiki Nishita, Masashi Yamada (2023). Impression Changes of a Live Stage by Lighting in Terms of a Virtual Pop Idol Show. In: Kansei Engineering. AHFE Open Access, vol. 101, pp. 73–81. https://doi.org/10.54941/ahfe1002994
In recent years, LEDs have replaced halogen bulbs or incandescent bulbs for lights on stages. The response time of the LEDs is shorter than those of halogen bulbs and incandescent bulbs, therefore it has become easier to control lights temporally and complex lighting patterns are being used for live music shows especially in pop music. Due to the COVID-19 pandemic, internet distribution of concerts has become popular. Especially, virtual idol’s live shows (-e.g., Hatsne Miku’s live shows-) have become very popular in the two years in Japan. In the present study, audio-visual stimuli with different areas of the stage illuminated by lights and the various colors of the illumination were prepared and live pop music shows performed by a virtual idol, Miss Monochrome were synthesized using the software SHOWMAKER. In Experiment 1, the color of the lights was fixed at light blue, and the area of the lights illuminated on the stage was varied for the live music stage performed by the virtual idol. These 30 synthesized videos were used as stimuli in a perceptual experiment. Fifteen participants rated their impressions of the video stimuli using the semantic differential method. The results of factor analysis showed that the impressions were spanned by three factors, power, tension and tightness. It was also shown that the wider the area illuminated, the more powerful and tighter it come to be perceived. In Experiment 2, nine different areas of illumination on the stage were selected from the areas used in Experiment 1, and twelve colors of the lights were selected from the color wheel. Then 97 stimuli were constructed. Fifteen participants were presented the stimuli through a computer monitor and headphones, and requested to rate the impressions of each of them using 24 paired semantic differential scales. The results of the factor analysis showed that the impressions of the stimuli were illustrated by a three-dimensional space spanned by power, tension and lightness. The results also showed that the wider the area illuminated, the more powerful and tighter it come to be perceived. Moreover, a warm color of the lights was perceived as tense and a cool color was perceived as loose. A prime color was perceived as heavy and a mixed color was perceived as light.
In recent years, LEDs have replaced halogen bulbs or incandescent bulbs for lights on stages. The response time of the LEDs is shorter than those of halo- gen bulbs and incandescent bulbs, therefore it has become easier to control lights temporally and complex lighting patterns are being used for live music shows especially in pop music. Due to the COVID-19 pandemic, internet distribution of concerts has become popular. Especially, virtual idol’s live shows (e.g., Hatsune Miku’s live shows) have become very popular in the last two years in Japan. In the present study, audio-visual stimuli with dif- ferent areas of the stage illuminated by lights and the various colors of the lighting were prepared and live pop music shows performed by a virtual idol, Miss Monochrome were synthesized using the software SHOWMAKER[1].
EXPERIMENT 1
Methods
SHOWMAKER is a computer software for synthesizing live pop music shows. In this software, a virtual idol Miss Monochrome sings and dances
several pop songs on a stage. Using this software, different types of stage lights which illuminate different area of the stage and different colors of the lighting are able to use. In Experiment 1, a song was selected from prepared songs. Twenty-nine different areas of the lighting on the stage were synthesi- zed using the combinations of two types of top lights, one type of side light and four types of back lights. The color of the lights was fix at light blue (R, G, B = 30, 255, 255). In addition to these 29 lighting areas, the stage performance without lighting was prepared. In total 30 audio-visual stimuli of live music shows performed by Miss Monochrome were synthesized.
These stimuli were presented to participants and the impressions for the stimuli were rated using SD (semantic differential) method. Each audio-visual stimulus was presented to fifteen participants, then the participants were requested to rate their impressions of the stimulus using 24 seven-step bipolar scales listed in Table 1. In addition to the 24 SD scales, the degrees of prefe- rence, special sense of live performance and presence were also rated using seven-step scales. The fifteen participants were recruited from the Kanazawa Institute of Technology. The video of a stimulus was presented through a display Flex Scan SX246W and the audio was presented through headphones STAX SR407 at the level of LAeq = 66.5 dB. The experiment was conducted in a soundproof dark room.
Results and Discussion
For each SD scale, the rated scores were averaged over the participants. Using the mean scores, factor analysis was performed. The results of the analysis showed a three-factor solution with the cumulative contribution rate of 85%. Table 1 shows the factor loadings for each SD scale. The three factors were labelled potency, tension and tightness, respectively, after the SD scales which showed large loading values.
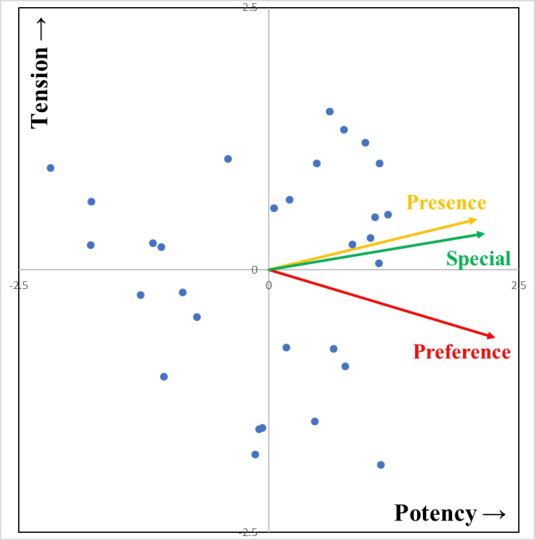
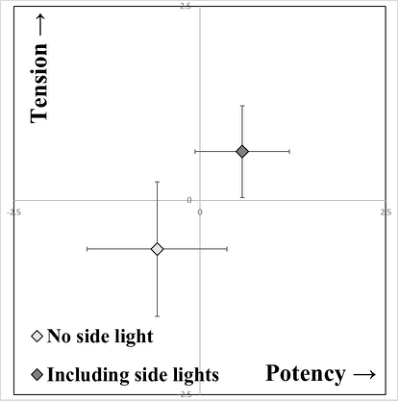
Figure 1 shows the plots of the stimuli on the impression space span- ned by potency, tension and tightness, based on the factor scores. Figure 2 shows the centroids for the stimuli including side lights and the stimuli for no side light is included, on the potency-tense plane. Figure 2 shows that when the side lights are used the performance is perceived as powerful and tense.
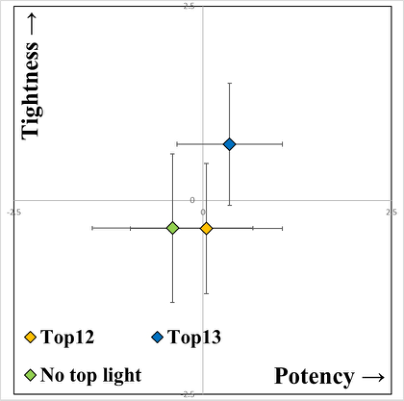
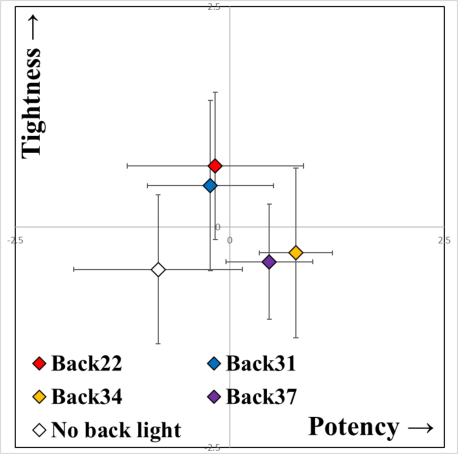
Figure 3 shows the centroids for the different types of top lights and for the case no top light is used, on the potency-tense plane. Figure 3 shows that the stimuli are perceived as tight when the top light 13, which illuminates a narrow area on the stage. Figure 4 shows the centroids for the different types of the back lights on the potency-tightness plane. Back lights 22 and 31 illuminated a part of the back wall, while back lights 34 and 37 illumina- ted entire of the back wall. Figure 4 shows that the stimuli are perceived as tight when a part of the back wall is illuminated, and they are perceived as powerful when entire of the back wall is illuminated.
Multiple-regression analyses were performed, using factor scores of the three factors as explanatory variables and the degrees of preference, special sense of live performance, and presence as criterion variables, respectively. Table 2 shows the results of the analyses. The vectors in Figure 1 show the
Impression Changes of a Live Stage by Lighting in Terms of a Virtual Pop Idol Show 75
Table 1. Factor loadings of the SD scales in Experiment 1.
Table available in the original PDF paper.
Table 2. The results of the multiple-regression analyses.
Table available in the original PDF paper.
Standard partial regression coefficent Coefficent of determination Potency Tension Tightness
directions of the criterion variables on the impression space. Table 2 and Figure 1 shows that the more powerful stage performance is perceived, the more strongly preference, special sense of live performance and presence are felt.
76 Nishita and Yamada
(a) Potency – Tension plane
(b) Potency – Tightness plane
Figure 1: Plots of the stimuli on the impression space in Experiment 1.
Impression Changes of a Live Stage by Lighting in Terms of a Virtual Pop Idol Show 77
Potency – Tension plane
Figure 2: Centroids for the cases where side lights were included and no side light is used.
Potency – Tightness plane
Figure 3: Centroids for different top lights.
EXPERIMENT 2
Methods
In the present experiment, nine settings of the stage lights were selected (Table 3) from the settings used in Experiment 1, and twelve colors of the lights were selected. Combining a setting and a color, 97 stage performances were synthesized. A part of the stage performance was used for the stimuli. The colors were selected from the HLS wheel of pure colors. The wheel was
78 Nishita and Yamada
Potency – Tightness plane
Figure 4: Centroids for different back lights.Table 3. Light settings used in Experiment 2.
Table available in the original PDF paper.
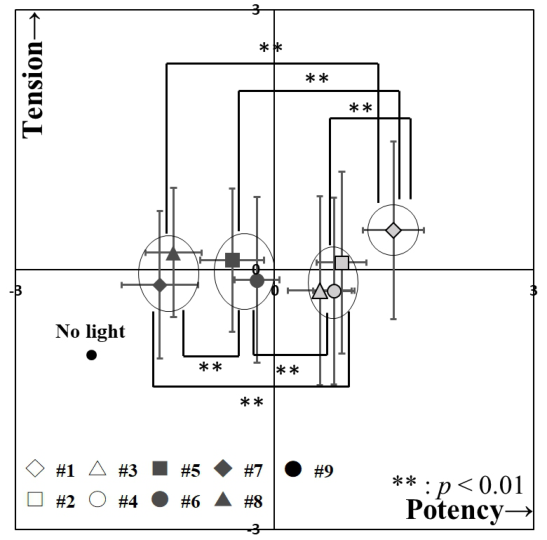
Side Light Top Light Back Light #1 Yes Top12 Back37 #2 Yes Top13 Back31 #3 No Top13 Back34 #4 No Top12 Back34 #5 No Top12 Back22 #6 No No Back37 #7 No Top12 No #8 No Top13 Back22 #9 Without Lighting
equally divided into twelve referring Iwamiya and Hayashi (1999), and the twelve colors were selected as Table 4. The audio stimuli were presented at the level of LAeq = 77.5 dB. The participants and the other experimental procedure were the same as Experiment 1.
Results and Discussion
For each SD scale, the rated scores were averaged over the participants. Using the mean values, factor analysis was performed. The results of the analy- sis showed a three-factor solution with the cumulative contribution of 82%. Table 5 shows the factor loadings for each SD scale. The three factors were labelled potency, tension and lightness, respectively.
Using the light setting and color as factors, two-way analyses of variance and multiple-comparison tests were performed. The results of the analyses of
Impression Changes of a Live Stage by Lighting in Terms of a Virtual Pop Idol Show 79
Table 4. HLS and RGB values of colors used in Experiment 2.
Table 5. Factor loadings of the SD scales in Experiment 2.
Table available in the original PDF paper.
80 Nishita and Yamada
variance are shown in Table 6. The results of the analyses show that the light setting affects potency while the color affects tension and lightness largely.
Figure 5 shows the impressions for different light settings on the potency- tension plane, with the results of the multiple-comparison tests. Figure 6 shows that the wider the area of the stage is illuminated, the more pow- erful the live performance is perceived. This is consistent to the results of Experiment 1.
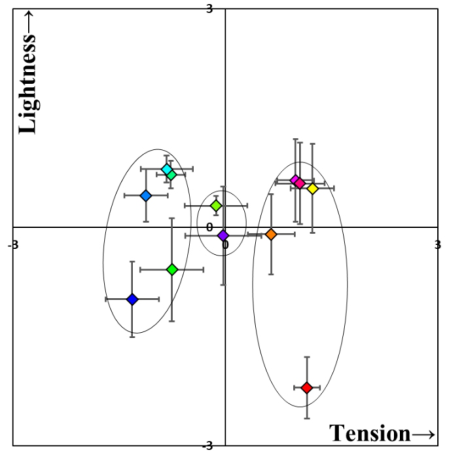
Figure 6 shows the impressions for different colors on the tension-lightness plane. Figure 6 shows that the colors are grouped into three clusters on the tension axis; warm colors, cold colors and intermediate colors. A warm color is perceived as tense and a cold color is perceived as loose. Figure 6 also shows that the colors are grouped into two on the lightness axis; prime colors and
Impression Changes of a Live Stage by Lighting in Terms of a Virtual Pop Idol Show 81
Tension – Lightness plane
Figure 6: Centroids for different colors.
mixed colors. A primary color is perceived as heavy and a mixed color is perceived as light.
CONCLUSION
In the present study, live pop music performances were synthesized with vari- ous light settings and colors and the impressions of the performances were rated. The results showed the performance is perceived as powerful when the lights illuminated a wide area on the stage. It is perceived as tight when a warm color is used and as loose for a cold color. It is perceived as heavy when a prime color is used and light for a mixed color.
REFERENCES
Iwamiya, S., Hayashi, K. (1999) The effects of colors on impression of music, Geijutsu kogaku : The Journal of Design, Kyushu University, Vol. 1, 63–68. Osgood, C. E., Suci, G. J., Tannenbaum, P. H. (1957) The measurement of meaning,
Urbana, IL, University of Illinois Press. SHOWMAKER: https://store.steampowered.com/app/665920/SHOWMAKER/
LISTED IN THE AHFE DIGITAL BOOKSTORE CATALOGUE
Explore the complete digital volume
Kansei Engineering
Read this individual research paper free through the original publisher, or explore the full digital proceedings book.
ISBN 978-1-958651-77-3
Explore this ISBN in the AHFE Bookstore ↗Listed in the July 2026 bookstore catalogue; search by ISBN to confirm current availability · Digital book purchase optional