Masato Chiba, Masashi Yamada (2023). A Perceptual Study on the Ratios of Areas of Two Adjacent Colors for the Optimal Congruency. In: Kansei Engineering. AHFE Open Access, vol. 101, pp. 82–86. https://doi.org/10.54941/ahfe1002995
Cute female characters frequently appear in Cool Japan content, such as anime, video games and manga. When designing a character, color is one of the most important factors. Previous studies showed that yellow characters tended to have a cute connotation like Pokémon. A character with yellow hair also had a cute impression. Particularly, a character with yellow hair and blue irises was perceived as one of the cutest types of character. A pair of yellow and blue consists of complementary colors and generally it is said that a pair of complementary colors gives an uncomfortable impression. It could be hypothesized that the small area of the pair of blue irises functioned as the effect color when combined with the wide area of yellow hair, and these colors were perceived as congruent. A Swiss artist, theorist and educator, Johannes Itten (1888-1967) calculated the ratios of areas of different colors based on a German poet, playwright, novelist and critic, Johann Wolfgang von Goethe (1749-1832). Goethe insisted the ratios of brightness of different colors are “yellow: orange: red: violet: blue: green = 9:8:6:3:4:6”. Then, the ratios of area of different colors for congruency were “yellow: orange: red: violet: blue: green = 3:4:6:9:8:6”, in Itten’s theory. Itten’s theory shows an inverse tendency from the phenomenon of a cute character. According to Itten’s theory, the area of blue must be wider than yellow. However, the theories of Itten and Goethe were based on their intuition. In the present study, a perceptual experiment was conducted to directly measure the ratios of areas of different colors for congruency, to test Itten’s theory. Twelve colors were selected from Itten’s color wheel; yellow, orange, red, violet, blue and green, and 132 pairs of two different colors were prepared. Two adjacent squares were painted in two different colors and 20 participants from the Kanazawa Institute of Technology were requested to adjust the boundary of the two areas to make them most congruent, using the software Illustrator. The results of the experiment showed that the ratios were “yellow: orange: red: violet: blue: green = 5:6:5:6:7:6”. The ratio of 5:7 for yellow and blue colors were smaller than Itten’s theory, but the tendency was consistent with Itten’s theory. To conclude, the phenomenon observed in cute characters in Japanese content could not be illustrated by the ratio of areas of the complementary colors of yellow and blue. The phenomenon may be explained rather by the cultural effects where Japanese people admired Western people with blond hair and blue eyes.
In recent years, Japanese video games, anime and manga are called “Cool Japan content” and are actively exported overseas under the leadership of the Japanese Ministry of Economy, Trade and Industry. In the content, attractive characters, who draw viewers into the world of the work, fre- quently appear. Colors play one of the most important roles to design a character.
Yanagida and Yamada (2016) showed that yellow characters gives a cute impression in the context of Pokémon. Tanaguchi and Yamada (2021) sho- wed that colors of hair and irises determine the impressions of a girl character, largely. They also showed that a character with yellow hair and violet irises was perceived as one of the cutest types of the character. It is well known that a pair of yellow and violet construct complementary colors and generally it is said that a pair of complementary colors gives an unpleasant impression. On the other hand, cuteness includes the meaning of pleasantness. It is a puzzle why an unpleasant combination of colors of yellow and violet constructs a cute character.
It could be hypothesized that the small area the violet irises functi- oned as an accent color when it was combined with the wide area of
yellow hair. The accent color of violet may not be perceived as unple- asant with the main color of yellow, rather it could be congruent with the main color and make the design impressive. The hypothesis descri- bed above could be supported by the theory of existence of the optimal ratio of areas for a pair of complementary colors to be perceived as congruent.
A Swiss artist, theorist and educator, Johannes Itten (1888-1967) insi- sted that the brightness and the area ratio of two colors affect the degree of congruency. Itten calculated the optimum ratios of areas of different colors based on a German poet, playwright, novelist and critic, Johann Wolfgang von Goethe (1749-1832). Goethe estimated the ratios of brightness of dif- ferent colors are “yellow: orange: red: violet: blue: green = 9:8:6:3:4:6.” Table 1 shows the Gathe’s ratios of the brightness for pairs of complemen- tary colors. Itten hypothesized that the optimum area ratio of two colors is reciprocal to the ratio of the brightness and concluded that the opti- mum area ratio of different colors are “yellow: orange: red: violet: blue: green = 3:4:6:9:8:6.” The ratio “yellow: violet = 3:9” suggested that a nar- row area of yellow is congruent with a wide area of violet in the Itten’s theory. Unfortunately, the phenomenon that a girl character with a wide area of yellow hair and a narrow area of violet irises was perceived as cute is inconsistent to the Itten’s theory. In the process where the Itten’s theory was constructed, several intuitive hypotheses and estimation were included. The- refore, a perceptual experiment was directly conducted to determine the area ratios of two different colors for the optimum congruency, in the present study.
METHODS
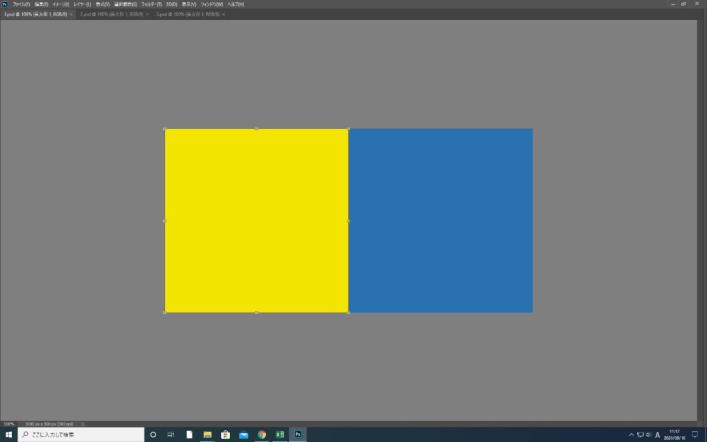
In the experiment, twelve colors were selected from Itten’s color wheel and 132 pairs of two different colors were prepared. Table 2 shows the RGB values of the twelve colors. Two adjacent squares were pre- pared and painted in two different colors, using the software Illustrator (Figure 1).
The experiment was conducted using the adjustment method. The stimuli were presented through a display Flex Scan EV2785W. Twenty participants from the Kanazawa Institute of Technology were requested to adjust the boundary of the two areas to make them most congruent, using the software Photoshop.
Figure 1: An example of the two adjacent colors used in the experiment.
RESULTS AND DISCUSSION
The values obtained in the experiment were averaged over the participants, and the ratios for the optimum congruency were calculated. The results of the experiment showed that the ratios were approximately “yellow: orange: red: violet: blue: green = 5:6:5:6:7:6.”
The ratio of 5:6 for yellow and violet showed a consistent tendency to the Itten’s theory, although the ratio was smaller than Itten showed.
Then, individual data of the measurement were investigated to estimate the reason of the discrepancy of the values of the ratios between the results of the experiment and the Itten’s theory. Table 3 shows the values of mean,
A Perceptual Study on the Ratios of Areas of Two Adjacent Colors 85
Table 3. The statistic values of the displacement of the boundary for each participant.
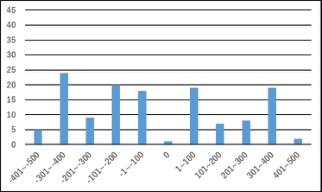
Figure 2: Examples of the distribution of the displacement.
maximum, minimum, variance and standard deviation of the displacement in pixels for each participant. A positive value implies that the boundary was shifted toward right, and a negative value implies toward left. Table 3 shows that the values of the variances and standard deviations are largely different by individuals. Table 3 also shows that the mean values of the displacement are near 0 for all participants. This implies that there is no participant who tend to shift the boundary to right or to left. Figure 2 shows examples of the distributions of the displacement for a participant who shifted the boundary largely and for a participant who shifted in a small area.
These results suggested the possibility that the participants who tended to shift the boundary in a small area made the area ratios smaller. However, there is another possibility that some of the hypotheses and estimation by Goethe or Itten were incorrect. To clarify this, another perceptual experiment using the method of limits or the constant method are needed to conduct.
86 Chiba and Yamada
CONCLUSION
The results of the present study and the Itten’s theory both showed that a narrow area of yellow is congruent with a wide area of violet. This is discre- pant to the phenomenon that a girl character with a wide area of yellow hair and a narrow area of violet irises was perceived as cute. This implies that the congruent ratio of areas of complementary colors could not interpret the cute girl phenomenon. The reason why the girl with yellow hair and violet irises was perceived as cute may rather depending on the culture where a female with blonde hair and blue eyes like French dolls is recognized as beautiful.
REFERENCES
Itten, J. (1987) Kunst der Farbe: subjectives Erleben und objectives Erkennen als Wege zur Knst (Ravensburg : Otto Maier). Tanaguchi, M., Yamada, M. (2021) Relationship between eye and hair colors and
the impressions of characters, Proceedings of the 12thInternational conference on Applied Human Factors and Ergonomics, 8 pages. Yanagida, R., Yamada, M. (2016) A perceptual study of monster design in the context of Cool Japan contents, Proceedings of the 7th International Conference on Applied Human Factors and Ergonomics and Affiliated Conferences, 6 pages.
LISTED IN THE AHFE DIGITAL BOOKSTORE CATALOGUE
Explore the complete digital volume
Kansei Engineering
Read this individual research paper free through the original publisher, or explore the full digital proceedings book.
ISBN 978-1-958651-77-3
Explore this ISBN in the AHFE Bookstore ↗Listed in the July 2026 bookstore catalogue; search by ISBN to confirm current availability · Digital book purchase optional