Lin Sheng, Zhenyu Gu, An Zhang (2023). Color combination of information display interface based on Kansei Engineering and paired comparison experiment. In: Kansei Engineering. AHFE Open Access, vol. 101, pp. 107–118. https://doi.org/10.54941/ahfe1002998
Through the color extraction and perceptual semantic extraction of text disply, this paper puts forward the design elements and guidelines of text information display in public environment. Taking the design of information display in railway station as an example, the relationship model between perceptual semantics and color was established. In this study, the preference selection experiment proposed by Thurstone in psychology was combined with LCJ method and SD method of Kansei Engineering, and the Kansei Engineering evaluation of samples in multiple perceptual dimensions was carried out. The perceptual dimensions were reduced by factor analysis, and the evaluation system architecture of information display was obtained. Then, the paired comparison method was used to evaluate samples in two perceptual dimensions of clarity and pleasure, and the color design elements of public area information display was extracted and summarized. The correlation between perceptual image cognition and sample characteristics was established by regression analysis. Finally, we found that the blue background condition has better performance on the whole, while the text color has great differences in different perceptual cognition, which provides reference for the design of information display interface under different perceptual requirements.
In the era of rapid development of information technology, more and more information interfaces appear in public places, and these information displays play an important role in information prompt or commercial promotion. For example, for railway transportation, in the process of passengers waiting in high-speed railway station, information displays are important for guiding and helping passengers to obtain information rapidly. We have noticed that the design of information display is diversified. In transportation, blue and black background are the main colors, while white and yellow are generally selected as the characters. This difference in design has led to our discussion and in-depth study.
Many previous studies have focused on the study of text-background color under various tasks. Ya-Hsien Ko (Ko 2017) found that yellow on black,
yellow on blue and white on blue are the clearest three color combina- tions in terms of legibility of brand icons with negative contrast polarity, and white on blue is one of the clearest color combinations. Bhattach- aryya et al. (Bhattacharyya et al. 2014) studied the influence of arrow figure and background color combination on cognitive performance through eye tracking, searching performance and subjective evaluation data. The results showed that the brightness contrast difference between figure and background had a significant impact on task performance. Huang (Huang 2008) proved that the higher color contrast ensures that the target is easier to be detected and can lead to the improvement of search performance. Iztok Humar et al. (Humar et al. 2014) confirmed that color combinati- ons have a significant impact on clarity when reading text on LCD, among which black and white, black and yellow, blue and white have the best scores.
Paired comparison (PC) has a long history, which originated from psycho- physics. In the 1920s, Thurstone (L.L.Thurstone 1994) officially determined the response model designed by personal computers when the stimulus had no physical counterpart, which was usually the expression or attitude statement showing different degrees of attitudes. Thurstone called this formalization Comparative Judgment (LCJ). Li-Chen Ou et al. (Ou et al. 2015) once applied the paired comparison experiment to the study of text-background color of reading interface, and found that when the brightness difference between text and background was moderate, the highest visual comfort evaluation was obtained. The LCJ method requires the subjects to choose between two interfaces at one time. Compared with the subjective sorting method, it can express the subjective preference of the subjects to the interface more effectively and get more real data.
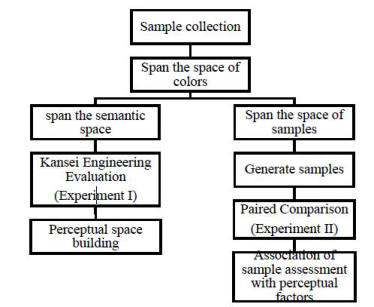
However, most of the previous studies were based on the reading state, while the research on short-term visual attention was limited. In addition, in outdoor special circumstances, the interface display mode with negative contrast polarity (brighter text on dark background) is often needed to make the display more distinct from the surrounding environment. Therefore, this experiment will also pay more attention to the color combination with nega- tive contrast polarity shown in Figure 1, which provides an important basis
Figure 1: Methodological framework.
Color Combination of Information Display 109
for standardizing the information guide design and rationalizing the interface design, and meets the needs of the public to obtain information quickly and efficiently.
EXPERIMENT I: EXPANDING AND EXTRACT THE PERCEPTUAL SPACE To evaluate samples in multiple perceptual dimensions, the perceptual space of information display was expanded, and the system of evaluating informa- tion display was obtained to reduce the dimensions of perceptual space by factor analysis.
Methods of Experiment I Kansei Engineering (KE) uses engineering techniques to explore the rela- tionship between public emotional needs and design features. (Fu et al. 2020; Chen 2013) (Chen et al. 2015). Semantic difference method (SD scale method) was combined in Kansei Engineering with text display design, and the luminance contrast was introduced between text and background color, so as to find out the relationship between text-background color combina- tion and perceptual image evaluation. In this study, information display of railway station was taken as an example. According to previous research (Bhattacharyya et al. 2014), yellow and white were selected as the text colors of samples, while blue, gray and black were selected as the background colors. In colorimetry, the wide capacity of the blue part is the smallest (Humar et al. 2014). Here, the most widely used and representative blue chromaticity coor- dinate was choose and adjusted in different brightness Y of CIE, as shown in Table 1.
Experiment Design Through questionnaires and previous studies (Ko 2017; Humar et al. 2014), six groups of perceptual words for evaluating information display were
Table 1. Color combinations and brightness contrast of stimulating materials.
Table available in the original PDF paper.
Name Sample luminance contrast
Name Sample luminance contrast
B-W 0.98 B-H 0.98
B2-W 0.86 B2-H 0.86
B3-W 0.92 B3-H 0.92
G3-W 0.92 G3-H 0.92
finally obtained through expert evaluation method and principal component analysis method, including kind-cold, concise-complex, clear-fuzzy, neat- messy, coordinated-abrupt and bright-dark. Forty-two adults (average 25 years old) participated in the evaluation of Experiment 1, including 22 males and 20 females. Forty-two participants scored 8 samples with 5-point Likert scale in 6 perceptual dimensions. 15.6-inch dell computer display (resolution 1920×1080) was used as the visual interface.
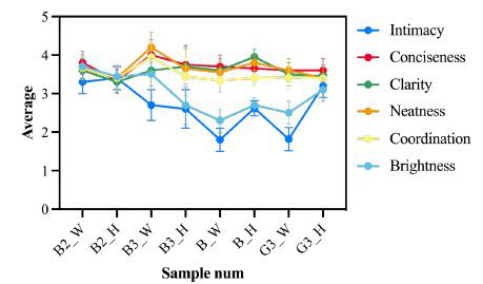
Results of Experiment I There are significant differences in the dimensions of intimacy (F = 9.994, p = 0.000), coordination (F = 2.005, p = 0.045) and brightness (F = 8.586, p = 0.000) in Figure 2. For intimacy, there is a small score difference of blue background samples, and the sample B2_H gets the highest affinity score, while the samples with black and gray background have significant differe- nces under different text colors: The affinity of yellow text is significantly higher than that of white (Ft = 20.912, p = 0.000). For coordination, varia- nce analysis shows that the differences mainly come from different text colors, but there is no significant difference in background colors. The coordina- tion of white text is higher than that of yellow text as a whole (Ft = 4.817, p = 0.029), especially in blue background, which shows that white text can get better coordination sense for information display. For brightness, con- trary to the previous sense, different background colors have a significant difference ((Ft = 14.394, p = 0.000), while text colors have no significant dif- ference, and there is a significant interaction between text and background colors. For black and gray backgrounds, yellow text samples have higher scores, while for blue backgrounds, white text samples get higher scores. This also shows that a reasonable combination of colors can bring positive emotions to viewers.
Discussion of Experiment I The data is dimensionalized according to factor analysis, and the variance maximization method was used to rotate the factors. The factor load matrix
Figure 2: Results of experiment 1.
Color Combination of Information Display 111
obtained after rotation was shown in the Table 2, in which the main perce- ptual factors influenced by the first factor are conciseness, clarity, neatness and coordination, while the main perceptual factors influenced by the second factor are intimacy and brightness. The new factor score was calculated by regression method, in which Principal Component Analysis and Principal Component Analysis was used for extraction method, and Varimax with Kaiser Normalization and Varimax with Kaiser Normalization was used for Rotation Method.
Thus, the original six perceptual dimensions were reconstructed into two dimensions, and the recalculation mode of the two dimensions was shown in the following formula. The first factor was mainly related to clarity and conciseness, so named “clarity”, and the second factor as mainly related to intimacy and brightness, so named “pleasure”. From the coefficient matrix, the main source of perceptual evaluation difference was pleasure, which shows that there is no significant difference in clarity dimension between the samples in Experiment 1, but different sensuality is caused by different ple- asure. In order to calculate the weight of perceptual evaluation, through the questionnaire “Sorting the Importance of Station Display Information and Perceptual Evaluation”, the row average scores of participants in the perce- ptual cognitive computing matrix scale of six information maps with different background colors are obtained. Among them, M represents the score of the item after sorting, and t represents the number of times the item is selected. After normalization according to the perceptual weight obtained from the questionnaire, the perceptual cognitive weight was obtained, as shown in Table 2.
X t χ = (M1t1 + M2t2 + M3t3 + . . . + Mntn)/
Conclusion of Experiment I The evaluation dimension of the information display is preliminarily obtai- ned by the SD method of Kansei Engineering. The two dimensions of clarity and pleasure can explain most of the sources of users’ perceptual differences in the information display. At the same time, although there are significant differences among different samples in the dimension of pleasure, combined with the weight scores of perceptual words by participants, pleasure is not a key perceptual factor for the design of the information display. Therefore, in
Table 2. Rotated component matrix and component score coefficient matrix.
the following research, the sample space will be further expanded, and the difference of clarity between samples will be enlarged.
EXPERIMENT II: Paired Comparison Experiments To obtain the evaluation of samples in the two perceptual dimensions in Experiment 1, paired comparison experiments was performed to further establish the relationship between sample characteristics and perceptual evaluation.
Method of Experiment II On the basis of Experiment 1, the perceptual space was extracted. Besides the text-background color, other necessary elements, such as dividing lines and prompt information were added to the sample. Because there is no signifi- cant difference between clarity and coordination in the first experiment, the lightness of colors was expanded in the second experiment, three groups of background colors with lower lightness were added for discussion, and seven background colors and two. text colors were combined in pairs to produce 14 displays with different text-background color combinations, as shown in the Table 4. In the paired comparison experiment, each interface will be pre- sented to the subjects together with the other 13 interfaces, resulting in a total of C2
14 = 91 combinations. In addition, 6 combinations will be repeated once to ensure the accuracy of the subjects’ selection.
Experiment Design 30 participants were recruited for two experiment, including 15 males and 15 females. The two participants were completely different. In each test, the subjects needed to conduct two groups of experiments. In the first group, the participants made matching and comparison choices according to the sense of clear coordination. In the second group, the participants made matching and comparison choices according to the “kindness and pleasure”. In each group, the combinations of 97 groups of stimulating materials will be presented to the subjects in random order, and the subjects will choose the one with better experience in the specified perceptual dimension from two different interface
designs each time. Each subject participated in the comparative selection of all 194 groups of samples.
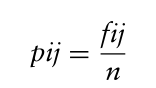
Results of Experiment II A total of 35 participants were recruited in the experiment, and 30 valid data were obtained. The preference weight of each sample was calculated by LCJ method (Franceschini and Maisano 2018). The better color combina- tion of information display was obtained in fitting regression equation. In each group of choices, participants choose the preferred sample as 1, the less preferred sample as 0, and the unable judgment as 0.5. the scores of 30 sub- jects in each group are calculated respectively, and the scores of each group are recorded as f_ij„ and then f_ij is converted into p_ij, with the formula as follows:
Equation reproduced from the original PDF.
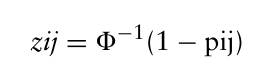
Where pij is defined as the probability of the subject’s preference, and then the pij value is converted into zij value according to the standard normal distribution, and the formula is as follows:
Equation reproduced from the original PDF.
The value of zij is positive when (1-pij) is greater than 0.500, negative when (1-pij) is less than 0.500, and zero when (1-pij) is equal to 0.500. After calculation, the relative zij values of 14 samples are shown in Table 4. Where 6ijj is the sum of each column, that is, the sum of 6ij values obtained by comparing each sample with all samples.
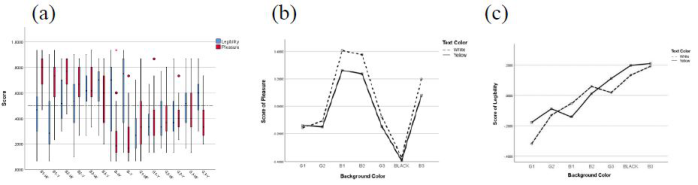
Discussion of Experiment II Significant differences were found among samples in the dimension of clarity (K = 108.973, p < 0.05) to perform Kruskal-Wallis test on the scores of legi- bility and pleasure of samples. At the same time, participants’ evaluation of black background was quite different, showing a skewed distribution. The scores of samples were mainly concentrated in higher areas, indicating that most participants thought the black background was more legible. As for the samples with B3 background color, participants’ opinions are consistent, but the scores of B3-Y are skewed and mainly concentrated at a high level, while the scores of B3-W are concentrated at a relatively low level, which is also the reason for the difference in the overall average level between the two groups of samples. Interestingly, the black background with the biggest difference of opinion in legibility evaluation have the same opinion among participants in pleasure evaluation, while the samples under B3 and G1 background con- ditions with small difference of opinion in legibility evaluation have great differences among individuals in pleasure evaluation.
From Figure 3(a), the evaluation of legibility and pleasure has roughly the same trend for gray background (G1, G2, G3), but there is a big differe- nce between blue background (B1, B2, B3) and black background (B). For blue background, the evaluation of pleasure is basically above the average
Color Combination of Information Display 115
Figure 3: (a) The evaluation of legibility and pleasure. (b) Pleasure and (c) legibility in different background colors.
value, which means that the blue background sample has a better performa- nce in pleasure, while for gray background, the evaluation values of legibility and pleasure seem to have a stronger relationship with the text-background brightness difference. Sample evaluation under different text color conditi- ons was analysed respectively in Figure 3(b-c). In terms of legibility, samples B3-Y, B-Y and B3-W have the best preference performance, which prelimina- rily verifies the previous conclusion that the greater the brightness contrast between text and background, the higher the definition of text interface. For blue backgrounds with higher brightness, white characters seem to be clea- rer, while for blue backgrounds with lower brightness, yellow characters are clearer. This may be due to the fact that yellow characters are more promi- nent on dark backgrounds close to black. At the same time, the legibility of yellow text is higher than that of white text on gray background with dif- ferent brightness, and there is no significant interaction between text color and background color on legibility (F = 0.589, p = 0.556). By analysing the pleasure in different background colors, there is an interaction on gray backgrounds with different brightness. On gray backgrounds with lower bri- ghtness, yellow texts are more enjoyable, while on gray backgrounds with higher brightness, white texts are more enjoyable. However, for blue back- grounds with different brightness, white texts perform better than yellow texts no matter how high the background brightness is.
Conclusion of Experiment II According to the characteristics of samples, the text color, background hue and the difference between text and background color lightness are selected as independent variables for linear regression analysis. Firstly, in the legibi- lity dimension, the linear correlation is significant, the correlation coefficient (R) is 0.491, and the adjusted determination coefficient (R2) is 0.236. The text color was defined as cT, with a value of 0 indicating that the text color is white and a value of 1 indicating that the text color is yellow. The back- ground color tone was defined as cB, with a value of 0 indicating that the background color tone is blue and a value of 1 indicating that the back- ground color tone is black; The lightness level difference is defined as 1Y, and the values of lightness level difference are shown in Table 6. From the regression results, the lightness level difference has the greatest influence on the definition evaluation, and the greater the lightness difference between text
Table 5. Independent samples test.
Table available in the original PDF paper.
B Std. Beta t Sig. Lower Bound
Upper Bound M1 (constant) -2.395 .262 -9.149 .000 -2.909 -1.880 Text color .044 .019 .099 2.313 .021 .007 .082 Hue of Background color -.101 .020 -.225 -5.125 .000 -.140 -.062 Lightness difference .034 .003 .493 11.154 .000 .028 .040
M2 (constant) 2.051 .245 8.370 .000 1.569 2.533 Text color -.279 .018 -.577 -15.311 .000 -.315 -.244 Hue of Background color -.058 .018 -.121 -3.256 .001 -.093 -.023 Lightness difference -1.567 .283 -.211 -5.545 .000 -2.122 -1.011
and background, the higher the definition, which is consistent with the pre- vious research conclusions. In the dimension of pleasure, a significant linear correlation was found that the correlation coefficient (R) was 0.663, and the adjusted determination coefficient (R2) was 0.435.
Equation reproduced from the original PDF.
From the regression results, the brightness level difference has the greatest influence on the definition evaluation, and the greater the brightness level dif- ference, the lower the pleasure, which indicates that viewers generally believe that the interface with low contrast can bring more pleasant and intimate fee- lings. The influence of text color is also very significant, and the white text is obviously superior to the yellow text in the performance of pleasure. In addi- tion, the background color also has a significant impact on the pleasure, and the pleasure under the blue background is obviously better than that under the black background.
After getting the relationship between the two perceptual dimensi- ons and the interface features, combined with the normalized perce- ptual vocabulary weight in Experiment 1, the comprehensive evaluation index is calculated. The calculation method and results are as follows, in which α and β are the perceptual weight values of legibility and pleasure respectively.
Mall = α · M1 + β · M2 = −0.20811Y + 0.0871cT −0.1100cB −2.0781 The interface of yellow text under blue background performs better after synthesizing multiple evaluation dimensions. At the same time, the lower the brightness level difference between text and background, the better the com- prehensive evaluation index, which may be caused by the negative impact of brightness level difference on pleasure far greater than the positive impact on legibility. Therefore, the design principle of improving the brightness level difference should also be followed when the interface legibility needs to be improved. Among the 14 interface samples in this experiment, under the comprehensive evaluation framework, sample B1-Y was the best performing samples.
Color Combination of Information Display 117
CONCLUSION AND FUTURE WORK In this study, the combination of Kansei Engineering SD method and paired comparison method was used to study the interface design. This method can effectively evaluate and predict the interface design. The research conclusions of the text are as follows:
For the text information display, the perceptual cognition of the interface can be evaluated from two dimensions, including legibility and pleasure, in which legibility refers to the clarity, coordination and conciseness of the interface, while pleasure refers to the friendliness and brightness of the interface.
In the design of information display with high legibility, the combination of blue background and yellow characters should be adopted as much as possible, and the brightness level difference between text and background color should be improved as much as possible.
In the design of information display that needs to bring kindness and ple- asure to users, the color combination of blue background and white text should be adopted, and the brightness level difference between text and background color should be appropriately reduced.
In the design of information display, which only needs to consider legibility, the color combination of dark blue or black background and yellow text can be used, but the black background has a very low evaluation on pleasure, which may bring poor viewing experience to viewers.
In the design of information display, which needs both clarity and intimacy, according to the weight of two perceptual dimensions, combined with the correlation law between color characteristics and perceptual cognition, select the appropriate text-background color combination.
Finally, in this experiment, this experiment only considers the subjective feelings of the participants on the information display, in the future resea- rch, the information display can be further analysed and studied through experimental methods such as eye movement and information search speed.
REFERENCES
Bhattacharyya, Debojyoti, Bodhisattwa Chowdhury, Tirthankar Chatterjee, Madhusudan Pal, and Dhurjati Majumdar. 2014. ‘Selection of character/back- ground colour combinations for onscreen searching tasks: An eye movement, subjective and performance approach’, Displays, 35: 101–09. Chen, Mu-Chen, Chia-Lin Hsu, Kuo-Chien Chang, and Man-Chi Chou. 2015. ‘Applying Kansei engineering to design logistics services – A case of home delivery service’, International Journal of Industrial Ergonomics, 48: 46–59. Chen, Y. 2013. “Research on Optimized Design of Kansei Engineering-Based Web
Interface.” In 2013 International Conference on Computational and Information Sciences, 1709–12. Franceschini, Fiorenzo, and Domenico Maisano. 2018. ‘A new proposal to improve the customer competitive bench marking in QFD’, Quality Engineering, 30: 730–61. Fu, Qianwen, Jian Lv, Shihao Tang, and Qingsheng Xie. 2020. ‘Optimal Design of
Virtual Reality Visualization Interface Based on Kansei Engineering Image Space Research’, Symmetry, 12: 1722.
Huang, Kuo-Chen. 2008. ‘Effects of computer icons and figure/background area ratios and color combinations on visual search performance on an LCD monitor’, Displays, 29: 237–42. Humar, I., M. Gradisar, T. Turk, and J. Erjavec. 2014. ‘The impact of color
combinations on the legibility of text presented on LCDs’, Appl Ergon, 45: 1510–7. Ko, Y. H. 2017. ‘The effects of luminance contrast, colour combinations, font, and search time on brand icon legibility’, Appl Ergon, 65:33-40. L. L. Thurstone. 1994. ‘A Law of Comparative Judgment’, Psychological Review,
101: 266–70. Ou, Li-Chen, Pei-Li Sun, Hsin-Pou Huang, and M. Ronnier Luo. 2015. ‘Visual comfort as a function of lightness difference between text and background: A cross-age study using an LCD and a tablet computer’, Color Research & Application, 40: 125–34.
LISTED IN THE AHFE DIGITAL BOOKSTORE CATALOGUE
Explore the complete digital volume
Kansei Engineering
Read this individual research paper free through the original publisher, or explore the full digital proceedings book.
ISBN 978-1-958651-77-3
Explore this ISBN in the AHFE Bookstore ↗Listed in the July 2026 bookstore catalogue; search by ISBN to confirm current availability · Digital book purchase optional