Lloyd Morris, Homero Murzi, Hernan Espejo, Olga Jamin Salazar De Morris, Juan Luis Arias Vargas (2022). Big Data Analysis in Vehicular Market Forecasts for Business Management. In: Human Factors, Business Management and Society. AHFE Open Access, vol. 56, pp. 430–440. https://doi.org/10.54941/ahfe1002299
Information in various markets constitutes the primary basis for making the right decisions in a modern and globalized world. Therefore, opportunities grow based on the availability of data and how the data is structured to obtain information that supports decision-making processes, Ogrean (2018) and Neubert (2018), and even more so when business dynamics revolve around satisfying the demand for the products or services offered, Jacobs and Chase (2009). This article proposes the analysis of the new vehicle market, through operational research techniques, addressing the behavior of vehicle sales for medium and long-term projections for business management. The analysis is developed through Markov Chains and time series analysis techniques, so a complementary approach is used to obtain predictions in future scenarios such as analysis in sales levels related to market shares. Choi et al (2018), indicate that one of the important applications of Big Data in business management is in the field of demand forecasts, becoming one of the common alternatives in prediction for data series over time. The data is taken from Statistics of the National Association of Sustainable Mobility, from 2016 to 2019 for new vehicles in the Colombian market, Andemos (2021). Merkuryeba (2019) proposes procedures between techniques that allow a comprehensive approach to forecasts and where the methods complement each other, it is through the use of the methodology in Markov chain models (Kiral and Uzun 2017), plus the methodology of the time series analysis (Stevenson et al 2015), which with a complementary approach, can reach a more detailed and comprehensive level of analysis for the statement about the future of the variable of interest: vehicle market sales for business management.The results showed that Markov chains were very useful in long-term analysis for sales forecasting and their analysis by market segmentation, for this the sales level is ranked according to the technique of Pareto. Another important contribution to the Markov chain in business management corresponds to the analysis disaggregated by sales rankings, for example in ranking 1 (first 5 brands), was obtained an expectation of value defined at 67.1% of the total sales level, also an internal analysis of this percentage ranking was carried out. Complementarily, for the alternative of times series analysis; we start from the analysis of the demand, where a seasonal behavior of vehicle sales is detected. Rockwell and Davis (2016) and Stevenson et al (2015), establish a procedure for estimating and eliminating seasonal components by using the seasonal index. Additionally, Weller and Crone (2012) and Lau et al (2018), recommend two common alternatives to measure forecast error and making decisions to selected the technique more adequate for business management: mean absolute deviation (MAD) and mean absolute percentage error (MAPE), finally, the result of the three techniques developed: moving average, exponential smoothing, and weighted moving average, the simple exponential smoothing, optimized through MAPE minimization is the selected technique, with which short and medium-term forecasts are defined.This study contributes directly to decision-making in the context of the marketing of new vehicles, as well as in academic settings in relation to research processes in data series under the configuration of big data. In this sense, it was demonstrate that the behavior of sales, segmented by market levels according to the participating brands, can be transformed into estimates of future behavior that establishes an orienting mapping of business objectives with respect to the possible level of participation in quotas of market. Finally, the methodological scheme under an epistemological perspective supported by technical decisions, represent an academic contribution of great relevance for business management, where is recommended to use the time series techniques for short and medium-term forecasts, while Markov chains for the prediction and analysis of the sales structure in medium to long term forecasts.
Information in various markets constitutes the primary basis for making the right decisions in a modern and globalized world. Therefore, opportunities grow based on the availability of data and how the data is structured to obtain information that supports decision-making processes, Ogrean (2018) and Neubert (2018), and even more so when business dynamics revolve around satisfying the demand for the products or services offered, Jacobs and Chase (2009), Kumar, and Suresh (2009).
In this sense, in the vehicular context, there is a special interest in studies that complement the analysis of market proportions that can guarantee the participation and permanence of car brands that compete commercially in the Colombian market, given the relevance related to aspects of the image, economic and communication that this type of information symbolizes in a highly competitive space in circumstances of price, quality, and diversity.
Big Data Analysis in Vehicular Market Forecasts for Business Management 431
Along with the interest of the study for its usefulness, there is the techni- cal foundation from the perspective of operations research that provides two tools with methodological approaches in the prediction of time series: Mar- kov chains and the time series analysis. In itself, what emerges is the degree of synergy between two approaches that lead to a comprehensive analysis.
There is a great diversity of big data applications to business cases, Choi at el (2018), exemplified among other applications at Apple, Coca Cola, Dis- ney, Toyota and MacDonald’s; from designing new products and services to forecasting the demand for products and services. For the application and subsequent analysis of the techniques used, it is necessary to present and evaluate the information using descriptive and inferential statistics, under a proposed configuration that allows a flexibility of review within a methodo- logical and practical diversification that makes its future use in the analysis of market shares.
METHODS
Choi at el (2018), indicates that one of the important applications of Big Data business management is in the field of demand forecasts, becoming one of the common alternatives in prediction for data series over time, with the intention of making the most of all the information we have about customers to increase the efficiency of processes and competitiveness in the organization Monsalve et al (2019).
Merkuryeba (2019) proposes procedures between techniques that allow a comprehensive approach to forecasts and where the methods complement each other, it is through the use of the methodology in Markov chain models (Kiral and Uzun 2017), plus the methodology of the time series analysis (Stevenson et al 2015), which with a complementary approach, can reach a more detailed and comprehensive level of analysis for the statement about the future of the variable of interest: vehicle market sales.
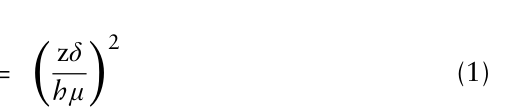
Sample: Definition 1: Sample size. Krajewski et al (2010), Anderson et al (2016) and Lind et al (2017), indi- cate that to determine the appropriate sample size the following should be taken into account: the desired level of precision (h: 5% is suggested), the desired level of confidence through the standardized normal value (z: sugge- sted value between 95 and 99 %, 95% is taken) and the adjustment in the variation or behavior of the data, which is measured through the mean of the initial sample size (µ) and its standard deviation (δ). Formula 1, has the form of calculation:
2
Equation reproduced from the original PDF.
hµ
The data is taken from Statistics of the National Association of Sustaina- ble Mobility, from 2016 to 2019 for new vehicles in the Colombian market, Andemos (2021). The calculation with the initial sample size of 60 data gives n = 30 data, so it is concluded that the sample size is sufficient.
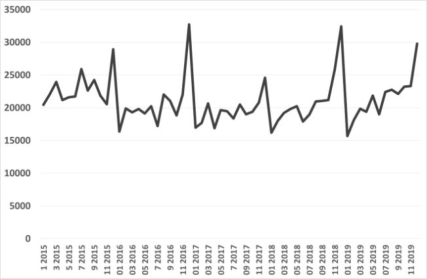
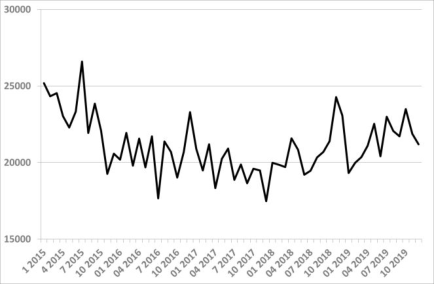
Figure 1: Sales in monthly units of new vehicles in Colombia.
Metodology: Defination 2: Time series. A time series is a set of Xt observations, where each one is recorded at a specific time t, Brockwell and Davis (2016). The time series studied obeys a discrete time series since it corresponds to the number of vehicles sold in monthly times.
The objective of the analysis of the time series is to manage to address some techniques that allow the development of statistical inferences for each of the series, in which the first step in the analysis of any series of data is to draw the same, Brockwell and Davis (2016). The original information organized under the time series scheme for each of the years under study from 2015 to 2019 of the sales in monthly units of new vehicles in Colombia, is shown in Figure 1.
From an initial analysis, there is a permanent behavior pattern in periods of one year, Anderson et al (2016), in which it is found that the behavior of sales has a seasonal pattern, since among other seasonal aspects, the peaks or higher levels are presented in the month of December of each year, while the lowest values or valleys are located in January of each year.
Merkuryeba (2019), suggests using several analysis scenarios according to the techniques that have been selected to study the data series. For this reason, two analysis scenarios are established.
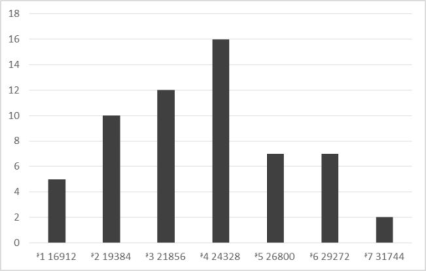
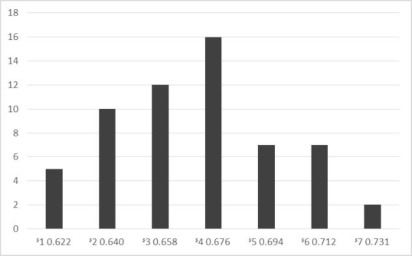
Markov Chains Definition 3: States. To define the states in the Markov chains, the general methodology for the construction of a histogram was used, Henriksen et al (2020) and Lind et al (2017), in Figure 2 the histogram corresponding to seven states that represent the seven levels of monthly new car sales in Colombia.
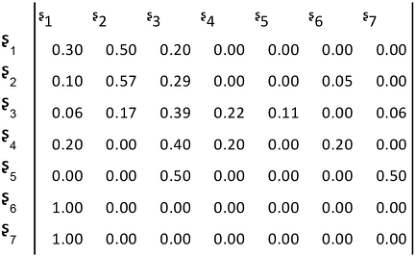
Defination 4: Probabilities of Markov Chains. Ordiano et al (2020), refers to a Markov chain characterized by a Pn matrix composed of one-step transition probabilities (n = 1), represented by Figure 3, for which the frequencies of the data of the previous histogram with respect to the total frequencies in each state.
Definition 5: Steady-state probabilities (5s˛i) - Markov Chains To define whether or not the data series has a stable long-term probability behavior, a system of equations can be established, using vector calculations
Big Data Analysis in Vehicular Market Forecasts for Business Management 433
Figure 2: States - levels of monthly new car sales in Colombia.Figure 3: One-step transition probabilities.
from the equation 1(Formula 2), Ordiano et to (2020). In this way, the system of equations was constructed to obtain the steady-state probabilities 5s˛i, for i = 1, 2, 3, 4, 5, 6 y7, for the sales rankings grouped in seven levels, Figure 4: an = a0 Pn = (5s˛1 5s˛2 5s˛3 5s˛4 5s˛5 5s˛6 5s˛7) (2)
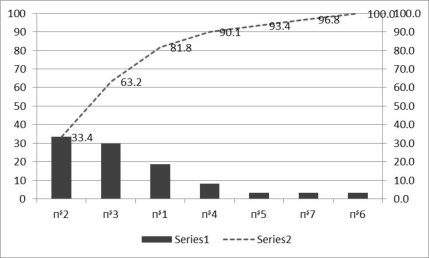
It is confirmed that sales have a long-term stable state behavior with pro- babilities associated with each state or level of sales according to the values in Figure 4, for example the probability of a sale level of state 2 (19.384 units) is 5s˛2 = 33.4%. In this way, an expected net level of long-term sales of 21047 vehicles per month is established.
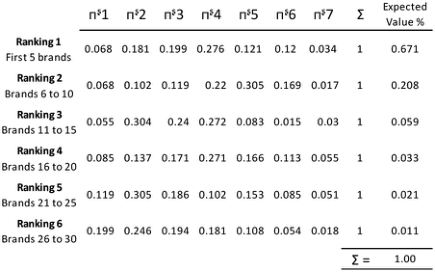
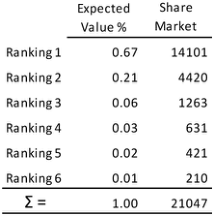
Finally, to carry out an analysis by market segmentation, a similar pro- cedure is carried out to the treatment of monthly sales data 2015 - 2019, but establishing in percentage terms six groups for market share (rankings grouped according to participation in the market in six sales levels), Figure 5 summarizes the steady-state probability profile for each classification.
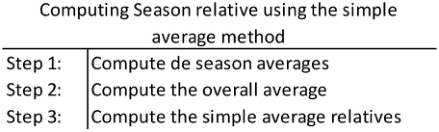
Time series analysis - Definition 6: Seasonal index. For the alternative of times series analysis, we start from the analysis of Figure 1, where a seasonal behavior of vehicle sales is visualized. Brockw- ell and Davis (2016) and Stevenson et al (2015), establish a procedure for estimating and eliminating seasonal components by using the seasonal index, this procedure is summarized in the following Figure 6.
For the first step, the average of the sales levels in each month was carried out, then the average of the averages obtained in the first step was carried out and finally the seasonality indices were obtained by dividing each result of step one with respect to the average obtained in the step three.
Definition 7: Seasonally adjusted data. Now with the seasonality indexes the original data is adjusted, Brockwell and Davis (2016) and Brownlee (2017), propose the differentiation method in which the trend or seasonality components are eliminated from the data. This is how the seasonally adjusted (SA) data gives the possibility of applying first or second level forecasting techniques. The following Figure 7 shows the seasonally adjusted data.
Definition 8: Time series techniques. The behavior pattern observed in the seasonally adjusted data does not present a defined trend; therefore, first-level techniques are used. Krajewski et al (2010), propose three first-level techniques: Simple Moving Averages, Weighted Moving Averages and Exponential Smoothing.
Weller and Crone (2012) and Lau et al (2018), recommend two common alternatives to measure forecast error and making decisions to selected the technique more adequate for business management: mean absolute deviation (MAD) and mean absolute percentage error (MAPE). These measures are formally defined as follows:
Big Data Analysis in Vehicular Market Forecasts for Business Management 435
Figure 7: Seasonally adjusted (SA) data.Figure 8: Times series techniques.Equation reproduced from the original PDF.
n (4)
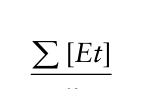
Where, Et forecast error for period t
Equation reproduced from the original PDF.
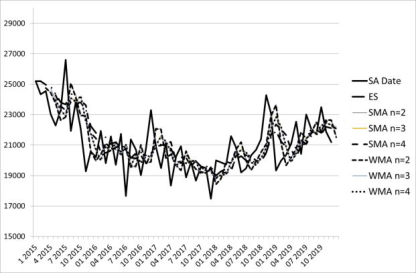
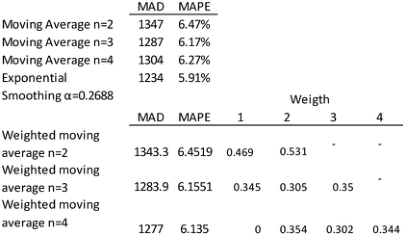
Figure 8, shows the result of the techniques developed: for the simple moving average (SMA, with: n = 2, n = 3 and n = 4); for the weighted moving average (WMA, with: n = 2, n = 3 and n = 4 optimized with MAPE) and exponential smoothing (ES, with alpha optimized with MAPE).
RESULTS AND DISCUSSION
HSI experts work within the framework, consisting of processes and meth- odologies, Markov chains were very useful in long-term analysis for sales forecasting and their analysis by market segmentation. In the sales forecast,
Figure 9: Sales forecast.
Figure available in the original PDF paper.
Figure 10: Hierarchical sales forecast.Figure 11: Steady state probabilities for ranking 1.
the number of vehicles according to each sales level (states defined in Mar- kov chains) is shown in Figure 9, the breakdown of the sales levels, where the expected net is 21047 vehicles per month.
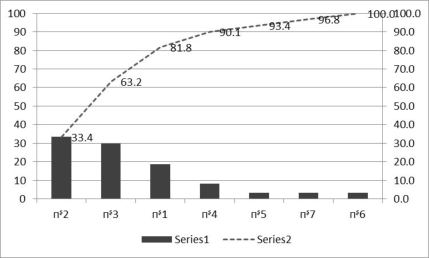
The sales level is ranked according to the Pareto chart shown in Figure 10. For example, for a 33.4% sales level, the expected sales units are equivalent to state two: (0.33356) (21047) = 7020 units. The 90% sales forecast is equivalent to the accumulated sales of states 2,3,1 and 4 for a total of 18,968 cars per month.
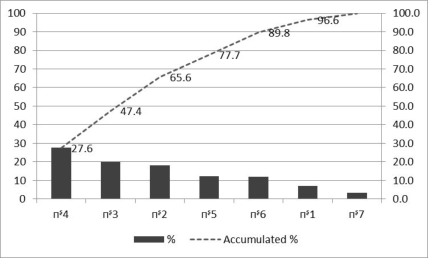
Another important contribution to the Markov chain in business mana- gement corresponds to the analysis disaggregated by sales rankings. For example, for ranking 1 (first 5 brands), with the expectation of value defined at 67.1% of the total sales level, an internal analysis of this percentage ran- king was carried out, verifying that in the long term stable states defined in the Figure 11.
When analyzing the values of Figure 11, it is observed that the state corre- sponding to the mark of the interval with the highest representativeness is the fourth state with a representativeness of 27.6%, then the third, the second, the fifth and the sixth to arrive practically at 90% of the expectation of value of 67.1%, that is, in five of the seven states, 90% of the expectation of value is accumulated. This equivalence can be seen in the histogram in Figure 12.
The procedure described for ranking 1 was also applied to rankings 2, 3, 4, 5 and 6 where it was possible to see visualizations very close to the Gaussian bell in sales levels associated with each percentage state. As an example of
Big Data Analysis in Vehicular Market Forecasts for Business Management 437
Figure 12: Hierarchical steady state probabilities for ranking 1.Figure 13: States - levels of monthly new car sales in Colombia for ranking 1.Figure 14: Sales forecast and market share for rankings.
what is expressed in Figure 13, the histogram of the seven states in the Mar- kov chains is shown that represent the seven disaggregated levels of monthly sales of the first 5 brands (Ranking 1).
Figure 14 shown the net breakdown of sales according to the value expe- ctations defined by the calculation of the stable states for all the established sales rankings.
With respect to the analysis of time series, precision played an essential role in selecting the most convenient among various prediction alternatives. Taking the references in error calculation of equations (1) and (2), Figure 15
Figure 15: Level of precision of times series techniques.Figure 16: Level of precision of times series techniques.
summarizes the values obtained from MAD and MAPE for the three techni- ques (Moving Average, Exponential Smoothing and Weighted Moving) that were used in the analysis of the seasonally adjusted data.
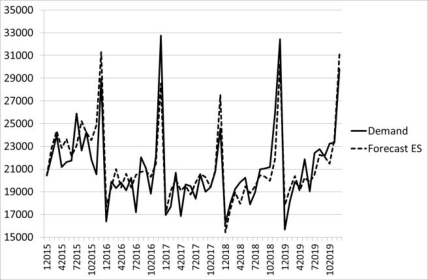
When analyzing the precision values of the seven alternatives in three techniques used, the one with the lowest MAD and the lowest MAPE is sim- ple exponential smoothing, optimized by minimizing MAPE at α = 0.2688, which is why it is the selected technique. Using the seasonal indices, it is possi- ble to convert the forecast seasonally adjusted with the ES to already seasonal values. Figure 16 identifies the seasonal simple exponential smoothing trace of the original vehicle demand data.
Finally, through IOR (Software Interactive Operations Research Tutorial) it is identified that in P ˆ 11, it is the moment in which the stable state of the vehicle demand data is achieved, that is, after 11 months, therefore, when Combining the results, it is recommended to use the results of the time series techniques for short and medium term forecasts, while the prediction and analysis of the sales structure is recommended through Markov chains in medium to long term predictions.
CONCLUSION
Demand management from the perspective of data volumes with vehicle mar- ket projections can be analyzed by combining the techniques of Markov Chains and time derives analysis.
Big Data Analysis in Vehicular Market Forecasts for Business Management 439
The objective of time series analysis is translated into the representation of the future that, in the case of vehicle information, adjusts to the forecast of the demand of the automobile sector in the short and medium term, which generates the possibility of controlling more efficiently the activities inherent to the production system.
The use of Markov chains in market segmentation analysis gives the possi- bility of addressing scenarios for the management of situations of uncertainty, for example, in stages of economic recovery by cutting the expected recovery percentages.
Establishing an analysis of sales through rankings or sales levels, achie- ves the decomposition of each segment generating scenarios of interest for the development of possible development plans or market penetration in the Colombian vehicle context.
REFERENCES
Andemos (2021), Asociacion Nacional de Mobilidad Sostenible de movilidad. Recuperado de: https://www.andemos.org/index.php/cifras-y-estadisticas-version-2/ Anderson, D. R., Sweeney, D. J., Williams, T. A., Camm, J. D., & Cochran, J. J.
(2016). Statistics for business & economics. Cengage Learning. Brockwell, P., Davis R. (2016). Introduction to time series and forecasting.
https://doi.org/10.1007/978-3-319-29854-2 Series ISSN1431-875X. Springer, Third Edition Brownlee, J. (2017). Introduction to time series forecasting with python: how to prepare data and develop models to predict the future. Machine Learning Mastery. Choi, T. M., Wallace, S. W., & Wang, Y. (2018). Big data analytics in operations
management. Production and Operations Management, 27(10), 1868–1883. Claudia, O. G. R. E. A. N. “Relevance of big data for business and management.
Exploratory insights (Part I).” Studies in Business and Economics 13.2 (2018): 153–163. Henriksen, T., Hellfritzsch, S., Sadayappan, P., & Oancea, C. (2020, November).
Compiling generalized histograms for gpu. In SC20: International Conference for High Performance Computing, Networking, Storage and Analysis (pp. 1–14). IEEE. Jacobs, F. R., & Chase, R. B. (2009). Administração da produção e operações: o essencial. Bookman Editora. Kiral, E. & Uzun, B. (2017). FORECASTING CLOSING RETURNS OF BORSA
ISTANBUL INDEX WITH MARKOV CHAIN PROCESS OF THE FUZZY STATES. Journal of Economics Finance and Accounting, 4 (1), 15–24. DOI: 10.17261/Pressacademia.2017.362 Krajewski, L. J., Ritzman, L. P., & Malhotra, M. K. (2010). Operations management: Processes and supply chains. New Jersey: Pearson. Kumar, S. A., & Suresh, N. (2009). Operations management. New Age International. Lau, R. Y. K., Zhang, W., & Xu, W. (2018). Parallel aspect-oriented senti-
ment analysis for sales forecasting with big data. Production and Operations Management, 27(10), 1775–1794. Lind, D. A., Marchal, W. G., & Wathen, S. A. (2017). Statistical techniques in business & economics. McGraw-Hill Education. Merkuryeva, G., Valberga, A., & Smirnov, A. (2019). Demand forecasting in
pharmaceutical supply chains: A case study. Procedia Computer Science, 149, 3–10.
Monsalve, E. B., Carreño, M. F., Gutiérrez, E. B., Molina, L. M., Garcia, J. F., & Rangel, H. B. “Theorization on case studies in business intelligence management on intellectual capital” In Journal of Physics: Conference Series (Vol. 1160, No. 1, p. 012011). IOP Publishing. (2019). Neubert, Michael. “The impact of digitalization on the speed of internationalization
of lean global startups. “Technology Innovation Management Review 8.5 (2018). Ordiano, J. Á. G., Finn, L., Winterlich, A., Moloney, G., & Simske, S. (2020, June).
On the analysis of illicit supply networks using variable state resolution-markov chains. In International Conference on Information Processing and Management of Uncertainty in Knowledge-Based Systems (pp. 513–527). Springer, Cham. Stevenson, W. J., Hojati, M., & Cao, J. (2015). Operations management. McGraw- Hill Education. Weller, M and Crone S (2012). Supply Chain Forecasting: Best Practices & Bench-
marking Study.
LISTED IN THE AHFE DIGITAL BOOKSTORE CATALOGUE
Explore the complete digital volume
Human Factors, Business Management and Society
Read this individual research paper free through the original publisher, or explore the full digital proceedings book.
ISBN 978-1-958651-32-2
Explore this ISBN in the AHFE Bookstore ↗Listed in the July 2026 bookstore catalogue; search by ISBN to confirm current availability · Digital book purchase optional