Jose Solaz, Jose Laparra, Hugo Silva, Knulp Rittmeyer, Nicolás Palomares (2022). Development and testing a drowsiness detector based on ECG sensors in steering wheel. In: Human Factors in Transportation. AHFE Open Access, vol. 60, pp. 386–393. https://doi.org/10.54941/ahfe1002470
Sleeping or drowsiness while driving contributes to human error, being one of the most relevant causes of traffic collisions and accidents in the world. Although it is foreseen that completely automated vehicles can reduce significantly these numbers, there will be a sequential incorporation of automated vehicles, from existing vehicles, level 0 or 1, to level 2 and level 3 of automation (according to SAE definition) in which the risk of drowsiness can persist or even increase. For this reason, reliable detection of drowsiness is one of the leading objectives in the development of new Advanced Driver Assistance systems. The main hypothesis in the present work is that the physical response in drivers can be indirectly measured via biophysical parameters, such as changes in heart variability (HRV), and that measurement can lead to early drowsiness detection. Following this principle, the main objective of this paper is to present the development a non-invasive system integrated in the vehicle steering wheel to detect the presence of somnolence while driving and validate it via KSS. The final purpose is to integrate the system in vehicles to create warnings or alarms for the driver to avoid accidents related with fatigue or drowsiness.
Sleeping or drowsiness while driving contributes to human error, being one of the most relevant causes of traffic collisions and accidents in the world (Chan, 2016). Although it is foreseen that completely automated vehicles can reduce significantly these numbers (Rowley et al. 2018), there will be a sequential incorporation of automated vehicles. In these vehicles, the driver’s role changes from an active operator to a passive observer. The consequence might be a decreased attentional focus towards the driving task and changes in driver’s arousal level (Shömig et al. 2018).
Monitoring biomedical signal (De Rosario et al. 2010) can be found in rela- ted literature, as especially useful during the drowsiness cycle. Some authors use the electroencephalography (EEG) (Subasi, 2005), but it is very invasive as requires wires attached to the head of the subject. Other efficient systems are those based on the use of electrocardiographic signal (ECG) (Tasaki et al., 2010), specifically, the HRV (Heart Rate Variability) parameter (Vicente et al. 2010), which can be potentially obtained by non-invasive sensors in contact with the user’s skin but also the self-reporting of drowsiness using scales such as Karolinska (Aidman et al. 2015).
Development and Testing a Drowsiness Detector based on ECG Sensors 387
Heart Rate Variability (HRV) The hypotheses proposed are related with the control of the cardiac rhythm, managed by the Autonomic Nervous System (ANS), and the response in a cognitive task:
ANS activity is modified in presence of stress, fatigue or drowsiness. Wakefulness state is characterized by an increase of sympathetic activity and/or decrease of parasympathetic activity, whilst the extreme relaxa- tion episodes are characterized by increase of parasympathetic activity (Kokonozi et al., 2008).
Driving is a cognitive task, where the cognitive demands are constantly changing. The presence of somnolence is expected to reduce the respon- siveness to these cognitive demands. However, the driver always tries to stay awake to drive safely, deriving in the “fighting state” where the driver tries to focus and stay awake at the same time.
Several parameters of heart rate are related to cognitive demands, and spe- cifically with the somnolence (Vicente et al. 2010, Furman et al. 2008), being the most used the following:
Heart rate variability (HRV) is inversely related with cognitive demands, so it is expected to increase when drowsiness appears. However, the “figh- ting state” can induce a reduction on the HRV due to efforts of driver to stay awake.
Power on low frequency (LF) band (0.04-0.15Hz) is related with sym- pathetic activity and high frequency (HF) band (0.15-0.4Hz) with the parasympathetic activity.
Drowsiness transitions reduce oscillations in the Very Low Frequency (VLF) band, anticipating change on LF/HF ratio.
Karolinska Scale For reports of habitual sleepiness, the Epworth sleepiness scale (Johns, 1991) is frequently used. For reports of instantaneous sleepiness (across the day and night), visual analogue scales (Monk, 1989) or Likert scales, like the 7-graded Stanford sleepiness scale (Hoddes et al., 1973) or the 9-graded Karolinska sleepiness scale (KSS) (Åkerstedt and Gillberg, 1990), are often used.
The KSS was originally developed to constitute a one-dimensional scale of sleepiness and was validated against alpha and theta electroencephalogra- phic (EEG) activity as well as slow eye movement electrooculographic (EOG) activity. It has been widely used and provided reasonable results in studies of shift work, driving abilities, attention and performance and clinical settings (Kaida et al. 2006).
Hypothesis The main hypothesis is that the physical response in drivers can be indirectly measured via biophysical parameters, such as changes in heart variability (HRV), and that measurement can lead to early drowsiness detection. The
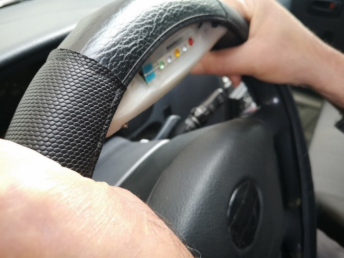
Figure 1: Steering wheel cover deployed. The electrodes have an identical look and feel to that of a regular cover; a visual analog scale (VAS) placed at the center of the steering wheel, following a color-coded simplified version of the karolinska drowsiness scale (KDS).
system to capture these data has been developed in two stages: prototype development and validation.
PROTOTYPE DEVELOPMENT ECG data acquisition is performed by means of a custom sensing setup mounted on the steering wheel, developed as an instrumented cover with which the driver interacts and that integrates the electrodes (needed for Ele- ctrocardiography - ECG), sensors, analog-to-digital conversion and wireless communication components (Figure 1).
The sensor setup is composed of a linear potentiometer, a tri-axial acce- lerometer with ±3g measurement range, and an ECG sensor with ±3mV measurement range. The linear potentiometer has been used to implement a simplified 5-point version of the Karolinska Drowsiness Scale (KDS); to eliminate language barriers and facilitate a visual interpretation. The accele- rometer has been integrated to help assess the steering briskness and vibration transmitted to the steering wheel. The ECG sensor builds upon a single lead design with virtual ground (Silva et al. 2011), which has been demonstra- ted to have a high correlation with the clinical Lead I in previous work (Da Silva, et al. 2014). Analog-to-digital conversion is performed by means of a microcontroller based on the BITalino system (Silva et al. 2011).
EXPERIMENTAL VALIDATION In Laboratory Validation
To assess the performance of the steering wheel ECG sensor under different potential driving conditions, one participant carried out several tests in a driving simulator using as driving scenario the Lane Change Test (LCT) as defined in ISO 26022:2010, extended to five minutes. During this period of time, the driver had to use both hands, one hand and no hands contact in certain periods of time.
Development and Testing a Drowsiness Detector based on ECG Sensors 389
Measuring System and Gold Standard During the experimental sessions, it was used the system described in Section 2 Proto-type development and compared with a gold standard, namely the ECG signal obtained with from BioSignalPlux with ECG sensors (Gain: 100, Range: ±1.5mV (with VCC = 3V), Bandwidth: 0.5-100Hz, Input Impedance: >100GOhm).
Driving Simulator We used a fixed-base driving simulator (De Rosario et al. 2010) in a room with ambient light, sound and temperature set to simulate the LCT scenario. The simulator recorded driving-related variables continuously.
Experimental Design The LCT is a simple driving simulation consisting of a 3000 m straight, three- lane road. The speed is limited to 60 km/h by the system and the driver has to drive the whole way at this speed. No other traffic is present on the road. The drivers are in-structed to change lanes by the time they see the signs that appear on each side of the road every 150 m. The signs are blank until 40 m before the sign.
During the test, the ECG signal generated with the steering wheel and the signal generated with ECG sensor from the chest were captured. Two hands driving detector algorithm have been developed in order to deal with the ECG captured with the steering wheel. Both the BioSignalsPlux ECG signal and the steering wheel ECG signal have been acquired with a 1000 Hz frequency.
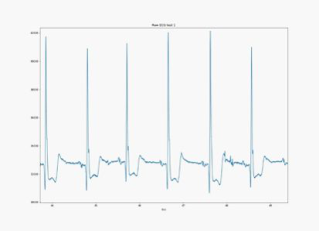
Results Analysis Raw data obtained with the two sensors were compared. The results show that the steering wheel ECG sensor introduces noise in the signal comparati- vely with the signal obtained with the gold standard (Figure 2).
Therefore, it is needed to filter and clean the ECG steering wheel signal in order to obtain the relevant information under different kinds of artefacts. With this purpose, an algorithm has been developed, which can identify if the
driver has both hands on the steering wheel and delete the useless information (signal goes to 0).
Error Estimation in the Heart Rate Every heart rate sample is calculated as shown in (1), where fs is the sampling rate and ps is the exact peak sample. Therefore, the distance between two consecutive peaks defined in number of samples is crucial in order to calculate the HR.
HR (i) = 60 ∗fs (ps (i) −ps (i −1)) (1) Signals were captured with a sampling frequency of 1000 Hz. The differe- nce in number of samples of the heart rate between the BioSignalsPlux ECG signal and the steering wheel ECG is between 1-2 samples. It appears some bigger sporadic errors due to the loss of one beat.
In Field Validation A set of data have been gathered from a series of car trips during the months of July and August 2018 in Portugal. A total of 59 registers were recorded from one driver.
Material and Methods The heart rate information has been extracted from the electrocardiogram (ECG) collected from the steering wheel with embedded sensors described in previous section.
In addition, the subjective driver’s drowsiness level has been used. The driver had to periodically indicate his perception of drowsiness while driving using a series of push buttons located on the steering wheel, corresponding to the drowsiness levels of the adapted version of the Karolinska scale (from 1 (Extremely alert) to 9 (Extremely sleepy, fighting sleep), also described in previous section.
Experimental Sessions Results The preliminary analysis of the raw signal has allowed to check:
Presence of frequent saturation in the ECG registers, especially at the beginning and at the end of each recording. This is due to absence of one of the hands on the steering wheel.
Loss of ECG signal due to highly noisy signal or loss of communication Processing Algorithms Firstly, to extract time between beats (RR interval), Pan-Tompkins algorithm (Lee et al., 1996) has been used. The “R” vector is used to calculate the heart rate.
For HRV analysis, parameters from time domain and frequency domain are calculated (Shaffer and Ginsberg, 2017):
Development and Testing a Drowsiness Detector based on ECG Sensors 391
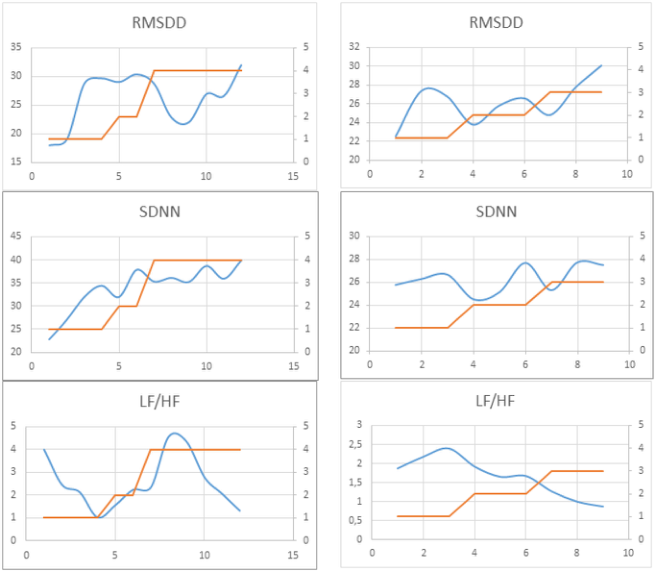
Figure 3: Examples of relation between heart rate parameters (blue line) and Karolinska value (orange line). Left axis is heart rate in ms; and right axis the Karolinska scale value.
Standard deviation of normal interbeat intervals excluding those which are outside the sinus rhythm (SDNN). This parameter is considered the Gold Standard in HRV.
Root Mean Squares of Successive Differences (RMSSD): Obtained by calculating the mean of each difference squared and the square root of the mean. This parameter informs of those variations that occur in a short period between RR intervals.
Low frequency high frequency ratio (LF/HF): Estimate the ratio between sympathetic and parasympathetic activity.
In order to observe the evolution of the variability during the trips, the data has been windowed and shifted. Window size is 5 minutes and is shifted each 1 minute, overlapping 80% of the window. It will allow to detect trends and reduce the influence of ANS response to specific events related with driver state (e.g. a traffic conflict).
Results Figure 4 shows the evolution of each parameter for some of the valid recor- dings, where some trends can be observed, as a decrease of LF/HF ratio and increase of HRV (in both parameters, SDNN and RMSSDD when the level of Karolinska moves between 1 and 3, and even seems that the behaviour is reverted when the drowsiness reaches level 4.
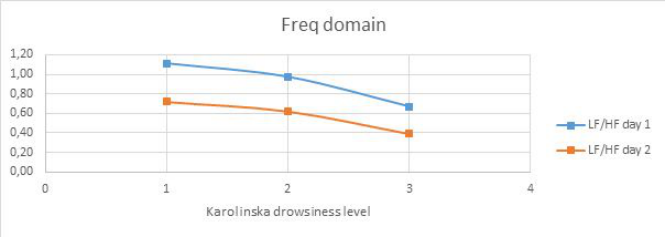
Figure 4: Mean values for heart rate parameters for Karolinska levels.
Figure 4 shows the parameters mean values of the valid recordings, more than 5 minutes of useful data and with changes in the Karolinska scale (only two days). SDNN and RMSSD increase with Karolinska level, but it seems to stabilize or even decrease above level 3 of Karolinska probably due to “fight sleep”. LF/HF ratio decreases as the Karolinska scale increases. The HF peak reflects parasympathetic activity, responsible of the “rest” response. Therefore, if HF peak is higher of LF is lower, the LF/HF ratio tends to decrease.
CONCLUSION
The technical viability of using heart rate parameters as an indicator of the presence of somnolence has been checked. HRV increases and LF/HF ratio decreases while drowsiness level increases. In some cases, this relation chan- ges due to the effect of “fighting state”, in which the driver tries to stay awake, but we need more data of 3-4-5 transition to check this trend.
Limitations in the experimental design (i.e. small sample, the need of using the two hands on the steering wheel) reduced considerably the number of recordings with changes on the Karolinska Scale.
Therefore, we have a considerable amount of baseline status, where Karo- linska scale is 1 (totally awake), but only some recordings have, at the same time, valid heart rate data and changes on the Karolinska scale.
ACKNOWLEDGMENT
NOKIA Networks for funding the present study.
Development and Testing a Drowsiness Detector based on ECG Sensors 393
REFERENCES
Aidman, Eugene, et al. “Real-time driver drowsiness feedback improves driver alertness and self-reported driving performance.” Accident Analysis & Prevention 81 (2015): 8–13. Åkerstedt, Torbjörn, and Mats Gillberg. “Subjective and objective sleepiness in the
active individual.” International journal of neuroscience 52. 1–2 (1990): 29–37. Chan, Margaret. (2016) World Health Organization. Road Safety: FACT SHEET #1 Road safety: Basic facts –Basic Facts (2016). Da Silva, Hugo Plácido, et al. “Check Your Biosignals Here: A new dataset for
off-the-person ECG biometrics.” Computer methods and programs in biomedi- cine 113.2 (2014): 503–514. De Rosario, Helios, et al. “Controlled inducement and measurement of drowsiness in a driving simulator.” IET intelligent transport systems 4.4 (2010): 280–288. Furman, G. Dorfman, et al. “Early detection of falling asleep at the wheel: A heart
rate variability approach.” 2008 Computers in Cardiology. IEEE, 2008. Hoddes, E., et al. “Quantification of sleepiness: a new approach.” Psychophysiology 10.4 (1973): 431–436. Johns, Murray W. “A new method for measuring daytime sleepiness: the Epworth
sleepiness scale.” sleep 14.6 (1991): 540–545. Kaida, Kosuke, et al. “Validation of the Karolinska sleepiness scale against performance and EEG variables.” Clinical neurophysiology 117.7 (2006): 1574–1581. Kokonozi, Athina, Ioanna Chouvarda, and N. Maglaveras. “EEG and HRV markers
of sleepiness and loss of control during car driving.”IEEE Engineering in Medicine and Biology Society. 2008. Lee, Jeongwhan, et al. “A simple real-time QRS detection algorithm.” Proceedings of 18th Annual International Conference of the IEEE Engineering in Medicine and Biology Society. Vol. 4. IEEE, 1996. Monk, Timothy H. “A visual analogue scale technique to measure global vigor and
affect.” Psychiatry research 27.1 (1989): 89–99. Rowley, John, et al. “Examining the driverless future: An analysis of human-caused vehicle accidents and development of an autonomous vehicle communication test- bed.” 2018 Systems and Information Engineering Design Symposium (SIEDS). IEEE, 2018. Schömig, Nadja, et al. “The interaction between highly automated driving and the
development of drowsiness.” Procedia Manufacturing 3 (2015): 6652–6659. Shaffer, Fred, and Jay P. Ginsberg. “An overview of heart rate variability metrics and norms.” Frontiers in public health (2017): 258. Silva, Hugo, et al. “Study and evaluation of a single differential sensor design based
on electro-textile electrodes for ECG biometrics applications.” SENSORS, 2011 IEEE. IEEE, 2011. Subasi, Abdulhamit. “Automatic recognition of alertness level from EEG by using neural network and wavelet coefficients.” Expert systems with applications 28.4 (2005): 701–711. Tasaki, Masaru, et al. “Evaluation of drowsiness during driving using electrocardiogram-a driving simulation study.” 2010 10th IEEE International Conference on Computer and Information Technology. IEEE, 2010. Vicente, José, et al. “Detection of driver’s drowsiness by means of HRV analysis.” 2011 Computing in Cardiology. IEEE, 2011.
LISTED IN THE AHFE DIGITAL BOOKSTORE CATALOGUE
Explore the complete digital volume
Human Factors in Transportation
Read this individual research paper free through the original publisher, or explore the full digital proceedings book.
ISBN 978-1-958651-36-0
Explore this ISBN in the AHFE Bookstore ↗Listed in the July 2026 bookstore catalogue; search by ISBN to confirm current availability · Digital book purchase optional