Olger Siebinga, Arkady Zgonnikov, David Abbink (2022). Interactive merging behavior in a coupled driving simulator: Experimental framework and case study. In: Human Factors in Transportation. AHFE Open Access, vol. 60, pp. 516–525. https://doi.org/10.54941/ahfe1002485
Human highway-merging behavior is an important aspect when developing autonomous vehicles (AVs) that can safely and successfully interact with other road users. To design safe and acceptable human-AV interactions, the underlying mechanisms in human-human interactive behavior need to be understood. Exposing and understanding these mechanisms can be done using controlled driving simulator experiments. However, until now, such human-factors merging experiments have focused on aspects of the behavior of a single driver (e.g., gap acceptance) instead of on the dynamics of the interaction. Furthermore, existing experimental scenarios and data analysis tools (i.e., concepts like time-to-collision) are insufficient to analyze human-human interactive merging behavior. To help facilitate human-factors research on merging interactions, we propose an experimental framework consisting of a general simplified merging scenario and a set of three analysis tools: (1) a visual representation that captures the combined behavior of two participants and the safety margins they maintain in a single plot; (2) a signal (over time) that describes the level of conflict; and (3) a metric that describes the amount of time that was required to solve the merging conflict, called the conflict resolution time. In a case study with 18 participants, we used the proposed framework and analysis tools in a top-down view driving simulator where two human participants can interact. The results show that the proposed scenario can expose diverse behaviors for different conditions. We demonstrate that our novel visual representation, conflict resolution time, and conflict signal are valuable tools when comparing human behavior between conditions. Therefore, with its simplified merging scenario and analysis tools, the proposed experimental framework can be a valuable asset when developing driver models that describe interactive merging behavior and when designing AVs that interact with humans.
One of the main present-day challenges in the development of autonomous vehicles (AVs) is enabling them to interact with human-driven vehicles safely, efficiently, and in a manner acceptable for occupants and other road users. To reach this goal, a deep understanding of human behavior in interactive
Interactive Merging Behavior in a Coupled Driving Simulator 517
scenarios is required. One example of such a scenario is merging on a highway.
While many studies have been performed to understand and model human behavior in non-interactive scenarios (e.g., car following (Li & Sun, 2012) or lane changing (Rahman et al. 2013)), there are only a limited number of stu- dies concerning interactive merging behavior. Some of these studies simulate behavior and decision-making to investigate interactions. Mostly using game theory to investigate higher-level traffic phenomena (e.g., Kita 1999). Because the behavior is simulated and not recorded, these studies do not provide insight into the dynamics of driving interactions. Other studies investigate merging using naturalistic traffic datasets (e.g., Wang et al. 2021). These have the disadvantage that they cannot capture the variability within (and between) pairs of interacting vehicles, because there are no (known) repeated trials per pair. Thus, when aiming to understand the dynamics and variabi- lity of interactive driving behavior, controlled human factors experiments are needed.
Existing human-factors experiments on merging behavior, have so far focu- sed mainly on the behavior of one of the participants of the interaction while using generated behavior for other traffic (e.g., Calvi & De Blasiis, 2011). But to fully understand the interaction, the joint behavior of both drivers and their mutual influence should be considered. Therefore, controlled expe- riments are needed that are designed specifically to expose these underlying mechanisms of interactive behavior.
For such an experiment, a merging scenario should be designed that evokes human interactive behavior and that can be repeated and analyzed systema- tically. Additionally, meaningful signals and metrics should be defined that provide insight into how the merging conflict is resolved by a pair of mer- ging drivers (e.g., comparable to time-to-collision for car following). Because experiments thus far focused on the behavior of single drivers, both this simplified merging scenario and these meaningful signals and metrics are lacking.
This work addresses that gap, by proposing an experimental framework for human-factors experiments in coupled driving simulators. We propose a simplified merging scenario that reduces the action space compared to natu- ral merging scenarios. This enables a first principled analysis for which we propose three novel tools: 1) a visual representation of the pair-wise beha- vior, 2) a signal describing the time-varying level of conflict, and 3) a novel metric named conflict resolution time (CRT). The three analysis tools pro- vide insight into the combined behavior of two drivers and how they solve the merging conflict. In a case study, we show the practical applicability of the experimental framework and outline its potential for measuring and modeling human-human merging interactions.
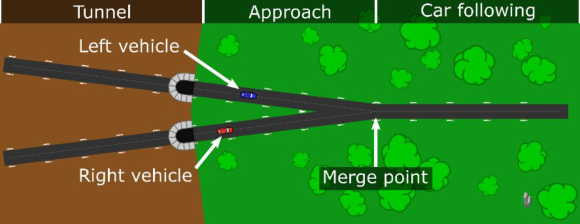
MERGING SCENARIO We consider a simplified merging scenario as illustrated in Figure 1. In this scenario, two vehicles of equal dimensions approach a predefined merge point. The acceleration of each vehicle can be controlled by a participant,
Figure 1: The proposed simplified merging scenario: a screenshot of the top-down view driving simulator used in the case study, rotated 90 degrees clockwise. The left and the right vehicle approach a merge point where their lanes merge into one instan- taneously. Trees and roadside markers give participants a visual cue for velocity. Each section of the track has a track length of 50 meters.
who is instructed to maintain their initial velocity, but prevent collisions. No steering is considered: the headings of the vehicles are always equal to the heading of the road, and at the merge point, the headings of the vehicles change instantaneously.
These simplifications reduce the vehicles’ action and position spaces to sin- gle dimensions (longitudinal velocity and traveled distance along the track respectively). Note that with two participants, the combined state of the two vehicles and their possible actions are both two-dimensional. Besides the simplifications of action and positions, the proposed merging scenario also simplifies environmental factors. In this scenario, there is no right of way, therefore, the gathered data is symmetrical.
The proposed merging track consists of three sections of equal track length (50 m): the tunnel, the approach (capturing the actual merging behavior), and a subsequent car-following section. In the tunnel section, participants cannot control their vehicle but can only observe the two vehicles, they gain control once both vehicles have exited the tunnel. This moment marks the explicit start of the interaction.
CASE STUDY To illustrate the utility of our simplified merging scenario, we performed a case study. All obtained results combined with material to further detail the experimental protocol and methods can be found online (Siebinga et al., 2022a). The software used in the experiment can be found on GitHub (Siebinga, 2022b).
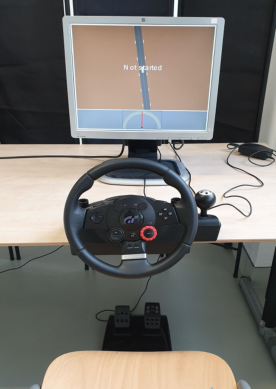
Eighteen drivers volunteered to participate in our experiment (6 female, 12 male, mean age: 25, std: 2.6), they were divided into 9 pairs of two. The participants were seated at separate tables and divided by a black screen to prevent them from seeing each other (Figure 2). Participants were instructed to remain seated, use one foot on the gas or brake pedal, keep both hands on the steering wheel (which was only used for feedback, not for steering), and to avoid making sounds. Finally, participants were told that this is a scientific experiment, not a game or a race, and that no vehicle had the right
Interactive Merging Behavior in a Coupled Driving Simulator 519
Figure 2: The experimental setup as seen from the view of one participant. The par- ticipant sees a top-down view of the vehicle they can control with the gas and brake pedal. The steering wheel provides vibration feedback if the participant deviates from the designated velocity. Visual velocity feedback is provided through the speed dial in the lower part of the screen.
of way. When the vehicles in the simulation collided, the participants got a time penalty of 20 seconds.
To investigate the impact of initial conditions on merging behavior, the experiment consisted of 11 experimental conditions in which two variables were varied: the initial relative velocity of the vehicles (the average velocity was always 10 m/s), and the projected headway when the first vehicle reaches the merge point (assuming that the vehicles maintain their velocity). Both are defined to be positive when the value for the left vehicle is larger. The conditions were labeled with a combination of numbers. First, the proje- cted headway at the merge point in meters (-4, -2, 0, 2, or 4 meters), and second, the relative velocity of the vehicles (-8, 0, or 8 decimeters/second). The 11 conditions used were (-4_-8), (-4_0), (-4_8), (-2_8), (0_8) (0_0) (0_-8), (2_-8), (4_-8), (4_0), and (4_8). Each condition was repeated 10 times in ran- dom order for every pair of participants. Five additional trials from random conditions were used at the start of the experiment as training runs.
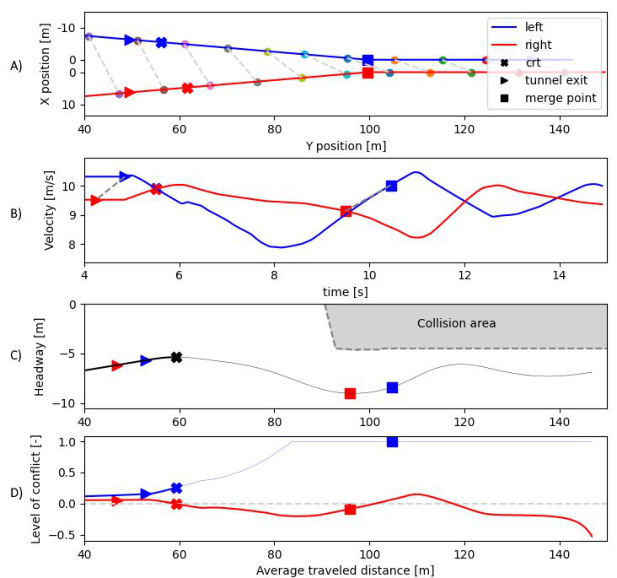
RESULTS AND ANALYSIS TOOLS Besides the simplified merging scenario, we propose three analysis tools that provide insight into interactive behavior: 1) a visual representation of the pair-wise behavior, 2) a signal describing the time-varying level of conflict, and 3) a novel metric named conflict resolution time (CRT). Using these tools, an overview figure that provides insight into the conflict resolution behavior of the pair of participants was made for every trial. Figure 3 shows a represen- tative example of this overview, figures for all other trials can be found online
Figure 3: Dynamics of a representative case study trial (pair 1, trial 1, condition -2_8). Panel A shows individual positions, the connected markers represent positions at the same points in time showing the left car exits the tunnel later, and arrives later at the merge point. Panel B shows individual velocities over time. Panels C and D show the “headway – average distance” trajectory and the level-of-conflict signal, respectively. These will be introduced in the following sections. The conflict resolution time (CRT) is indicated by the crosses, this metric will be explained in the second last section. Finally, triangles indicate the moment when a vehicle exits the tunnel and squares denote the moment a vehicle reached the merge point. The average traveled distance is the average position (distance along the track) of the two vehicles.
(Siebinga et al. 2022a). We will use the example in Figure 3 to introduce our proposed analysis tools in the following sections.
In Figure 3, we first illustrated the positions and velocities of the indivi- dual participants (panels A and B). Both these plots illustrate the dynamics of individual vehicle motion but provide little insight into how and when the conflict was resolved, besides the fact that the right vehicle reached the merge point first. Therefore, we propose to use the visualization in panel C of Figure 3.
Interaction Visualization During Merging and Car-Following A meaningful visualization of a traffic interaction should capture both the state and possible actions of the involved vehicles, as well as the safety mar- gins. Consider car following for example. The commonly used plot of the distance gap over time shows the current state (gap), action (the slope of the
Interactive Merging Behavior in a Coupled Driving Simulator 521
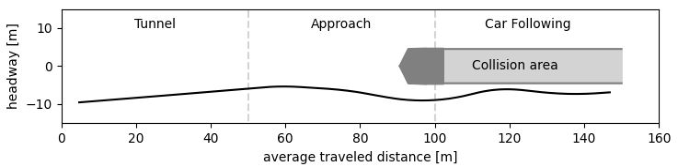
Figure 4: The proposed visualization of the interactive behavior, this in an extended view of Figure 3 panel C. The darker part of the collision area is influenced by the merge point, the light part represents the car-following part. The joint trajectory in the “headway - average distance” plane shows the dynamics of how the conflict is resolved and when it is resolved (when the line no longer heads for the collision area). Additionally, the safety margin is shown as the headway between the trajectory and the collision area (this is the gap).
trajectory represents the relative velocity), and safety margin (if the gap is 0, a collision occurs). We propose to extend this gap-plot in two ways to make it applicable to the interactive merging scenario.
First, we represent the behavior of the two drivers by plotting the headway; the distance between the front bumpers of the vehicles. We define the hea- dway such that it is positive if the left vehicle is ahead. And second, instead of against time, we plot the headway against the average traveled distance of the two vehicles (we expand on this later in this section). The resulting trajectory in the “headway – average distance” plane represents the joint dynamics of the two vehicles (Figure 4).
In the car-following gap plot, the imminent collision is indicated simply by the gap approaching zero (or the headway approaching the length of the vehicle), in our interactive merging scenario no collision can occur during the approach, yet a conflict can still be present (i.e. the vehicles are heading tow- ards a collision). To visualize this approach conflict, we define the collision area in the “headway – average distance” plane (grey area in Figure 4). This area is a block during the car following section and does not exist during the approach. The shape and size of it at the merge point depend on the dimen- sions of the track and the vehicles (the dark part in Figure 4). If the joint trajectory of the vehicles goes inside the collision area a collision occurs. The exact boundaries of the area can be calculated by minimizing the headway while constraining the overlap between the vehicles to be 0, for all average traveled distances.
We opted for visualizing the headway against the average distance and not time because the existence of the described collision area depends on the section of the track the vehicles are in. Therefore, representing it over time makes it dependent on the vehicles’ positions at a certain time. This would result in a different visual representation of the collision area for every repe- ated trial of the experiment. Thus, it would make it impossible to compare trials in a single plot. Conversely, plotting the headway over the average dista- nce along the track anchors the collision area (and track sections) and enables the visual comparison of experiment trials.
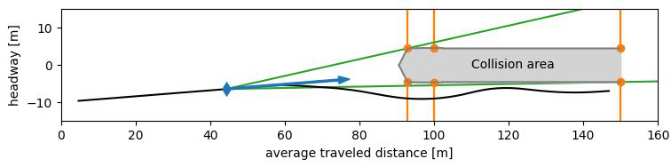
Figure 5: The construction of the level-of-conflict signals from the “headway – average distance” plane representation. The blue marker and arrow represent a point and slope of the headway trajectory. The orange lines denote the checkpoints along the track, orange markers indicate the minimum safe headway there, for both the left and right- first solutions. The green lines represent the minimum and maximum slope needed to clear the collision area. They thus represent the deviation needed from the current trajectory, to safely reach the left-first (top) or right-first (bottom) solution.
In the context of the overview figure with case study results (Figure 3C), our proposed visual representation provides additional insight compared to the position and velocity plots (panels A and B). The “headway – average distance” trajectory shows the initial conditions (i.e., the situation at the tun- nel exit), the chosen solution (the trajectory bends down so the right vehicle went first), and the safety margin (the gap between the vehicles at the merge point is observable as the vertical distance between the line and the collision block: approximately 4 m).
Level-of-Conflict Signal The visual representation of the interaction also inspired us to propose a signal describing the level of conflict (Figure 3D). It quantifies the amount of effort needed to resolve the conflict as well as the safety margins after the conflict is resolved. The signal is calculated using three checkpoints along the track (illustrated as orange lines in Figure 5). These checkpoints are situated at the end of the track, at the merge point, and at the collision threshold (the first position on the track where a collision can occur). This collision threshold is located before the merge point because there is a possibility of a side-to-side collision on the approach.
There are always two solutions to the merge conflict: either the left vehicle merges first or the right one does. At every checkpoint, the minimum safe headway can be determined for each solution (this is positive when left merges first and vice versa). These minimum safe headways at the checkpoints can be represented as points on the boundary of the collision area in the “headway – average distance” plane (orange markers in Figure 5).
For every point on the headway trajectory, we can now calculate the angle between the current slope of the trajectory (blue arrow in Figure 5) and vectors towards all 6 boundary points (orange markers in Figure 5)(for the implementation, see Siebinga 2022b). The minimum and maximum values of these 6 angles can be visualized as lines from the current point on the tra- jectory to a boundary point, which precisely clears the collision area (green lines in Figure 5).
Interactive Merging Behavior in a Coupled Driving Simulator 523
Note that the slope of the headway trajectory is directly related to the relative velocity of the vehicles, these angles thus represent changes in rela- tive velocity. Therefore, they quantify the deviation from the current relative velocity that is required to safely reach one of the two possible solutions (either the left goes first and the trajectory goes above the collision area, or vice versa).
The minimum and maximum angle for every point on the trajectory make up two conflict signals, one for the left-first solution (maximum) and one for the right-first solution (minimum). These signals are inversely related: if one solution becomes easier, the other becomes harder. Right-first solutions always require a clockwise rotation of the slope because the trajectory will go under the collision area. Therefore, we multiply the right-first (minimum) angles with -1. This ensures that the conflict signal is always positive if the vehicles are currently on a collision course, and negative if the conflict is resolved. Finally, we normalize the calculated angles by dividing them by the maximum possible angle. The headway can maximally increase with a factor of 2 over the average traveled distance thus the maximum absolute angle is atan(2). The result is a conflict signal that ranges from -1 (maximum safety margin) to 1 (maximum conflict).
In the context of the overview figure with case study results (Figure 3D), the proposed signals illustrate the conflict dynamics to a larger extent than the proposed “headway – average distance” representation (panel C) alone. The level of conflict for the right-first solution is initially lower, suggesting that it is easier for the two participants to resolve the conflict in a way where the right vehicle goes first. This is indeed what happened in this trial: the conflict was resolved when the level of conflict for the right-first solution reached 0. When the left-first conflict signal reached 1, that solution was not reachable anymore.
Furthermore, the conflict signals highlight what happened during the rest of the experiment. In the car following section, the right-first conflict signal becomes positive indicating that the vehicles are on a collision course again. This can also be seen in the headway trajectory, which is heading towards the collision area at that point. While this would have been visible in a time- to-collision plot, it is not clear in the raw position and velocity data (panels A and B).
Conflict Resolution Time Besides having visual representations of a complete trial of the experiment, it is vital to have a metric that captures the dynamics of the conflict resolution in a single number. Such a metric can be used to compare different experimental conditions and human pairs. We propose to use the conflict resolution time (CRT) as this metric. We define CRT as the time between the start of the interaction (tunnel exit) and the first moment the vehicles are no longer on a collision course (assuming constant velocities).
To calculate the CRT, we use the same three checkpoints along the track that were used for the conflict signal (the orange lines in Figure 5). For every
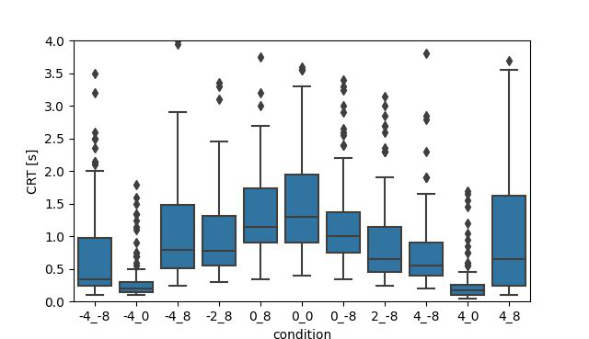
Figure 6: The conflict resolution time (CRT) values for all trials of the experiment, presented per condition.
time step, we calculate if continuing at the current velocity will result in a col- lision at any of the checkpoints (for the implementation, see Siebinga 2022b). At the first point in time where no collision would occur, we assume the conflict is resolved.
To investigate differences between the conditions, we analyzed CRT over all participants (Figure 6). We found that in some conditions, the conflict was solved faster than in others, which can be interpreted as the conflict being easier to solve. The condition 0_0 for example, where neither vehicle had an advantage in terms of projected headway or velocity, had the highest median CRT. This decreased for conditions where one of the vehicles did have an advantage. The CRT was lowest for the conditions where the vehicles had equal velocity, but where one had a projected headway advantage.
DISCUSSION AND CONCLUSION In this work, we proposed an experimental framework for investigating the merging behavior of a pair of human drivers in a coupled driving simula- tor. Additionally, we proposed three novel analytic tools to quantify essential characteristics of merging behavior: the “headway – average distance” tra- jectory, the level-of-conflict signals, and the conflict resolution time (CRT). The results of our case study show that our proposed visual representation and level-of-conflict signals provide additional insight into individual trials compared to basic velocity and position traces. Our proposed CRT metric can be used to expose aggregate differences between conditions. Together, these analysis tools can help to meaningfully compare joint human-human behavior in merging interactions between trials and between conditions.
There are three main limitations to the proposed framework and the setup of our case study. One major limitation is that it is currently unknown how human behavior in this simplified scenario exactly relates to natural merging behavior. Simplifying the scenario in a controlled environment is a necessary first step for obtaining insight into the merging behavior. However, future
Interactive Merging Behavior in a Coupled Driving Simulator 525
work should focus on extending the controlled environment to a more natural 3-dimensional space that includes environmental factors such as right-of-way. Second, the proposed analysis tools are not yet suitable for use in a 3-dimensional environment because they are all related to the dimensions of the track and the vehicles. If steering control is added to the vehicles, and the merge point is converted to a merge line, the fixed collision area in the inte- raction “headway – average distance” plane is no longer valid. Thus, how to extend the proposed analysis tools to a 3-dimensional environment remains an open question.
The final limitation is specific to our case study. In the case study, the same pair of participants performed 110 trials of the experiment. Participants were aware that these trials all involved the same opponent. This could have led to participants anticipating the driving style of the other driver after seve- ral trials, something which is not possible in natural driving. Future studies could include multiple participants at the same time, with random pairing of participants at the start of each trial to account for this.
Despite these limitations, we believe our experimental framework can be a valuable asset in future studies of human-human interactive merging beha- vior. It can therefore support the development and validation of human beh- avior models, advanced driver assistance systems, and autonomous vehicles that interact with humans.
ACKNOWLEDGMENT
The authors thank Nissan Motor Co. Ltd. for funding this work.
REFERENCES
Calvi, A., & De Blasiis, M. R. (2011). Driver Behavior on Acceleration Lanes.
Transportation Research Record: Journal of the Transportation Research Board, 2248(1), 96–103. https://doi.org/10.3141/2248-13 Kita, H. (1999). A merging-giveway interaction model of cars in a merging section: A game theoretic analysis. Transportation Research Part A: Policy and Practice, 33(3–4), 305–312. https://doi.org/10.1016/s0965-8564(98)00039-1 Li, Y., & Sun, D. (2012). Microscopic car-following model for the traffic flow: The
state of the art. Journal of Control Theory and Applications, 10(2), 133–143. https://doi.org/10.1007/s11768-012-9221-z Rahman, M., Chowdhury, M., Xie, Y., & He, Y. (2013). Review of Microscopic Lane-Changing Models and Future Research Opportunities. IEEE Transacti- ons on Intelligent Transportation Systems, 14(4), 1942–1956. https://doi.org/10. 1109/TITS.2013.2272074 Siebinga, O. (2022b). simple-merging-experiment [Software]. https://github.com/tud
-hri/simple-merging-experiment Siebinga, O., Zgonnikov, A., & Abbink, D. (2022a). Human behavior in a simplified highway merging scenario recorded in a coupled driving simulator [Dataset]. http s://doi.org/10.4121/19550377 Wang, H., Wang, W., Yuan, S., Li, X., & Sun, L. (2021). On Social Interactions
of Merging Behaviors at Highway On-Ramps in Congested Traffic. IEEE Tran- sactions on Intelligent Transportation Systems, 1–12. https://doi.org/10.1109/tits .2021.3102407
LISTED IN THE AHFE DIGITAL BOOKSTORE CATALOGUE
Explore the complete digital volume
Human Factors in Transportation
Read this individual research paper free through the original publisher, or explore the full digital proceedings book.
ISBN 978-1-958651-36-0
Explore this ISBN in the AHFE Bookstore ↗Listed in the July 2026 bookstore catalogue; search by ISBN to confirm current availability · Digital book purchase optional