Alessandra Amendola, Alessandro Grimaldi, Walter Distaso (2022). Predicting economic indicators using Political Texts. In: The Human Side of Service Engineering. AHFE Open Access, vol. 62, pp. 201–209. https://doi.org/10.54941/ahfe1002559
The paper proposes a new text-based indicator aimed at assessing the impact over time of political debate on economy. Textual data from the plenary verbatim reports of the Italian Parliament are pre-processed and relevant themes, whose temporal evolution allows predicting fluctuations in fundamental macro-economic variables, are estimated via a Correlated Topic Model. Specifically, a Political Debate Index is derived based on a time-varying weighting function of the estimated topic proportions. The capability, in terms of out-of-sample forecasts accuracy, of the proposed approach in improving the predictability of selected economic indicators is evaluated considering different predictors. The reached results seem to support the evidence that qualitative information conveyed by the daily political debate does have an impact on the economic dynamic over time and can be usefully used to improve the economic predictions performance.
Recently, applications of topic modeling in economics have dramatically increased with researchers mainly focused on: the analysis of the evolution of the economic literature over time; the prediction of stock prices, returns, and volatility; the analysis of the effects of central banks communication; the development of text-based indices and economic. See, for instance, Lüde- ring and Winker (2016), Adämmer and Schüssler (2020), Cerchiello and Nicola (2018), Baerg and Lowe (2020), Hansen, McMahon, and Prat (2017), Angelico et al. (2021), Larsen and Thorsrud (2019).
So far, the preferred sources of texts have been social media, newspapers, and, in some cases, transcripts of Central Bank Governors or Presidential speeches. Other types of texts such as politicians’ speeches, which also might be of interest from an economic perspective, have been somewhat disregarded in the field, although they are quite frequent in social and political science works. See, for instance, Gentzkow, Shapiro, and Taddy (2019), or Grimmer (2010), among others.
In this work, we explore parliamentary records through topic models whose output is utilized to construct economic indices integrating qualita- tive information conveyed by texts with purely quantitative information from traditional economic measures.
DATA DESCRIPTION The construction of the proposed indices requires two types of data: the tran- scripts of parliamentary debates and the time series of economic indicators. The procedure described is entirely replicable for any language and Coun- try. We choose to focus on Italy motivated by the following considerations. First, this Country is a rather peculiar case when it comes to the complexity of its political system – for instance, in the considered 24 years, 14 Govern- ments succeeded one another. Second, with few exceptions (e.g. Angelico et al. (2021) or Larsen and Thorsrud (2019)), languages other than English are still quite rare in such literature.
Moving to more technical information, we measure time in quarters. Sam- ple period (S) instants are indicated as t = 1, . . . , T = 98, corresponding to calendar quarters 1996:Q2 – 2020:Q3.
The Italian Senate Parliamentary Reports We analyze more than 4,300 parliamentary verbatim reports of the Italian Senate of the Republic from 09 May 1996 to 08 September 2020, i.e. 6 Legislatures – from the 13th to the (still ongoing) 18th.
After extraction from .pdf format, thanks to their consistent structure we split the reports into the single speeches given by orators, and construct the data frame used for standard cleaning (Banks et al., 2018; Denny and Spirling, 2018) and stemming – i.e. the reduction of inflected words to their base form – to reduce data dimensionality. To reduce noise and increase efficiency, very short speeches of less than 10 words are filtered out. The remaining speeches are aggregated on a daily basis before rearranging them in a document-term matrix (DTM). Precisely, to check topic model sensitivity to the dictionary magnitude, 5 different DTM are constructed by selecting the top 20, 40, 60, 80, and 100 percent of most relevant words in terms of their Term Frequency-Inverse Document Frequency (TF-IDF) transformation (Sammut and Webb, 2011). Details are given in Table 1.
The Economic Variables Similar to Larsen and Thorsrud (2019), to link parliamentary debate and economic dynamics, we use 8 national accounts statistics. Specifically, the time series of the output (Y), imports (M), consumption (C), government expenditure (G), investments (I), exports (X), wages (W), and taxation (T) are retrieved from the Italian National Institute of Statistics (ISTAT) website. In detail, Y is the gross domestic product at market prices; M and X are the imports and exports of goods and services; C is the final consumption expen- diture of households and non-profit institutions serving households; G is the consumption of general government; I is the gross fixed capital formation; W is the domestic compensation of employees; T is the taxes minus the sub- sidies on production and imports. Aggregates are measured in current prices millions of euros. All the time series are quarterly based and seasonally adju- sted by the source via the Tramo-Seats procedure which accounts also for calendar effects wherever they are present (Istat, n.d.).
Predicting Economic Indicators Using Political Texts 203
size (%) Min 25% Median Mean 75% Max Min 25% Median Mean 75% Max
DTM Statistics Terms Counts Statistics
Dimensions Sparsity Across Corpus Across Vocabulary
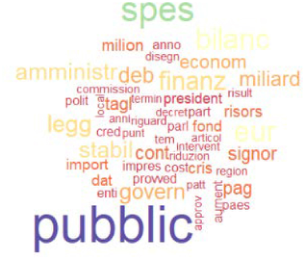
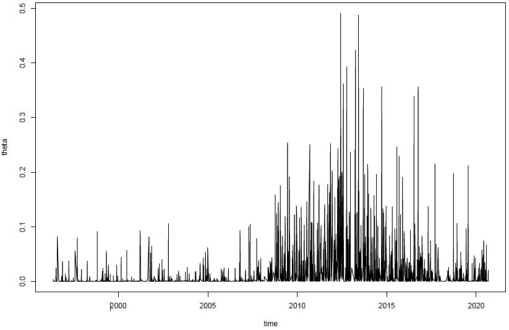
Figure 1: 100% TF-IDF corpus K = 100 CTM: Topic 61.Figure 2: 100% TF-IDF corpus K = 100 CTM: Topic 61 daily proportions.
METHODOLOGY
The Correlated Topic Model In the field, the Latent Dirichlet Allocation (LDA) “of Blei, Ng, and Jordan (2003) is the most prominent and widely applied topic model”(Adämmer and Schüssler, 2020). However, it does not allow for correlations among topics. Hence, as all documents belong to the same collection (Vayansky and Kumar, 2020), we apply the Correlated Topic Model (CTM) of Blei and Lafferty (2007) to each of the 5 CTM. As a result, we estimate the per-topic term probabilities βk, where k ∈{1, . . . K} and K is the total number of topics, and the per-document topic proportions θd, where d ∈{1, . . . , D} and D is the total number of documents. Figure 1 shows an estimated topic (β), Figure 2 its corresponding document proportions (θ).
The Optimal Number of Topics A key aspect in topic modeling is determining K. To address the issue, a data- driven strategy is adopted, similar to Adämmer and Schüssler (2020): several CTM are estimated and compared through diagnostic statistics. Specifically, for each of the 5 DTM previously built, 15 models are estimated with a K
Predicting Economic Indicators Using Political Texts 205
Figure 3: CTM Diagnostics by K and DTM.Table 2. TPDI.
Table available in the original PDF paper.
Index Type ARX-AR Based TVARX-TVAR Based
PK
PK
I0
Equations and mathematical formulas are available in the original paper PDF.
PK
PK
PK
Table 3. Best model type per K and economic aggregate.
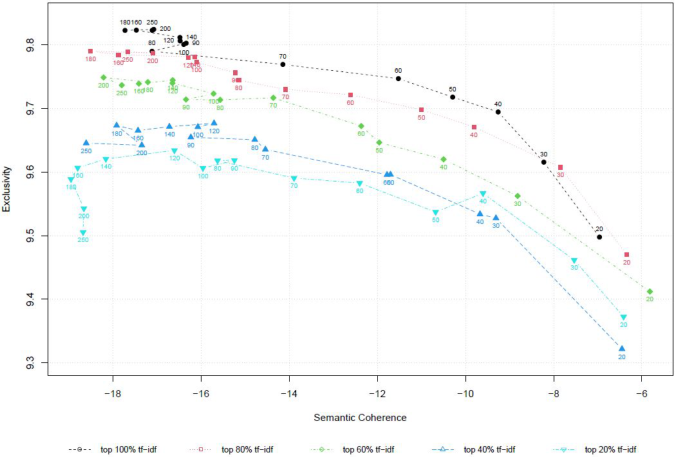
varying from 20 to 250. Exclusivity (Roberts et al., 2014) and semantic cohe- rence (Mimno et al., 2011; Roberts et al., 2014) are the main metrics adopted for evaluation. High exclusivity means that words receiving high probabilities in a specific topic also receive low probability in other topics. High semantic coherence means that the estimated topics are easily interpreted by human
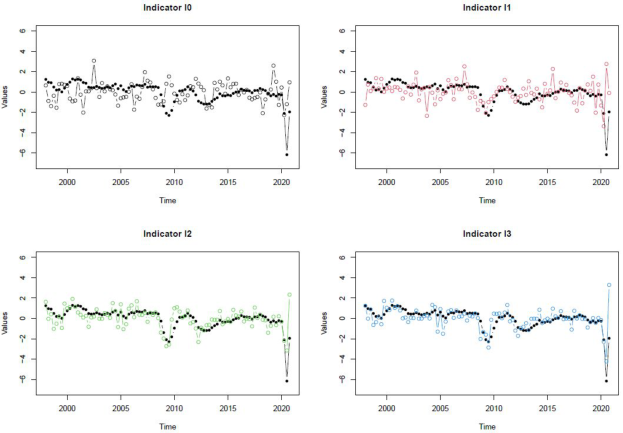
Figure 4: 100% TF-IDF DTM, K = 100 GDP ARX/AR TPDI vs GDP growth rate.
readers. As shown in Figure 2, there is a trade-off between the two. From graphical inspection, we choose K = 100 as the baseline for each of the five DTM as a good compromise between the two measures.
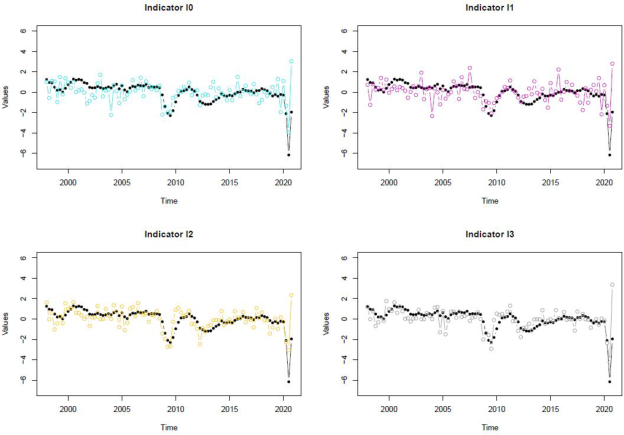
Textual Political Debate Indices (TPDI) To construct the proposed Textual Political Debate Indices (TPDI), we first aggregate the estimated daily topic proportions θ on a quarterly basis to align them with the economic time series. The obtained eθ are the core of each TPDI. Then, to ensure stationarity, we consider the standardized year- on-year logarithmic differences of all economic series. Afterward, we model them with auto-regressive models, AR, (Box and Jenkins, 1970) and auto- regressive with exogenous inputs models, ARX, (Hannan, 1976) as well as time-varying parameters auto-regressive models (Cai, 2007), either with exo- genous terms (TVARX) or without (TVAR). Based on Larsen and Thorsrud (2019), all auto-regressions are of order 1 and each (TV)ARX model inclu- des the lagged values of eθ of one single topic at a time. Hence, for each of the 8 economic aggregates considered, there are 2(K + 1) regressions whose estimation allows us to measure the contribution, bi (in case of ARX) or bi,t (in case of TVARX), of topic i = 1, . . . , K, in explaining the economic variable at hand. Table 2 shows the formulae for the 4 types of TPDI under the time-varying and non-time-varying regression frameworks.
In Table 2, 0 ≤wi, vt ≤1 with i = 1, . . . , K and t = 1, . . . , T are the inter-topics and infra-time normalized weights, respectively. In formu-
weights and R2
i(TV)ARX are the R-squared of the (time-varying) regressions;
Predicting Economic Indicators Using Political Texts 207
Figure 5: 100% TF-IDF DTM, K = 100 GDP TVARX/TVAR TPDI vs GDP growth rate.
bu2
i,t(TV)ARX from the (time-varying) regressions. For each of the 8 economic aggregates, after construction, the 4 types of indices are evaluated by per- forming the Model Confidence Set (MCS) procedure introduced by Hansen, Lunde, and Nason (2011). To check the sensitivity of the indices to the dicti- onary, the overall process of indices construction and evaluation is repeated 5 times: one per each of the DTM previously built. Results are shown in Table 3.
As shown in Figures 4 and 5, which refer to the GDP only, the propo- sed indices are able to closely mimic the dynamic of traditional economic measures.
CONCLUSION
In this work, we derive TPDI: a class of text-based indices to measure eco- nomic activity and capture qualitative information from political debate. Specifically, the proposed indices closely mimic the dynamic of 8 traditio- nal national account statistics. Results are achieved through a topic models analysis of Italian Senate parliamentary reports over about 24 years through a data-driven procedure topics estimation does not rely on a predefined set of words – which is replicable for other languages and Countries. Moreover, differently from traditional measures, the proposed indices may be compu- ted at higher frequencies, hence providing timelier information on current economic dynamics, potentially improving the forecasting accuracy of the state-of-the-art models.
REFERENCES
Adämmer, Philipp and Rainer A. Schüssler (May 2020). “Forecasting the Equity Premium: Mind the News!” In: Review of Finance 24.6, pp. 1313–1355. ISSN: 1572–3097. https://doi.org/10.1093/rof/rfaa007 Angelico, Cristina et al. (Feb. 2021). “Can we measure inflation expectations using
Twitter?”. Bank of Italy, Economic working papers 1318. https://dx.doi.org/10. 2139/ssrn.3827489 Baerg, Nicole and Will Lowe (2020). “A textual Taylor rule: estimating central bank preferences combining topic and scaling methods”. In: Political Science Research and Methods 8.1, pp. 106–122.ISSN: 2049-8470. https://doi.org/10.1017/psrm .2018.31 Banks, George C. et al. (2018). “A Review of Best Practice Recommendations for
Text Analysis in R (and a User-Friendly App)”. In: Journal of Business and Psych- ology 33 (4), pp. 445–459. ISSN: 1573-353X. https://doi.org/10.1007/s10869- 017-9528-3 Blei, David M. and John D. Lafferty (June 2007). “A correlated topic model of Science”. In: Ann. Appl. Stat.1.1, pp. 17–35. https://doi.org/10.1214/07-AOAS 114 Blei, David M., Andrew Y. Ng, and Michael I. Jordan (2003). “Latent Dirichlet
Allocation”. In: J. Mach. Learn. Res.3. Jan, 993–1022. ISSN: 1532-4435 Box, George EP and Gwilym M Jenkins (1970). Time series analysis: forecasting and control. 1st ed. Oakland: Holden-Day Cai, Zongwu (2007). “Trending time-varying coefficient time series models with seri-
ally correlated errors”. In: Journal of Econometrics 136.1, pp. 163–188. ISSN: 0304–4076. https://doi.org/10.1016/j.jeconom.2005.08.004 Cerchiello, Paola, Paolo Giudici, and Giancarlo Nicola (2017). “Twitter data models for bank risk contagion”. In: Neuro computing 264. Machine learning in finance, pp. 50 –56. ISSN: 0925–2312. https://doi.org/10.1016/j.neucom.2016.10.101 Denny, Matthew J. and Arthur Spirling (2018). “Text Preprocessing for Unsupervised
Learning: Why It Matters, When It Misleads, And What To Do About It”. In: Political Analysis 26.2, 168–189. https://doi.org/10.1017/pan.2017.44 Gentzkow, M., Shapiro, J.M., Taddy, M.: Measuring group differences in highdimensional choices: Method and application to congressional speech. Econome- trica87(4), 1307–1340 (2019). https://doi.org/10.3982/ECTA16566 Grimmer, J.: A Bayesian hierarchical topic model for political texts: Measuring
expressed agendas in senate press releases. Political Analysis18(1), 1–35 (2010). https://doi.org/10.1093/pan/mpp034 Hannan, E. J. (1976). “The Identification and Parameterization of Armax and State Space Forms”. In: Econometrica 44.4, pp. 713–723. ISSN: 00129682, 14680262. http://www.jstor.org/stable/1913438 Hansen, Peter R., Asger Lunde, and James M. Nason (2011). “The Model Confi-
dence Set”. In: Econometrica 79.2, pp. 453–497. https://doi.org/10.3982/ECTA 5771 Hansen, Stephen, Michael McMahon, and Andrea Prat (2017). “Transparency and Deliberation Within the FOMC: A Computational Linguistics Approach”. In: The Quarterly Journal of Economics133.2, pp. 801–870. ISSN: 0033–5533. https://do i.org/10.1093/qje/qjx045 Istituto Nazionale di Statistica (n.d.). I.Stat corporate data warehouse. http://dati.ist
at.it/
Predicting Economic Indicators Using Political Texts 209
Larsen, Vegard H. and Leif A. Thorsrud (2019). “The value of news for economic developments”. In: Journal of Econometrics 210.1, pp. 203–218. ISSN: 0304–4076. https://doi.org/10.1016/j.jeconom.2018.11.013 Lüdering, Jochen and Peter Winker (2016). “Forward or Backward Looking? The
Economic Discourse and the Observed Reality”. In: Jahrbücher für Nationa- lökonomie und Statistik 236.4, pp. 483–515. https://doi.org/10.1515/jbnst-2015- 1026 Mimno, David et al. (2011). “Optimizing Semantic Coherence in Topic Models”. In: Proceedings of the 2011 Conference on Empirical Methods in Natural Language Processing. Edinburgh, Scotland, UK.: Association for Computational Linguistics, pp. 262–272. https://www.aclweb.org/anthology/D11-1024 Roberts, Margaret E. et al. (2014). “Structural Topic Models for Open-Ended Survey
Responses”. In: American Journal of Political Science 58.4, pp. 1064–1082. https: //doi.org/10.1111/ajps.12103 “TF–IDF” (2011). In: Sammut C., Webb G.I. (eds) Encyclopedia of Machine Learning. Springer, Boston, MA. https://doi.org/10.1007/978-0-387-30164-8_832 Vayansky, Ike and Sathish A.P. Kumar (2020). “A review of topic modeling meth-
ods”. In: Information Systems 94, p. 101582. ISSN: 0306-4379. https://doi.org/ 10.1016/j.is.2020.101582
LISTED IN THE AHFE DIGITAL BOOKSTORE CATALOGUE
Explore the complete digital volume
The Human Side of Service Engineering
Read this individual research paper free through the original publisher, or explore the full digital proceedings book.
ISBN 978-1-958651-38-4
Explore this ISBN in the AHFE Bookstore ↗Listed in the July 2026 bookstore catalogue; search by ISBN to confirm current availability · Digital book purchase optional