Yeok Tatt Cheah, Ka Wing Frances Wan, Joanne Yip (2022). Prediction of Muscle Fatigue During Dynamic Exercises based on Surface Electromyography Signals Using Gaussian Classifier. In: Physical Ergonomics and Human Factors. AHFE Open Access, vol. 63, pp. 62–70. https://doi.org/10.54941/ahfe1002597
Muscle fatigue is shown to be associated with incidence of musculoskeletal injuries found with sports training and competition. The real-time detection of fatigue onset allows preventative measures to be taken in time to minimize injuries. In this paper, we aim to provide a framework that classifies muscle fatigue based on surface electromyography (sEMG) features extracted during dynamic exercises. This includes the use of data segmentation, real-time-compatible data normalization, a principal component analysis (PCA) based feature reduction and Gaussian classifier methods.An experiment has been carried out to acquire the sEMG signals of the upper two pairs of rectus abdominis muscles of four healthy adult volunteers during weighted decline and bench-assisted sit-ups. The collected sEMG signals are then segmented into concentric and eccentric segments by using the inertial measurement unit (IMU) data. Eight commonly used sEMG features are extracted from each segment. We fit two Gaussian models (GMs) on the distribution of fatigued and non-fatigued data samples and show that the GM can utilize this information to predict the number of repetitions possible before task failure. We fit another set of GM on a reduced feature space by projecting the data onto principal component axes obtained through singular value decomposition (SVD). By projecting the features onto the first two principal axes, we achieve similar accuracy and f1-scores compared to the GM by using 6 handpicked features. This reduction in the feature space greatly reduces the training samples necessary for such class-imbalanced datasets. This classifier can also be directly used in the real-time detection of muscle fatigue during dynamic movements, which can be adopted in applications in sports, workplaces, and rehabilitation sciences. These frequency-time characteristics also provide insight into the function of low-level feature extractors when developing deep learning models to identify muscle fatigue.
Analyzing signals during dynamic contractions is an important avenue for research as many injury-prone movements are dynamic in nature. Although most research has focused on signals collected during isometric contractions,
Prediction of Muscle Fatigue During Dynamic Exercises 63
scholars have shown that proper segmentation methods between the concen- tric and eccentric phases are promising to isolate the differences in dynamic movements.
While scholars have found various time, frequency and time-frequency domains, entropy-based features, and autoregression-based features to be useful in various situations (Cifrek et al., 2009), the feature selection pro- cess for specific applications is mostly obtained through experimentation. Among the most widely studied muscle fatigue indicators are the decreasing trend of the median frequency (MDF) and increasing trend of the mean abso- lute value (MAV) of surface electromyography (sEMG) signals respectively. Although the decreasing trend is consistent, there is large variance regarding the value and scale of the MAV and MDF values between subjects and trials, which renders them incomparable between exercise sessions without proper normalization methods. This may be the reason why we cannot find studies on real-time classifiers based on the MDF and MAV despite their popularity in statistical analyses.
As for multivariate classifiers, researchers have attempted to extract mul- tiple features from a single sEMG channel to perform multivariate classifica- tion of muscle fatigue (Macisaac et al., 2006, Rogers and Macisaac, 2010). Research in this direction is motivated by the variability in conventional fatigue factors due to non-fatigue factors.
In sEMG, the principal component analysis (PCA) is used to integrate fea- tures extracted from multiple channels of sEMG data collected from different muscles to reduce the total number of features, which has been used in work on gesture recognition (Geethanjali, 2015, Qi et al., 2020) to correlate per- turbations within the sEMG signals of specific events (Yang et al., 2005) More recently, PCA has also been used on signals collected from high-density electrodes that decompose highly correlated sEMG signals from the same muscle into individual motor unit action potentials (MUAPs) (Naik et al., 2016, Staudenmann et al., 2006). Similar to our usage though is the use of the PCA to identify the correlations of sEMG features that are potential indi- cators of fatigue during dynamic movements (Rogers and Macisaac, 2011). In cases where there are few training samples, the PCA is especially important in training statistical classifiers such as the Gaussian model (GM), where the number of features used for classification dictates the minimum class sample size used during training (Gopinath, 1998). This requirement for a minimum class sample size is exemplified by the class imbalanced nature of sports scie- nce related topics, where training samples for classes such as ‘task failure’ or ‘muscle injury’ are much rarer compared to other class samples. In this study, our aim is to establish the framework necessary to perform real-time muscle fatigue detection for dynamic exercises with little training data.
METHODS
Participants Four (4) female adults, (age: 26.5 ± 3.1 yrs old; height: 164.8 ± 5.7 cm; and weight: 59.3 ± 10.6 kg) who had given informed consent participated in the experiment. The inclusion criteria were to be between 19 - 30 years of
age, with a body mass index (BMI) below 25, and physically fit for exercise according to a pre-exercise screening tool (ESSA, Fitness Australia, and Sports Medicine Australia, 2011). The experiment was approved by the Institutional Review Board of The Hong Kong Polytechnic University.
Experiment Protocol All of the subjects learned the correct forms of the decline sit-up prior to the test. Under the guidance of a qualified personal trainer, the four subje- cts performed weighted decline sit-ups on a workout bench (30° decline). By holding different weighted dumbbells at the shoulder level, load was added to the upper part of the body throughout the exercise. Subjects 1 to 3 were required to complete 10 repetitions. The weights were adjusted between exe- rcise sets by the personal trainer to ensure that the subjects are close to task failure at the end of each exercise set. Subject 4 was required to repeat the exercise until she could no longer complete a cycle (task failure).
The sEMG signals of both sides of the upper rectus abdominis were recor- ded by using two Noraxon Ultium® EMG sensors at a sampling rate of 2000 Hz. A pair of electrodes (3M Red Dot 2228) were placed 2 cm apart on the upper rectus abdominis parallel to the direction of the muscle fibre. The trunk angle was also recorded at a sampling rate of 200 Hz by using inertial measurement units (IMUs) embedded in the Ultium® EMG sensors.
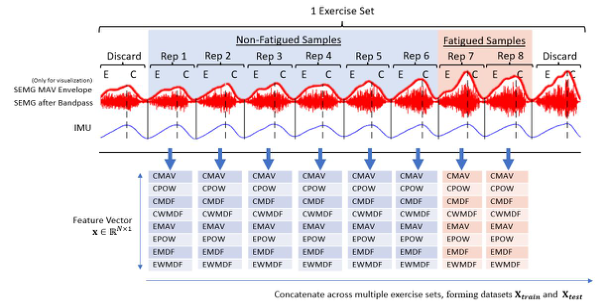
Data Pre-Processing, Segmentation and Feature Extraction All of the raw sEMG data were processed with a bandpass filter of [20, 500] Hz, and then segmented into abdominal flexion (concentric) and extension (eccentric) phases of individual repetitions according to the IMU readings. Following the rotational movement of the torso during a sit-up repetition, the accelerometer readings reached the minimum at full abdo- minal extension, where the trunk was almost horizontal, and attained the highest values at full abdominal flexion. IMU readings are used because it was observed that local peaks and minimums of the amplitude of the sEMG envelope do not necessarily correspond to the movement phases, especially when the participants were fatigued. After segmentation, the first and last repetitions of each exercise set were discarded to minimize variations unrela- ted to muscle fatigue. From each concentric and eccentric segment, 4 features were extracted: the MAV, power, Fourier-based MDF and wavelet-based MDF (WMDF). Features from the concentric and eccentric segments were then concatenated vertically to form a feature vector representative of the repetition, x ∈RN×1. This process is illustrated in Figure 1.
Training and Testing Dataset Split Within each set of exercises, the last 20% of repetitions (rounded upwards) for each subject within every set was labelled as the ‘fatigued’ samples and all other samples were labelled as the ‘non-fatigued’ samples. Feature vectors extracted from all exercise sets were concatenated horizontally to form the training dataset Xtrain ∈Rn×m and testing dataset Xtest ∈Rn×k, where the ratio of the training to testing samples is 8 to 2. The resulting datasets are shown in Table 1.
Prediction of Muscle Fatigue During Dynamic Exercises 65
Figure 1: Segmentation and feature extraction.Table 1. Training and testing sample size.
Normalization of Interset Features Within Training Dataset Although features may show consistent trends, they are not comparable between sets. To compare between sets, we normalize the features of each repetition within an exercise set according to the mean and variance of the exercise set. This is a trivial step for the training dataset, where the mean and variance of the exercise set are known as all data from all repetitions within an exercise set are already collected. However, for the testing dataset (as well as any real time applications), we do not have data beyond the current repeti- tion and cannot directly calculate the mean and variance of the entire exercise. To perform real time classification, we must estimate the mean and variance of all the repetitions within an exercise set upon measuring the features of the first few repetitions. Hence, we propose a simple method to estimate the mean and variance of feature i within any exercise set by using the value of the first feature xi,1. Treating each feature xi within feature vector x as an independent random variable, we perform linear regression to approximate the linear relationship between the value of the feature in the first rep xi,1 and the mean and variance of every exercise set within the training dataset. The resulting linear relationship is represented by a linear term m and an intercept term c , which can then be used to calculate the estimated mean µ and estimated variance σ 2, given the values of the first repetition of a feature. The linear relationship can be modeled as follows.
mi,1,µ
ci,1,µ
Equations and mathematical formulas are available in the original paper PDF.
xi,1 xi,1
σ 2i
ci,1,σ 2
mi,1,σ 2
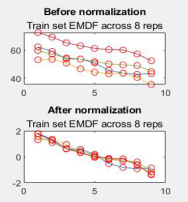
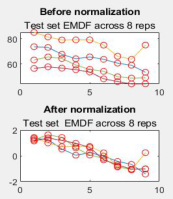
The result of this method is illustrated in Figures 2 and 3.
Figure 2: Normalization of training set using known mean and variance of set.Figure 3: Normalization of testing set using estimated mean and variance of set.
Gaussian Model Estimation We assume that for each subject for each class, feature i extracted from each segment x can be modelled as a continuous random variable represented as
xi = E [xi] + ε, where ε ∼N(0, σ 2) Multiple features within a feature vector of length N then have a mean vector µ and covariance matrix σ 2 such that
h
PN
(xi −E [xi]) (xi −E [xi])Ti
µ=E [x] = 1 N For each subject, two GMs are fitted for class Cf for fatigued muscle signals, and class Cn for non-fatigued muscle signals.
Gaussian Classifier The likelihood for each class given measurement x for the Gaussian distributions is:
2
P
Cf| x
where µf , σ f 2 and µn, σ n2 are the mean vector and covariance matrix for the fatigued and non-fatigued muscles respectively.
Prediction of Muscle Fatigue During Dynamic Exercises 67
Hence the posterior probability of the fatigued muscles is
P p Cf
x; µf , σ f 2
P Cf
Equations and mathematical formulas are available in the original paper PDF.
p
+ P (Cn) p
x; µn, σ n2
x; µf , σ f 2
where P Cf
and P (Cn) are the prior probability for the fatigued and non- fatigued muscles respectively.
Given our definition of fatigue as the last 20% of repetitions possible by the subject, we can simplify the posterior probability as
x; µf , σ f 2
P Cf
+ 8 p
x; µn, σ n2
x; µf , σ f 2
Given that our case is a binary classification problem, the expectation maximization problem takes the form of
Fatigued if P
Cf | x
x is
> P (Cn | x) Not Fatigued otherwise Principal Component Analysis and Feature Reduction
The singular value decomposition (SVD) is a method of approximating the factors of a matrix into the product of three matrices by expressing an m-by-n matrix X as
where U and V are the unitary matrices and 6 a diagonal matrix that contains the singular values on its diagonal. We transpose our normalized training and testing dataset to the form of XtrainT ∈Rn×m and XtestT ∈Rn×k. Then we perform a support vector machine (SVM) to the training set, which already fulfils the requirements of a zero mean input matrix with normalized units. After performing an SVD, we project both the training and testing datasets onto all eight principal axes by multiplying the right unitary matrix V∈Rn×n by the training and testing datasets such that
Within this projected feature space, we train and evaluate another set of GMs on the first n-dimensions. Classification results that yield similar or better results in terms of accuracy and f1-scores represent a success in feature reduction.
EXPERIMENT RESULTS AND DISCUSSION First, we performed experiments to manually search for the best perfor- ming combination of features, the results of which we used as the baseline (Table 1). When only using 2 features for classification, we find that power
Table 2. Results of various feature combinations. The average of the F1 scores, weighted according to the number of samples within the dataset, is used as the metric for evaluation. Best f1-score using 2, 4, 6 and 8 features is bolded.
6 all except pow 0.630 0.571 0.651 0.857 0.653 8 all 0.625 0.333 0.578 0.667 0.582
Table 3. Comparing f1-scores of Gaussian classifiers trained on original feature space (best combi- nation selected), and projected feature space obtained from PCA.
during the concentric and eccentric phases (cpow and epow respectively) per- forms the worst. We further experiment with 4 and 6 feature combinations, and find that the best performing feature combination is using the MAV, MDF and WMDF from both the concentric and eccentric phases, which achieves an average F1 score of 0.65 across the 4 subjects.
We proceed to project the features onto the first n principal component axes and train a Gaussian classifier on this projected feature space, the performance of which is compared with the best results from the previous experiment (Table 2). Unsurprisingly, the best performance still belongs to the 6-feature combination from the original feature space, which was obtained by manually searching for the best performing feature through experimentation. However, 2-dimensional and 6-dimensional GMs trained on the projected feature space obtained through the PCA also achieve very similar results.
The ability to reduce the dimensionality of the feature space is an important consideration when training statistical classification models, as the number of dimensions used for classification directly influences the number of trai- ning samples needed. Our results show that by using PCA, we can reduce the feature space from 6 to 2 dimensions and achieve similar results. When we
Prediction of Muscle Fatigue During Dynamic Exercises 69
consider 2-dimensional feature spaces, the PCA yields a significant impro- vement over even the best results from the original feature space, as the PCA allows data on higher dimensions to be projected onto the 2-dimensions and used for classification. Furthermore, these results show that our propo- sed method of estimating the mean and variance for real-time normalization can yield reasonable results for Gaussian classifiers, regardless of the feature space used.
Limitation It is important to note that our dataset size is small and drawn from a specific demographic, namely young female adults with a similar BMI. Additionally, exercise sets where signals have high noise are discarded to ensure that our dataset is as clean as possible. Lastly, our methodology has only been applied to the rectus abdominus muscles only during one type of exercise.
CONCLUSION
In this paper, we have outlined the framework necessary to perform real- time muscle fatigue detection for dynamic exercises with little training data. We tackle the non-stationarity of dynamic movements by segmenting move- ments into concentric and eccentric segments. We normalize data so data can be compared between sets. To normalize our test dataset without ‘future data’, we exploit the linear relationship between the first set and the mean and variance of the entire set. We then outline the assumptions of gaussian models and the decision rules of the Gaussian classifiers. Lastly, we use Princi- pal Component Analysis for feature reduction in conjunction with Gaussian classifiers to achieve reasonable F1-scores.
ACKNOWLEDGMENT
This work is supported by funding from the Innovation and Technology Fund – Innovation and Technology Support Programme – Tier 3 granted to the Hong Kong Polytechnic University (ITS/042/20).
REFERENCES
Cifrek, M., Medved, V., Tonkovi´c, S. & Ostoji´c, S. (2009). Surface EMG based muscle fatigue evaluation in biomechanics. Clinical Biomechanics, 24, 327–340. Geethanjali, P. (2015). Comparative study of PCA in classification of multichan-
nel EMG signals. Australasian Physical & Engineering Sciences in Medicine, 38, 331–343. Gopinath, R. A. Maximum likelihood modeling with Gaussian distributions for classification. Proceedings of the 1998 IEEE International Conference on Acoustics, Speech and Signal Processing, ICASSP ’98 (Cat. No.98CH36181), 15–15 May 1998 1998. 661-664 vol.2. Macisaac, D. T., Parker, P. A., Englehart, K. B. & Rogers, D. R. (2006). Fatigue Esti-
mation With a Multivariable Myoelectric Mapping Function. IEEE Transactions on Biomedical Engineering, 53, 694–700.
Naik, G. R., Selvan, S. E., Gobbo, M., Acharyya, A. & Nguyen, H. T. (2016). Principal Component Analysis Applied to Surface Electromyography: A Comprehensive Review. IEEE Access, 4, 4025–4037. Qi, J., Jiang, G., Li, G., Sun, Y. & Tao, B. (2020). Surface EMG hand gesture reco-
gnition system based on PCA and GRNN. Neural Computing and Applications, 32, 6343–6351. Rogers, D. R. & Macisaac, D. T. (2010). Training a multivariable myoelectric mapping function to estimate fatigue. Journal of Electromyography and Kinesiology, 20, 953–960. Rogers, D. R. & Macisaac, D. T. (2011). EMG-based muscle fatigue assessment
during dynamic contractions using principal component analysis. Journal of Electromyography and Kinesiology, 21, 811–818. Staudenmann, D., Kingma, I., Daffertshofer, A., Stegeman, D. F. & Vandieen, J. H.
(2006). Improving EMG-Based Muscle Force Estimation by Using a High-Density EMG Grid and Principal Component Analysis. IEEE Transactions on Biomedical Engineering, 53, 712-719. Yang, J., Jin, D., Wang, R., Zhang, J., Ji, L., Fang, X. & Zhou, D. The Investigation on sEMG of Lower Extremity When a Slip Occurs in Level Walking. 2005 IEEE Engineering in Medicine and Biology 27th Annual Conference, 17–18 Jan. 2006 2005. 5934–5937.
LISTED IN THE AHFE DIGITAL BOOKSTORE CATALOGUE
Explore the complete digital volume
Physical Ergonomics and Human Factors
Read this individual research paper free through the original publisher, or explore the full digital proceedings book.
ISBN 978-1-958651-39-1
Explore this ISBN in the AHFE Bookstore ↗Listed in the July 2026 bookstore catalogue; search by ISBN to confirm current availability · Digital book purchase optional