Technology in the modern age is used in various sectors, particularly screen technology, usually in many everyday devices such as smartphones, personal computers, tablets, and smartwatches. Most of the consumer products used in this current age have a screen interface and are abundantly distributed to the public. This study investigated the connection between the rapid availability of digital screen devices and vision problems in young adults. One hundred and two students and twelve vision care experts participated in the study. Results revealed that about 59% of the students experienced a worse vision from 2015 to late 2021. About 73% of these student respondents affirmed using a smartphone as the primary digital screen device for 5-6 hours daily, and 37% confirmed to have experienced eye dryness and irritation during COVID-19. Vision care experts confirmed treating many young adult patients with vision-related issues in the past five years compared with a decade ago. About 58% of the vision experts believe blue light filters will reduce visual degradation when over exposed to digital screens. This area of study needs empirical research to ascertain other health hazards associated with the new technology evolving in our daily activities.
Technology remains one of the most remarkable interventions in human history. It is usually adopted based on its benefits to society. Historically, there has been a constant playoff between societal necessity and suppres- sion, from the telegraph and the telephone to computers and their varied applications. However, the benefits that technology offers must outweigh the associated risks before it could fully be accepted into the society, thus it acce- ptance necessitate the need for various researches on its health implications. According to Winston, new technologies are accepted into society as far as the potential of the technologies does not significantly have a negative impact on daily living (Winston, 2002). Thus, screen technology keeps evolving rapidly with a prolific impact on our daily lives. We only need to ask ourselves about the benefits of this fast-growing technology on human health.
Several studies have examined the varied impact of screen technology on human organ functionality. Mineshita et al. (2021) observed that both timing and length of exposure to screen technology in school children are associated
with obesity, dry eyes, and poor academic performance. Epidemiological data and analyses of over 3,000 adults in the U.S. revealed that spending more than 6 hours a day watching TV and/or computer use is associated with the inci- dence of moderate to severe depression (Madhav et al., 2017). More studies on the effect of screen technology on human behaviors revealed that addi- ctive usage of cell phones significantly contributed to poor family interaction (Fasanya et al., 2021). Other negative impacts of longer screen time include digital eye strain, mental issues, and psychological imbalances (Wu et al., 2016). A study by Coles-brennan et al. (2019) showed that individuals who spent more time looking at the screens of devices like smartphones are likely to experience the adverse effects of blue light. Recent research findings repor- ted the damage blue light could cause on a user’s retinal cells (Coles-brennan et al., 2019).
The progress of technology is quite evident with the concept of touch screen devices, such as those found in televisions, smartphones, tablets, and smartwatches. In addition, the application of touch screens technology has been proven highly relevant in car navigation displays, restaurants and fast- food places, billboards, and retail stores. From the first TV built in 1934 in Germany to today’s contemporary smartphones and smartwatches, digi- tal device usage has grown astronomically across all age groups (Bridgeman et al., 2003).
Digital screens are now universally available. No other human organ feels the impact other than the eyes. Almost all the time and without effort, seeing occurs as the simplest task for the eyes, except when one is trying to stay awake while battling the burden of sleep. In their 2017 study, Bogd˘anici et al. findings revealed a positive relationship between the average daily use of different gadgets, such as laptops and mobile phones, and Computer Vision Syndrome (CVS). This syndrome represents a group of visual and extraocular symptoms associated with sustained use of visual display terminals. Some of the frequent manifestations due to the long-time use of these gadgets include headaches, blurred vision, and ocular congestion (Bogd˘anici et al., 2017). Through the generation spectrum, various devices that aid human life in day- to-day activities have gained significance. In 2021, smartphone ownership surpassed all other screen devices (Johnson, 2022). Johnson reported in his findings, on average, about 90% of the adults in the United States of America own a smartphone; followed by desktop or laptop computers ownership of 76%; 41% owned tablet devices; 38% owned connected television, and 31% of the population has either work laptop or desktop (Johnson, 2022). Internet availability has been directly linked to screen technology usage. As smart- phones and other internet-connected devices become predominant, Johnson (2022) reported that 31% of U.S. adults go online “almost every time,” and online access increased from 21% to 31% in 2015. Another study revealed about 85% of Americans reported going online daily, 48% used screen devi- ces several times a day, and 6% only about once a day. The study revealed 18- to 29-years-old as the primary screen technology users, which amounted to 48% of the U.S. adult population (Perrin & Atske, 2021).
Digital screens dominate our visual reading, and possibly anyone who is trying to read this paper might likely be reading it on a digital device. In the
Technology and Young Adult Visual Acuity Degradation Symptoms 35
previous decades, the global sales of smartphones were not this high. The number of smartphone units sold worldwide in 2007 was about 122 million. Later in 2011, the sale rose to an average of 472 million, and in 2013 it was about 970 million; in 2014, it was 1,245 million; in 2015, it was 1,424 million, with the highest in 2018 with 1,556 million units sold (Lin & Brown, 2007). Individuals who spend more time looking at the screens of devices like smartphones are likely to experience the adverse effects of blue light. Manufacturers of devices such as computers, smartphones, tablets, and flat- screen televisions use light-emitting diode (LED) technologies that cause the devices to emit high amounts of blue light (Lawrenson et al., 2017). However, research findings have suggested the negative impact of blue light on a user’s retinal cells (Coles-brennan et al., 2019). The importance of human eye health cannot be underemphasized, and it reflects the mood and the well-being of humans (Daniels, 2014). In addition to the pertinent burden on visual acuity due to technological advancement and the proliferation of screen usage, the COVID-19 pandemic resulted in significant lifestyle changes in most aspects of individual lives (Zwanka & Buff, 2021).
Alabdulkader (2021) recommended in his findings that Ophthalmologi- sts and other eye-care specialists should educate patients on the benefits of limiting screen time, which is associated with the increased use of digital devices during the COVID-19 pandemic. The researcher linked the clinical relevance of the increase in digital eye strain symptoms with home isola- tion and social distancing caused by the COVID-19 pandemic (Alabdulkader, 2021). Undoubtedly, many children and young adults screen time increa- sed during the pandemic, and the only worries in our society were lack of physical activities, loneliness, and sociological gaps. Many failed to consider other aspects of human health that the new ‘normal’ might affect, such as visual degradation and other health impacts. Therefore, this study investiga- ted the effect of technology screen time exposure to the young adults (18–30 years) eyes on visual degradation. More emphasis on the period when young adults felt their vision had grown worse, the common symptoms they suf- fered from, and what suggestions eye specialists encourage to alleviate the identified symptoms.
The objectives of this study are as follows:
1. Developed surveys to gather vision-related issues from young adults for data analysis. 2. Conducted vision-expert interview questionnaire on associated eye- problems symptoms. 3. Reviewed more relevant literature on the use of screen technology and its healthcare implications. 4. Analyzed the data and drew conclusions.
METHODOLOGY
Participants and Procedure The systematic approach used for data collection in this study is a subjective method and interview with vision experts. The study included young adults
Table 1. Respondents demographic information.
Table available in the original PDF paper.
Age-Group Student Respondents F M Total 18-24 33 19 52 25-30 35 15 50 Total 68 34 102
within the age range of 18-30 years at one university in Northwest Indiana who wore prescription eyeglasses and vision experts in the same city. Two hundred surveys were distributed and 60% (102) were completed and retur- ned. Only 15% of the completed surveys failed to meet the required criteria. Required criteria for participation are young adults aged 18-30, prescribed eyeglasses users between 2015 and 2021, and university students where the survey was carried out. The sample size of 102 students included 67% female, 33% male, with 51% distribution for the 18–24 age group and 49% in the 20–30 age group, respectively. Twenty-five vision experts were visited, only thirteen responded, and about 8% of the returned survey was rejected for not meeting the requirements. Vision experts include 84% female and 16%, male. Table 1 shows the detailed demographic information of the student respondents and vision experts.
Criteria were stated in the introduction section of the survey. The que- stionnaire for this study was designed from standardized questions adopted online and was given to a human factor specialist who reviewed the contents for consistency and validation. University Institution Review Board (IRB) reviewed all subject documents and approved for participants privacy and research appropriateness. The survey was distributed using two methods; one-on-one interaction and online. The online survey was developed using Qualtrics and emailed the link to all potential participants. The vision expert interview questionnaire was developed by consulting eye care professionals. The expert survey was created in Microsoft Office Word 2016 version and was presented in person to the eye professionals in Northwest Indiana. The vision expert survey and interview took approximately two months, and the students’ survey took about one and half months before data compilation. Questions on the student survey were in the form of “Yes or No” options, while the vision experts were in Likert scale format.
DATA ANALYSIS AND RESULTS Online data through Qualtrics were compiled with the manually collected data using the Microsoft Excel 2016 version. In the student’s survey, the highest number of digital screen devices owned by an individual was three (3) device types. Only 15% of the respondents owned more than five (5) devices;
Technology and Young Adult Visual Acuity Degradation Symptoms 37
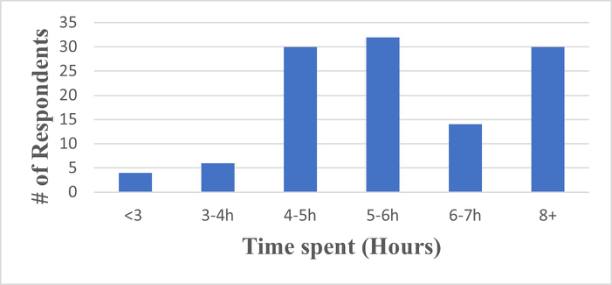
Figure 1: Respondents digital screens time exposure.
the primary devices used were smartphones, laptops, and desktops. Students affirmed spending approximately 47% of their screen time on social media and only 37% on school work. Interestingly, only 11% of the respondents spent time playing video games, and 5% listened to recorded class lectures. Figure 1 details the time range spent by the students on a digital screen on a daily basis.
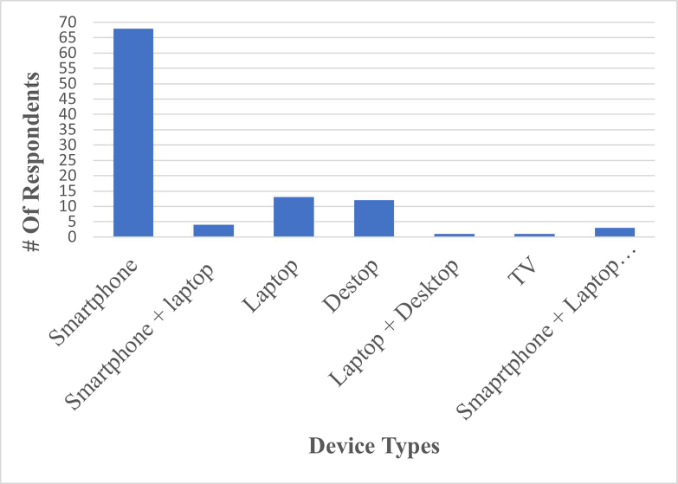
Results further reveal that nearly 63% of the student respondents reported using prescribed glasses as far back as between 6 to 8 years or over ten years. Seventeen percent (17%) of the student respondents reported 4 to 6 years, and 13% affirmed to have been using eyeglasses for 2 to 4 years. Only 3% of the student respondents reported using eyeglasses for less than one year. However, 3% of the respondents were unsure when they became dependent on eyeglasses or lenses for their vision issues. Surprisingly, 73% of the student respondents used smartphones for all activities. Figure 2 details the devices reported by the respondents.
Further, the student results indicate a positive relationship between increa- sed screen time exposure and respondent’s eye symptoms. Fifty-nine percent (59%) of the student respondents experienced a worse vision from 2015 to late 2021. Among all the symptoms identified by the student respondents are headache, eye dryness and irritation, eye tearing, eye pain symptoms, heavy eyelids, eye redness, itching and double vision, and burning of the eye. Headache was recorded as the most common one, which amounted to 53%, followed by eye dryness and irritation 37%. Eye tearing and eye pain symptoms were reported by 22% of the student respondents. In all, 57% indi- cated adverse effects of the screen time exposures on their eye effectiveness and complained of acuity degradation. Respondents also recorded burning of the eyes as another symptom commonly experienced. Increased sensiti- vity to light is the symptom reported by 18% of the respondents, while 16% reported heavy eyelids, and nearly 14% complained eye redness due to lack of sleep at night or increased screen time. About 12% of the student respon- dents reported blinking more excessively than usual due to increased screen time exposure, and 10% complained of sight degradation during long time
Figure 2: Device types.
screen exposure. Itching and double vision were reported by 5% of the stu- dent respondents, and 3% of the student respondents experienced colored halos around the objects.
Thirty-six (36%) of the student respondents affirmed to be diagnosed with nearsightedness (Myopia) and 30% were diagnosed with long-sightedness (Hyperopia). Approximately 37% of the student respondents were neither sure nor had no information about their diagnosis. Of the 102 student respon- dents, 45% marked other options which were not mentioned in the list of the options. Nearly 40% of student respondents suggested that users take a break from screens time per day and 13% of student respondents suggested using blue light.
One hundred percent of the vision experts agreed that the number of young adults who visited for a consultation in the past five years had increased exponentially. About 75% of the experts affirmed that the majority of the new patients are 30 years of age and below. The common patient complaints identified by the vision experts include eye tearing, redness, headache, itch- ing, sensitivity to light, and burning symptoms. According to 75% of the vision experts, patients who complained most about the symptoms spent on average 4 hours and higher minimum on a digital screen daily. All the vision experts affirmed that many who spent more time on screen devices, especi- ally smaller screens such as smartphones, visited for visual consultation more with the eyeglasses. About 58% of the vision experts believe blue light filters will reduce visual degradation while overtly exposed to digital screens. How- ever, the remaining 42% report contradicted the belief and advised for total abstinence from long-term digital screen exposure. One of the vision experts
Technology and Young Adult Visual Acuity Degradation Symptoms 39
suggested blue blocking anti-reflective treatments and small reading powers. In agreement with the survey report, all vision experts concluded that the screen technology had increased the number of people who visit for visual degradation consultation.
DISCUSSIONS The findings from this study clearly show that the increased availability of digital technology with its usage has contributed to visual degradation among young adults. About 59% of the entire student respondents felt acuity degra- dation in their visual effectiveness when their screen time exposure increased. This finding agreed with (Bogd˘anici et al., 2003), who found a positive rela- tionship between the average daily use of different digital screen devices and Computer Vision Syndrome (CVS). However, 16% of this 59% student respondents ascribed their eye symptoms to lack of sleep at night and not on the screen exposure time. The more significant percentage of respondents who used smartphones primarily for their daily activities supported John- son’s (2022) findings, who concluded that about 90% of the adults in the United States of America own a smartphone. The student respondents indi- cated redness and eye irritation as parts of the symptoms noticed when their screen exposure time increased, which agreed with Wu et al., 2016 findings. Findings on time spent on the digital screen are not surprising. In 2018, Ride- out, Foehr, and Roberts reported that, on average, an American adult spent between 2 and 12 hours on a digital screen on a daily basis. Many complaints of Myopia (shortsightedness, or inability to see things at long distance) were also supported by the vision expert report as one of the main complaints of their patients. In fact, this finding agreed with one of Zhong-Lin, 2021 fin- dings on the children during the pandemic lockdown. Indeed, the screen size, the letter, and the background of smartphones could add to the challenging experience that force users to work harder while reading on smartphones. This might have increased the extent to which respondents have experienced eye itching and irritation, as well as redness during a long period of screen exposure. The researcher has concluded on visual degradation experienced by people due to improper treatment and management of Myopia and Hype- ropia; thus the complaints of the respondents and the vision experts aligned with this finding.
CONCLUSION
Overall, there is enough evidence that long-time screen exposure increases human visual acuity degradation. The current findings suggest that the results of the association between digital screen longtime exposure and visual degra- dation in young adults increased as the technology evolved. Findings from this study were based on subjective opinion and revealed a significantly nega- tive association between screen exposure time and visual acuity degradation. Although subjective measure is not an accurate means of measuring visual degradation, there is an element of truth measurement from individual opi- nion. This study also gathered information from vision experts and concluded
that, certainly, technology evolution has increased people’s screen exposure time and has contributed to visual acuity degradation in young adults.
The rapid increase in digital screen use by young adults over the past decade and during the pandemic require further research to understand the impact of the increase in technology and screen exposure time on young adults’ health and well-being, particularly in relation to visual acuity degrada- tion. Given the impacts of technology screen exposure time on young adults’ visual degradation outlined in this study, it is encouraged that screen expo- sure time should be decreased, and young adults to increase their physical eye check on an annual basis with their vision experts.
ACKNOWLEDGMENT
The authors would like to acknowledge all students and vision experts who participated in the study as well as the University for sponsoring the study with grant awards.
REFERENCES
Alabdulkader, B. Effect of digital device use during COVID-19 on digital eye strain. Clinical and Experimental Optometry, 104(6), 698-704 (2021). https://doi.org/10.1080/08164622.2021.1878843 Bogd˘anici, C. M., S˘andulache, D. E., & Nechita, C. A. Eyesight quality and Computer Vision Syndrome. Rom J Ophthalmol, 61(2), 112-116 (2017). https://doi.org/10.22336/rjo.2017.21 Bridgeman, B., Lennon, M. L., & Jackenthal, A. Effects of Screen Size, Screen Resolution, and Display Rate on Computer-Based Test Perfor- mance. Applied Measurement in Education, 16(3), 191–205 (2003). https://doi.org/10.1207/S15324818AME1603_2 Coles-brennan, C., Sulley, A., & Young, G. (2019). Management of digi- tal eye strain. Clinical and Experimental Optometry, 102(1), 18–29 (2019). https://doi.org/10.1111/cxo.12798 Daniels, P. Real eyes: The importance of your vision. MSU College of Agriculture and Natural Resources (2014). https://www.canr.msu.edu/news/real_eyes_the_importance_of_your_vision Fasanya, Bankole K., Karen T. Abad, and Temilade R. Adeyeye. “Addictive Cell
Phone Usage: Impacts on Family Interaction During COVID-19 Pandemic.” In International Conference on Applied Human Factors and Ergonomics, pp. 643– 650. Springer, Cham, 2021. https://doi.org/10.1007/978-3-030-80744-3_80 Johnson, J. US devices used to access the internet 2022. Statista. https://www.statista.com/statistics/1290925/internet-access-by-device-us/ Lawrenson, J. G., Hull, C. C., & Downie, L. E. The effect of blue-light blocking spectacle lenses on visual performance, macular health and the sleep-wake cycle: A systematic review of the literature. Ophthalmic Physiol Opt, 37(6), 644–654 (2017). https://doi.org/10.1111/opo.12406 Li, Q., & The 2019-nCoV Outbreak Joint Field Epidemiology Investigation
Team. (2021). An Outbreak of NCIP (2019-nCoV) Infection in China — Wuhan, Hubei Province, 2019–2020. China CDC Weekly, 2(5), 79-80. https://www.ncbi.nlm.nih.gov/pmc/articles/PMC8393104/ Lin, P. P., & Brown, K. F. Smartphones Provide New Capabilities for Mobile Professionals. The CPA Journal, 77(5), 66–71(2007).
Technology and Young Adult Visual Acuity Degradation Symptoms 41
Madhav, K. C., Sherchand, S. P., & Sherchan, S. Association between screen time and depression among US adults. Precision Medicine Reports, 8, 67–71 (2017). https://doi.org/10.1016/j.pmedr.2017.08.005 Mineshita, Y., Hyeon-Ki, K., Chijiki, H., Nanba, T., Shinto, T., Furuhashi, S.,
Oneda, S., Kuwahara, M., Suwama, A., & Shibata, S. Screen time dura- tion and timing: Effects on obesity, physical activity, dry eyes, and learning ability in elementary school children. BMC Public Health, 21, 422 (2021). https://doi.org/10.1186/s12889-021-10484-7 Moss, P., Barlow, G., Easom, N., Lillie, P., & Samson, A. Lessons for managing high-consequence infections from first COVID-19 cases in the UK. The Lancet, 395(10227), E46 (2020). https://doi.org/10.1016/S0140-6736(20)30463-3 Perrin, A., & Atske, S. 31% of American adults are online almost constantly.
Pew Research Center (2021, March 26). https://www.pewresearch.org/fact- tank/2021/03/26/about-three-in-ten-u-s-adults-say-they-are-almost-constantly- online/ Pew Research Center. Demographics of Mobile Device Ownership and Adoption in the United States. Pew Research Center (2021, April 7). https://www.pewresearch.org/internet/fact-sheet/mobile/ Rideout VJ, Foehr UG, Roberts DF. Generation M 2: Media in the Lives of 8- to 18-Year-Olds. Henry J Kaiser Family Foundation. 2010. Avail-able from: https: //files.eric.ed.gov/fulltext/ED527859.pdf (Accessed September 11, 2018). Thunström, L., Ashworth, M., Shogren, J. F., Newbold, S., & Finnoff, D. Testing
for COVID-19: Willful ignorance or selfless behavior? Behavioural Public Policy, 5(2), 135–152 (2020). https://doi.org/10.1017/bpp.2020.15 Winston, B. Media, Technology and Society: A History: From the Telegraph to the Internet. Taylor & Francis (2002). Retrieved May 2, 2022, from https://doi.org/10.4324/9780203024379 Wu, X., Tao, S., Zhang, S., Zhang, Y., Chen, K., Yang, Y., Hao, J., & Tao, F. Impact of
screen time on mental health problems progression in youth: A 1-year follow-up study. BMJ Open, 6, e011533 (2016). http://dx.doi.org/10.1136/bmjopen-2016- 011533 Zhong-Lin Lu. Computer screen time is damaging eyes — especially for children (2021). Retrieved on [April, 6, 2022]. Available from https://www.washingtonpost.com/health/kids-computer-eye-strain/2021/04/ 23/2f4ca928-988c-11eb-a6d0-13d207aadb78_story.html Zwanka, R. J., & Buff, C. COVID-19 Generation: A Conceptual Framework of the Consumer Behavioral Shifts to Be Caused by the COVID-19 Pandemic. Journal of International Consumer Marketing, 33(1), 58–67 (2021). https://doi.org/10. 1080/08961530.2020.1771646
LISTED IN THE AHFE DIGITAL BOOKSTORE CATALOGUE
Explore the complete digital volume
Safety Management and Human Factors
Read this individual research paper free through the original publisher, or explore the full digital proceedings book.
ISBN 978-1-958651-40-7
Explore this ISBN in the AHFE Bookstore ↗Listed in the July 2026 bookstore catalogue; search by ISBN to confirm current availability · Digital book purchase optional