Sergio Staab, Simon Krissel, Ludger Martin, Johannes Luderschmidt (2022). Prediction accuracy comparison between deep learning and classification algorithms in the context of human activity recognition. In: Human Interaction & Emerging Technologies (IHIET 2022): Artificial Intelligence & Future Applications. AHFE Open Access, vol. 68, pp. 308–315. https://doi.org/10.54941/ahfe1002747
In this paper, we compare the prediction accuracy of a deep learning model and three classification algorithms on very similar motions in the field of dementia diagnostics.The basic aim is to gain insights into the retrieval, provision and classification of interaction and health data in the course of the disease of dementia patients. This work shows how the smartwatch "Apple Watch Series 7" can be used to record interaction data from dementia patients and recognise corresponding movement sequences.A data transfer platform was developed that enables communication with a watchOS application on the smartwatch via a Node.js WebSocket. This data transfer platform can be used to control smartwatches and retrieve data from sensors in different frequencies (1 to 100 Hz) in real time. The sensor technology used includes accelerometers, position sensors, gyroscopes, magnetometers and heart rate monitors.In this work, the main focus is on the recognition of motion sequences. For this purpose, two different approaches of supervised learning are compared: recurrent neural network versus classification algorithms. The recurrent neural network is a special form of neural network in which neurons of the same layer or different layers are fed back. Through these feedbacks, temporally coded information can be extracted from data. Typical areas of application are handwriting recognition, translations or speech recognition. A recurrent neural network processes data with a memory called Long Short-Term Memory (LSTM). LSTMs represent the state of the art in human activity recognition and are ideal for analysing sequential streams of sensor data. An LSTM is a memory-based, powerful model that can dynamically capture and analyse contextual information whose timing is relevant.This approach of recognising motion sequences is contrasted with the classification algorithms Logistic Regression, Support Vector Machine and Decision Tree. The classification takes place under consideration of features of the respective class. An algorithm tries to work out a dividing line between combinations of features of data and to group them.Records of the activities of dementia patients by the nursing staff from two dementia care communities are available. Consultation with various care teams who work with dementia patients on a daily basis revealed that many patients wear smartwatches. Such watches keep the adjustment effort for sensor positioning low.The records of the activities of dementia patients serve as a template in this work; the movement patterns of the activities eating, drinking and writing are classified. These activities are very similar in their movement patterns, which makes classification challenging.The contribution of this work is the comparison of two possibilities for the recognition of similar movements of patients by means of smartwatches with regard to their correctness. We evaluate our prototype in a test series with five test subjects. In doing so, we demonstrate the accuracy of the memory-based classification network and classification in interaction with the latest wearable sensor technologies and discuss future directions and possibilities in the wearable IoT field of dementia
Due to the steadily increasing life expectancy of the population and the resulting shortage of nursing care, the importance of efficiency and partial automation in the care of people suffering from dementia is increasing, as (Brown 2019) is exemplifying.
Keeping track of activities such as eating, and drinking is an important albeit cumbersome task. Motion recognition utilizing smart watches is a powerful approach for this and similar use cases. Monitoring those activi- ties with smartwatches enables many possibilities, especially since patients
Prediction Accuracy Comparison Between Deep Learning and Classification Algorithms 309
find them hardly disturbing and they can be well integrated into everyday life, according to (Doherty 2021). For this purpose, a data transfer platform was developed, that offers communication with a watchOS application on the smartwatch “Apple Watch Series 7” to record interaction data and reco- gnize corresponding movement sequences. Difficulties arise in distinguishing between activities with similar movement patterns. In this paper, the activities writing, drinking, and eating which are very similar in their motion picture, are considered in order to open up the field and to increase the reliability of the recognition of the respective activity. In order to find the best possible solution, different approaches of deep learning and classification algorithms are compared in the following. In the scope of this paper the deep Learning technique Long short-term memory (LSTM) and the three classification algo- rithms Logistic Regression, Support Vector Machine and Decision Tree are looked at.
The succeeding work is structured as follows: In the Related Work, the topics LSTM and classification algorithms for classifying activity data are considered in different work. The next chapter deals with the project stru- cture, followed by the Activity Recognition chapter, in which the LSTM and classification algorithms are contrasted, and some results are given. Finally, the work is summarized, and the information are evaluated in context.
RELATED WORK
Health information technologies have been revolutionizing healthcare for years. The variety and range of technologies of software and hardware, as well as the number of applications, has grown considerably. Globally, there is an increasing demand for the implementation of health informa- tion technologies in hospitals, clinics, and homes, according to (Lau 2019). In their work, they examine the current state of mobile devices and softw- are related to health information. There are currently over 325,000 mobile applications available in app (Roche 2017). Unlike traditional health inte- rventions that originate with clinical researchers, mobile health apps are often commercialized and developed with little input from clinical research- ers or consumers. Wearable devices such as smartwatches and fitness bands are becoming increasingly popular across all demographics, from children to older adults. Reasons for this increase include fitness tracking and health monitoring. Identifying mental and physical disorders and supporting peo- ple with difficulties can significantly improve the health of users, according to (Malu und Findlater 2016). Many of these applications rely on data collected by sensors on smartwatches, including heart rate monitor, GPS, accelerome- ter, and gyroscope. Various interaction techniques make smartwatches unique and ubiquitous as data tracking devices. The literature supports this state- ment in various works in recent years. Wearable health monitoring systems have become one of the emerging research areas attracting much attention today, according to (Liu, Pharr und Salvatore 2017). (Brezmes, Gorricho und Cotrina 2009) have successfully measured various human activities using an accelerometer. (Shoaib, et al. 2015) have used both smartphones and smartwatches together to identify various daily human activities.
(Dong, et al. 2014) and also (Ramos-Garcia und Hoover 2013) have measured eating cycles of users using smartphones. The studies used accelero- meter and gyroscope sensor data from the smartphones. (Silva und Galeazzo 2013) obtained various data on eight daily actions using accelerometer data; an ez-430 Chronos smartwatch was used here. It should be noted that the detection of general activities using accelerometers and gyroscope sensors is indeed possible. However, these activities need to be realized in a much more fine-grained way for health-related data. One critical issue is arm motion detection.
In their work, (Xia, Huang und Wang 2020) propose a deep neural netw- ork that combines convolutional layers and long short-term memory (LSTM). The proposed network achieves an accuracy of 95.78 % on the UCI-HAR dataset, 95.85 % on the WISDM dataset and 92.63 % accuracy on the OPPORTUNITY dataset. These three datasets contain the sensor values of different typical daily activities. These activities display sensor values that often vary considerably from each other. In this work, we focus on three acti- vities that show very similar sensor values, making them considerably more difficult to classify. (Balli, Sa˘gba¸s und Peker 2019) compare the performance of the Classification Algorithms k-nearest neighbor, support vector mach- ine, Random Forest and C4.5 decision tree. The authors use Accelerometer, Gyroscope, Heart rate and Step counter data from a smart watch, sampled at 50 Hz from five participants. In total, 8 different activities are used for clas- sification. The results show that the most accurate algorithm was Random Forest with a classification accuracy of up to 98.5 %.
These works illustrate the ability of both LSTM and Classification Algori- thms to classify activity data in the context of Human activity Recognition. However, since both works use different activities and datasets, it is impossi- ble to create a meaningful comparison between LSTMs and Classification Algorithms. Our work focuses on the advantages and disadvantages of these algorithms by evaluating their classification performance using the same dataset for both types of algorithms. This allows us to create a direct comparison between them.
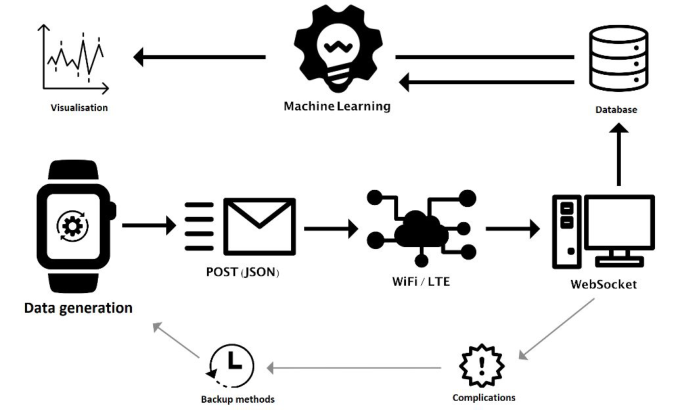
PROJECT STRUCTURE For a better overview of the structure of our prototype, this chapter is stru- ctured according to the data aggregation of the motion data: on the one hand, the label dashboard with which the watch can be controlled, its data visuali- zed live, and the labels created and managed; on the other hand, the machine learning tool with which the data can be processed, and different models trai- ned. Figure 1 provides an overview of the work. The data generation, the data handling and the saving of the data are part of the tracking, the visualization of the labeled data and the classification of the data follows in the subcha- pter Machine Learning Tool. The application provides methods for querying motion and health data, temporarily saving data in the smartwatch memory, labeling data, and an interface for exchanging sensor data with a web server via WebSocket. In case of complications, backup methods can trigger a resend of sensor data generated in a session. Instead of caching sensor data in a CSV
Prediction Accuracy Comparison Between Deep Learning and Classification Algorithms 311
file on an iPhone, this work enables direct reuse of sensor data on the server side in real time.
The sensor technology in the focus of this work controls through the application in detail accelerometer, gyroscope, gravity, and heart rate sensor. Accelerometer, gyroscope, and magnetometer contribute to the mathemati- cal calculation of the device orientation. The gravitational acceleration can be used to determine where south is from the device’s point of view, and the magnetic field vectors can be used to determine where north is.
Figure 1: Overview - from watch to documentation.
The data per second does not represent a temporal progression, but only a snapshot of the sensors. The data we tracked is at the temporal frequency of 20 Hz. Each of the data packets tracked at intervals of 50 milliseconds contains the following parameters: accelUserX, accelUserY, accelUserZ, atti- tudePitch, attitudeRoll, attitudeYaw, gravityX, gravityY, gravityZ, gyroX, gyroY, gyroZ, and heartrate.
ACTIVITY RECOGNITION The previously described methodology was applied to different classification algorithms in a series of experiments. Five subjects were included, generating 60 labels sequences. Figure 2 shows different arm position sequences of the activities. Each of the activities writing, drinking, and eating follows a clear sequence. The red arrows indicate the range of motion of the arm and wrist. When writing, the arm is rigid, while the wrist moves with the pen. Meanwh- ile, the arm moves from right to left. The movements of drinking and eating, on the other hand, are very similar: the arm moves toward the mouth; the wrist is rather stiff. Each sequence consists of arm positions and each activity was performed for 10 seconds. The measurement rate of 20 Hz results in 10 * 5 * 60 * 20 = 60,000 data sets per test series. The subjects always wore the
watch on their dominant right hand. The test and training data were created separately, i.e., the data of one subject were compared with the data of the other four subjects.
Figure 2: Arm position sequences of activities.
Figure available in the original PDF paper.
In order to train the LSTM, the raw sensor data from the Apple watch is first preprocessed by removing unnecessary features, for example the time- stamp of each value. Since each of our users has approximately labeled the same number of activities, we decided to use three users’ activity data as testing data, while using the remaining user’s data as training data for the LSTM, thus creating a ratio of 80 to 20 between training and testing data. These datasets were then normalized to values between 0 and 1 by utilizing a MinMaxScaler. Since the LSTM-implementation in TensorFlow only acce- pts Integer values as labels, the labels were encoded using a LabelEncoder. In order to provide the LSTM with data, a time series is generated for both training and test datasets. These time series use a window size of 120 data points.
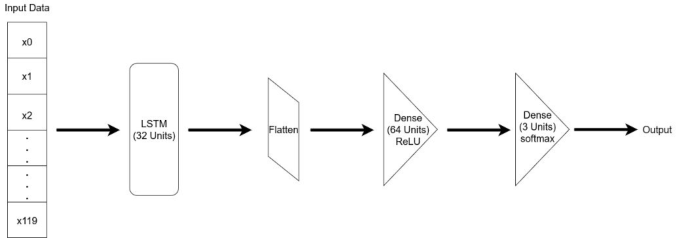
The following describes the structure of our LSTM. The input layer of our network consists of 32 units, followed by a flatten layer, a dense layer with 64 units, utilizing the ReLU activation-function. The output layer is a Dense layer with 3 units (one for each activity) and the SoftMax activation- function. Additionally, the Adam optimizer is used for the compilation. Figure 3 illustrates the described structure of the LSTM.
Figure 3: Illustration of the network structure and the layer types of our LSTM.
Classification Algorithms provide an alternative solution to the task of classifying data. For this work, we decided to contrast the LSTM with three algorithms: Logistic Regression, Support Vector Machine and Decision Tree.
Prediction Accuracy Comparison Between Deep Learning and Classification Algorithms 313
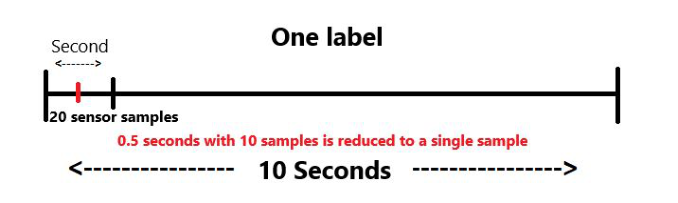
Unlike with the LSTM, where every data point is used for training and testing, the amount of data is first reduced when using these Classification algorithms. This is done to reduce noise from the sensor values, it also allows the algorithms to train faster, without reducing the accuracy of the results. Before reducing the data, the dataset is first split into training and testing data. The same Users that are used for training and testing in the LSTM are used here as well, in order to make the results between both catego- ries comparable. The data is then reduced with the following process: We take 10 samples of a sensors value and compress them into one using the mean of the 10 sensor values. This operation is then repeated for every sen- sor. At a sampling rate of 20 Hz this compresses the sampling rate to 2 Hz. Since each activity has a duration of 10 Seconds this reduces the data from 200 samples per label to 20. This process is illustrated in Figure 4. The data is then brought into a new format, further removing unnecessary values.
Figure 4: The amount of data is compressed to 2 Hz from the original dataset with 20 Hz.
To train the models described above, eleven subjects recorded approxi- mately 25 label sequences per activity each, resulting in roughly 800 labels in total. The following Table 1 displays the individual accuracies of the classification algorithms and our LSTM.
Table 1. Prediction accuracy of different classification algorithms.
Table available in the original PDF paper.
Algorithm Prediction accuracy probability LSTM 93.06 % (after 41 epochs) Support Vector Classifier 85.71 % Logistic Regression 72.08 % Decision Tree Classifier 70.13 %
It should be noted that, while the LSTM is more accurate compared to the other classification algorithms, it is also the computationally most expensive classifier. The following Table 2 illustrates the time each algorithm requires for its training and validation process.
Table 2. Training time of different classification algorithms.
Table available in the original PDF paper.
Algorithm Training time in seconds LSTM 15.1260 seconds per epoch (CPU) 1.0120 seconds per epoch (GPU) Support Vector Classifier 0.0141 seconds Logistic Regression 0.0660 seconds Decision Tree Classifier 0.0479 seconds
CONCLUSION
We have compared the prediction accuracy and computational demand of three very similar activities (activities where arm movements are almost identical) using classification algorithms and a memory-based classification network. The results of this work show that although the classification algorithms offer an advantage in terms of computing power, the prediction accuracy for very similar movements with max. 85.71% for classification algorithms versus 93.06% for a Long Short-Term Memory show that the recurrent neural network is clearly to be preferred. This work shows us the next direction for activity recognition in dementia diagnostics, in future work we will further extend the Long Short-Term Memory and include new activities for classification.
REFERENCES
Balli, Serkan, Ensar Arif Sa˘gba¸s, and Musa Peker. “Human activity recognition from smart watch sensor data using a hybrid of principal component analysis and random forest algorithm.” Measurement and Control 1-2, no. 52 (2019): 37–45. Brezmes, Tomas, Juan-Luis Gorricho, and Josep Cotrina. “Activity Recognition from
Accelerometer Data on a Mobile Phone.” Salamanca, Spain: Springer-Verlag, 2009. Brown, Ellen Leslie and Ruggiano, Nicole and Li, Juanjuan and Clarke, Peter J and Kay, Emma S and Hristidis, Vagelis. “Smartphone-based health technologies for dementia care: opportunities, challenges, and current practices.” Journal of Applied Gerontology, 2019: 73–91. Doherty, Camille Nadal and Caroline Earley and Angel Enrique and Noemi Vigano
and Corina Sas and Derek Richards and Gavin. “Integration of a smartwatch within an internet-delivered intervention for depression: Protocol for a feasibi- lity randomized controlled trial on acceptance.” Contemporary Clinical Trials, 04 2021: 11. Dong, Yujie, Jenna Scisco, Mike Wilson, Eric Muth, and Adam Hoover. “Detecting Periods of Eating During Free-Living by Tracking Wrist Motion.” {IEEE} Journal of Biomedical and Health Informatics, 2014. Gers, F.A., J. Schmidhuber, and F. Cummins. “Learning to forget: continual pre-
diction with LSTM.” 1999 Ninth International Conference on Artificial Neural Networks ICANN 99. (Conf. Publ. No. 470), 1999: 850–855.
Prediction Accuracy Comparison Between Deep Learning and Classification Algorithms 315
Hochreiter, Sepp. “The Vanishing Gradient Problem During Learning Recurrent Neural Nets and Problem Solutions.” International Journal of Uncertainty, Fuzzi- ness and Knowledge-Based Systems, no. 6 (04 1998): 107–116. Hochreiter, Sepp, and Jürgen Schmidhuber. “Long Short-Term Memory.” MIT Press
- Journals 8, no. 9 (1997): 1735–1780. Lau, Francis. Improving usability, safety and patient outcomes with health information technology : from research to practice. Amsterdam, 2019. Liu, Yuhao, Matt Pharr, and Giovanni Antonio Salvatore. “Lab-on-skin: a review
of flexible and stretchable electronics for wearable health monitoring.” ACS Publications, 2017. Malu, Meethu, and Leah Findlater. “Toward Accessible Health and Fitness Tracking for People with Mobility Impairments.” New York, NY, USA : ACM, 2016. Ramos-Garcia, Raul I., and Adam W. Hoover. “A Study of Temporal Action Sequ-
encing During Consumption of a Meal.” New York NY United States: ACM, 2013. Roche, Daman. “mHealth App Economics Current Status and Future Trends in Mobile Health.” 2017. Shoaib, Muhammad, Stephan Bosch, Hans Scholten, Paul Havinga, and Ozlem Incel.
“Towards detection of bad habits by fusing smartphone and smartwatch sensors.” IEEE, 2015. Silva, Fernando Ginez da, and Elisabete Galeazzo. “Accelerometer based intelligent system for human movement recognition.” Mu˘gla, Turkey: 5th {IEEE} International Workshop on Advances in Sensors and Interfaces {IWASI}, 2013. Xia, Kun, Jianguang Huang, and Hanyu Wang. “LSTM-CNN Architecture for
Human Activity Recognition.” IEEE Access, no. 8 (2020): 56855-56866.
Read this individual research paper free through the original publisher, or explore the full digital proceedings book.
ISBN 978-1-958651-44-5
Explore this ISBN in the AHFE Bookstore ↗Listed in the July 2026 bookstore catalogue; search by ISBN to confirm current availability · Digital book purchase optional