Jasper Koh, Prasanna Thangaraja, Kenneth Y T Lim (2023). Development of an Automated Microclimate Adjustment System based on Concentration Levels of Students. In: Cognitive Computing and Internet of Things. AHFE Open Access, vol. 73, pp. 115–123. https://doi.org/10.54941/ahfe1003980
The microclimate of a classroom can significantly impact the students' concentration. As students ourselves, we have noticed this. For the same subject, we are concentrated in one period, then in another, we lose our attention very easily. This prompted us to investigate the relationship between students' concentration levels in relation to the microclimate. Through machine learning, specifically through facial recognition and computer vision, we aimed to investigate the students' concentration levels based on the number of blinks per minute. While researching ways to analyse concentration levels, we found multiple studies which found a correlation between blink frequency and concentration level. We found that when people are concentrated, they tend to blink less and vice versa. The relationship between microclimate climate and concentration was analysed by measuring the blinks per minute while changing the microclimate at the same time. The microclimate conditions were varied using an air conditioner where the temperature set varied from 19°C to 31°C. The microclimate was measured using the NodeMCU microcontroller board paired with SCD-30 and HM-3301 sensors from Grove. This allowed us to gather data such as temperature, relative humidity, carbon dioxide concentration, PM2.5 and PM10 readings. From this, it was found that the most significant microclimate condition that affects concentration levels is carbon dioxide concentration. As the concentration of carbon dioxide increases, the concentration of the participants decreases. The observed trend is supported by various studies as well. Simultaneously, as the microclimate conditions were being varied, we sent out a survey to find the thermal comfort level of the students, allowing us to gauge how they felt according to the environment. Thermal comfort is when a person feels comfortable with the thermal environment. Participants were tasked to do their work for a fixed duration while a sensor recorded the temperature and relative humidity of the place. For every hour, the participants were required to rank their thermal comfort by using the ASHRAE scale. This survey identified the comfort zone at an upper limit temperature of 28.9°C and relative humidity of 68.0% and a lower limit temperature of 26.2°C and relative humidity of 83.1%. With these findings, we created an automated system to alter microclimate conditions. The place will be a conducive environment for the students based on their concentration and the environmental data obtained from the sensors. The alteration of microclimate conditions was done by controlling the air conditioner using an infrared LED module connected to the NodeMCU that sent out the infrared codes according to the conditions of the room, allowing us to adjust the microclimate efficiently while fully utilising the various modes of the air conditioning system to save energy.
A study exploring the relationship between the local environmental stressors and physiological responses found that the most influential microclimatic factors on the biometric indicators, such as stress, were noise and the concen- trations of carbon dioxide and dust (Lim et al., 2022). Another study found that factors such as air temperature, wind speed, relative humidity, and radi- ation temperature have a great impact on outdoor thermal comfort (Sarhadi & Rad, 2020). There is also research that found that when the air is too dry, people will concentrate less. Another research shows that when indoor tem- peratures are 22
C or warmer, productivity drops by about 2% per degree (Oxycom, 2020). Scientists at University College London (UCL) found that higher concentrations of CO2 reduce memory, impair concentration and lower decision-making capabilities (World Economic Forum, 2018). There have been multiple studies which looked at whether eye blink frequency, in blinks per minute, would be a good indicator of a person’s attention level. The common finding among those studies is that there is an inverse relationship between eye blink frequency and attention level. A study con- ducted by Daza et al. (2021) used an electroencephalogram (EEG) headset to analyse participants’ brain activity while asking them to do online work. With the EEG headset, they will be able to get temporal information related to the student’s cognitive activity. Another study by a team of researchers at the University of Granada in Spain found that the average blink rate per minute was as low as 7 and when the individuals were distracted their blink rate per minute increased to 21 (Martínez-Ruíz et al., 2002). It is to be noted that the normal blink rate per minute is between 12 and 15 (Abusharha, 2017).
AIMS/OBJECTIVES This paper reports an independent research study conceptualized, designed, and enacted by a pair of high school students from April 2022 to March 2023. We aimed to develop a system to gauge whether a person is concentrated. This was done through computer vision to detect the person’s facial features to count the subject’s number of blinks per minute. With that system, we could find out what environmental conditions are optimal for maximum focus. The environmental conditions we would be analysing were temperature, relative humidity, carbon dioxide (CO2) concentration, and PM 10 concentration. We also created a microcontroller system that will change the environmental conditions like the temperature and relative humidity in a room by sending out the appropriate infrared (IR) code to the respective electronic applia- nces like air conditioners to control them. The entire project can be broken down into three sections: creating a programme that can count the number of blinks of a participant so that it can be used to evaluate their concentration levels; data collection where we find how the environmental conditions affect concentration levels and the thermal comfort level; and creating a microcon- troller system that can influence the environmental conditions to produce a more optimal place for concentration.
Development of an Automated Microclimate Adjustment System 117
METHODOLOGY/MATERIALS Creating the Eye Blink Counter
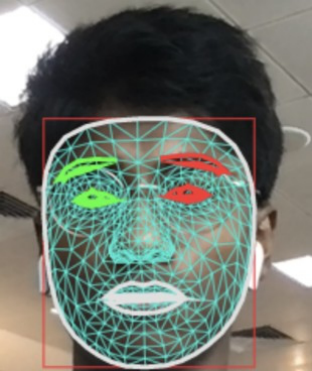
There are many ways to evaluate whether a person is concentrating. Cha & Kim (2015) studied whether the face was turned and not looking at the camera. We did not choose to use the same criteria as them as the distance of the webcam, which records the person’s face, will significantly affect the results. Another factor which comes into play when using this method is the camera’s focal length. These factors are difficult to control. Because of this reason, we chose to use blinks per minute (BPM) as the criteria to see if a person is concentrating. Any webcam can be used and the distance between the webcam and the person does not matter if we are just looking at the BPM. This makes data collection convenient. For the eye blink counter, we used Mediapipe Facemesh, an open source framework created by Google. MediaPipe Face Mesh is a solution that estimates 468 3D face landmarks. Using this library, the face landmark of the four corners (top, bottom, right and left) of the eyelid will be chosen. A blink would be considered when the ratio between the vertical distance to the horizontal distance of the eyelid reaches a certain number (this number could vary from person to person, and this will be addressed more in the results). A ratio is chosen so that the distance between the person and the camera does not matter.
As shown in Figure 1, the library was able to pick out the facial landmarks accurately. It only picks out the facial features and not things like the earpiece that the subject is wearing. It is also able to distinguish the eyes and the spectacles.
Data Collection To find out how environmental conditions affect concentration, we asked our subjects to do computer-related work in different conditions for 20 minutes.
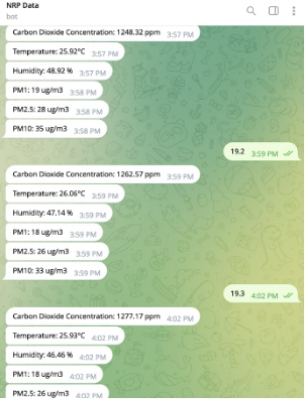
Figure 1: Example of mediapipe facemesh and the number of facial landmarks it can measure.Figure 2: Example of output data from the sensors sent via Telegram.
The conditions were in rooms of 19
C, 22
C, 25
C, 28
C and 31
C. The temperature of the rooms was altered by using an air conditioner. We also created a device that could measure environmental data such as carbon dio- xide concentration, temperature, relative humidity, PM1, PM2.5 and PM10. This data was later used for analysis as well. The device measured this data and automatically sent those data to the subject’s phone via Telegram every 5 minutes as the test took place, as shown in Figure 2. A survey was conducted to find the thermal comfort level of the parti- cipants. Five classmates volunteered to stay in the classroom, with a data logger running (collecting temperature and humidity data every 2 minutes and 30 seconds), from 8 am to 6 pm. For every hour, volunteers would indi- cate their thermal comfort level from the 7 options in the ASHRAE 55 scale. With the data collected a thermal comfort graph was plotted with the data collected to find the upper and lower limit of thermal comfort. The ther- mal comfort graph is a scatter plot graph for the “Neutral” option in the scale.
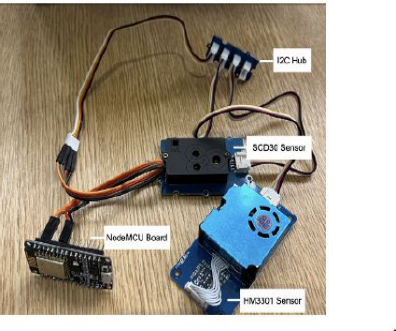
Creating the Microcontroller System The microcontroller system can be split into three parts, namely the input, process and output. As seen in Figure 3, the setting up of the device for data collection is straightforward. The output pins from the NodeMCU micro- controller board were connected to the I2C Hub accordingly and the SCD30 and HM3301 sensors were connected to the NodeMCU via the I2C Hub.
The components used in the hardware system are the NodeMCU ESP8266, Infrared Transmitter, Grove SCD30 Sensor and Grove HM-3301 Sensor. To address the inputs of the system, the Grove SCD30 sensor mainly detects the Carbon Dioxide Concentration in its surroundings while giving the Tempera- ture and Relative Humidity at the same time. Next, Grove HM-3301 Sensor
Development of an Automated Microclimate Adjustment System 119
Figure 3: The device used for data collection.
is used to measure the air quality in the room as the sensor is able to detect a range of Particulate Matter (PM) readings, namely PM1, PM2.5 and PM10.
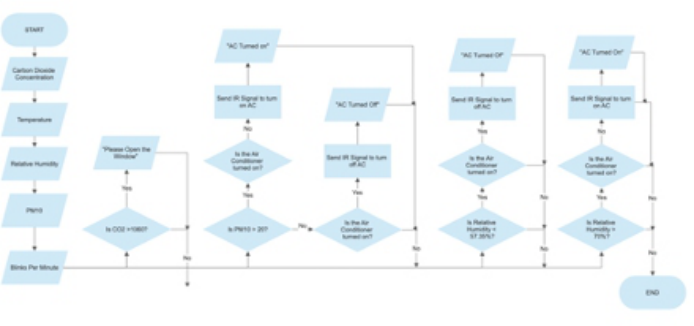
The input of the system is controlled by a Telegram Bot, which sends the data from the sensors to the user each time the user requests it. The use of the Telegram Bot was made possible through the use of the WiFi chip on the NodeMCU, as the board was able to communicate with Telegram when connected to wifi or a hotspot wirelessly. This system is particularly useful as the user is able to control when the data is recorded and have the timestamp of the period measured automatically. The process of the system is in the code, where it will take in all the variables from the sensors and the computer vision to determine whether there is a need to check on the environment. If there are changes to the microclimate that need to be made, it will send a signal to the Infrared (IR) transmitter. Lastly, for the output, the device will either turn on or off an air conditioning unit or air purifier unit in order to adjust the microclimate to make the environment as conducive as possible. The flowchart, as seen in Figure 4 below, shows an overview of how the
Figure 4: The entire process of the microclimate adjustment system.
microcontroller system works when it comes to adjusting the microclimate of the location based on a set of predefined parameters that was gathered from the data collection.
RESULTS
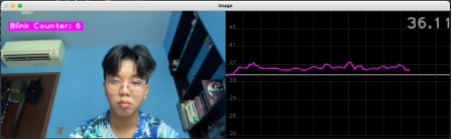
Evaluation of Eye Blink Counter As has already been mentioned, the eye blink counter considered one blink when the ratio between the horizontal to vertical distance in the eyelid reaches a certain number. This is shown in Figure 5. Therefore this counter cannot be readily applied to every person as the ratio will differ from person to person due to the difference in the size in their eyes.
The counter is not effective if the subject moves their head sideways. It usually over-counts the blinks when this happens. This could be circumvented by using an auto-track camera that will auto-track the subject as the person moves. The auto-track webcam can already be found in some computers and laptops.
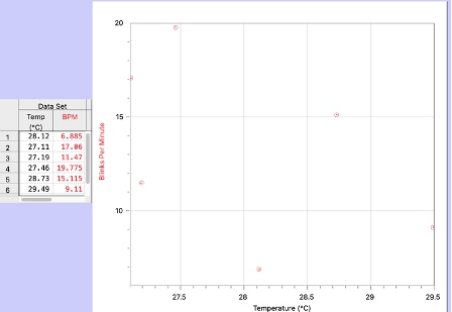
Evaluation of How Microclimate Affects Concentration From our findings, there could be no clear conclusion made on how tem- perature, dust concentration or relative humidity affected concentration levels. Figure 6, for example, shows no clear relationship between ambient temperature and BPM.
Figure 5: Eye blink counter in action.Figure 6: Ambient temperature and BPM.
Development of an Automated Microclimate Adjustment System 121
Figure 7: CO2 concentration and BPM.
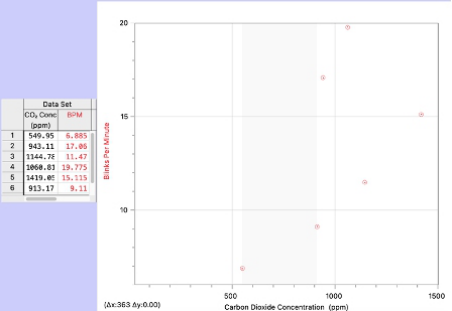
In contrast, Figure 7 does suggest a trend between CO2 concentration and BPM. As the concentration of CO2 increases, the concentration of the parti- cipants decreases. The increase in the BPM of the participants indicates this. This trend matches the findings presented in the literature review as well.
The comfortable region was identified at an upper limit temperature of 28.9
C and relative humidity of 68.0% and at a lower limit temperature of 26.2
C and relative humidity of 83.1%.
DISCUSSION AND CONCLUDING REMARKS With an automated system to alter the microclimate condition, the environ- ment becomes more conducive, and devices like the air conditioner and air purifier are only used when needed. This will result in energy being saved. The microcontroller system, which changes the microclimate conditions, can be controlled using a mobile application. In the mobile application, the users can also see the current microclimate conditions like the temperature, relative humidity, CO2 concentration, PM 2.5 and PM 10. The microcontroller and the respective sensors used are relatively low-cost as compared to industry standard equipment and have high levels of accuracy as well. As the equi- pment used can be easily obtained, it will enable schools or other workplace environments to implement this system due to its low cost and the various benefits that come along when implemented.
This includes saving energy and positively affecting the concentration of the people in the room, allowing them to be more productive. The way concentration was evaluated in this experiment is relatively simple to imple- ment as it only requires a single input source, a camera. This facilitates additional research that could be done by other people, aiding in corro- borating the findings from this research. Therefore, due to its simplicity in determining a subject’s concentration level, the simple camera setup is a strength of this experiment.
One of the key sources of error arises from using BPM as a way to mea- sure a person’s concentration. BPM is not only affected by the person’s
engagement, but it is also affected by other factors such as fatigue, age, stress and medications (Abelson & Walker, 2007). Therefore solely using BPM to see if a person is concentrated would not be reliable. First, a wide range of people representing a larger demographic of students can be chosen to prevent this error. This will reduce the selection bias and give more reliable results. Another way to reduce the effect of the error would be to ask the participants to wear an EEG headset like how they did the study mentioned in the literature review. By analysing the brain activity of the subject, it would be clear if a person is concentrated. This brain activity can be correlated to the BPM of the participants as well and the relationship between the two factors can be further established. Using an EEG headset would also allow us to see how concentrated the person is rather than is the person concentra- ted. Using the data from both the EEG headset and the eyeblink counter, it would be possible to create a calibration curve of focus levels against BPM. Another source of error would be the limited range available for the indepen- dent variables of temperature and relative humidity. The temperature range is only from 27.11
C to 29.4
C, while the range for relative humidity is from 47.49% to 68.96%. This limited range is one of the main reasons why a clear trend could not be established for how the factors affect concentration. With the larger range, the anomalies could also have been identified. The main cause for the limited range is starting the data collection immediately after setting the air conditioner to a certain temperature. The participants should let the air conditioner run at that temperature for about at least 20 minutes before starting the data collection. This way, the ambient room tempera- ture would have been around the temperature that was set on the remote. From the study, we clearly found that higher concentrations of CO2 reduce concentration. However, these environmental factors can be felt differently by different people because of the difference in their physiology. Therefore it is unfair to come to the conclusion that these factors are optimal environmental conditions for everyone. To minimise this error, just like for the first error, a wide range of people could have been used as subjects. Surveying days should also be taken into account. Different weather on different days gives rise to different temperatures and humidities. Hence, surveying should be carried out across several months where different weather conditions persist throu- ghout the day to determine the comfort zone’s extreme points further. Other factors which affect thermal comfort, such as airflow, and mean radiant tem- perature, can be taken into account as it can provide more information that allows a multifaceted discussion. This can provide a better understanding of how the environment affects the thermal comfort of the student.
REFERENCES
Abelson, M. B., & Walker, P. (2007, August 8). Breaking Down the Blink. Review of Ophthalmology. Retrieved January 15, 2023, from https://www.reviewofophthalmology.com/article/breaking-down-the-blink Abusharha A. A. (2017). Changes in blink rate and ocular symptoms during different reading tasks. Clinical optometry, 9, 133–138. https://doi.org/10.2147/OPTO. S142718
Development of an Automated Microclimate Adjustment System 123
Cha, S., & Kim, W. (2015). Concentration analysis by detecting face features of learners. 2015 IEEE Pacific Rim Conference on Communications, Computers and Signal Processing (PACRIM). https://doi.org/10.1109/pacrim.2015.7334807 Daza, R., Morales, A., Fierrez, J., Tolosana, R. 2021. MEBAL: AMultimodal
Database for Eye Blink Detection and Attention Level Estimation. In Compa- nion Publication of the 2020 International Conference on Multimodal Interaction (ICMI’20 Companion). Association for Computing Machinery, New York, NY, USA, 32–36. https://doi.org/10.1145/3395035.3425257 Lim, K. Y. T., Nguyen Duc, M. A., Nguyen Thien, M. T., Yuvaraj R., & Fogarty, J. S. Investigating the Effects of Microclimate on Physiological Stress and Brain Function with Data Science and Wearables. Sustainability. 2022;14(17):10769. https://doi.org/10.3390/su141710769 Martínez-Ruíz, J. A., Mañanas, J. J., Gómez-Prado, M. L. (2002). “Blinkrate in
relation to visual demand”. Ophthalmic and Physiological Optics. Oxycom. (n.d.). The indoor climate: How it affects the productivity of your employees. Oxycom. Retrieved January 15, 2023, from https://www.oxy-com.com/blog- news/indoor-climate-affects-productivity-employees Sarhadi, F., & Rad, V. B. (2020). The structural model for thermal comfort based
on perceptions individuals in open urban spaces. Building and Environment, 185, 107260. https://doi.org/10.1016/j.buildenv.2020.107260 World Economic Forum. (2018, December 12). Increased levels of carbondioxide could reduce brainpower, study finds. The World Economic Forum. Retrieved January 15, 2023, from https://www.weforum.org/agenda/2018/12/increased- levels-of-carbon-dioxide-could-reduce-brainpower-study-finds/Booher, Harold, ed. (2003). Handbook of human systems integration. New Jersey: Wiley.
LISTED IN THE AHFE DIGITAL BOOKSTORE CATALOGUE
Explore the complete digital volume
Cognitive Computing and Internet of Things
Read this individual research paper free through the original publisher, or explore the full digital proceedings book.
ISBN 978-1-958651-49-0
Explore this ISBN in the AHFE Bookstore ↗Listed in the July 2026 bookstore catalogue; search by ISBN to confirm current availability · Digital book purchase optional