Jing Peng Lee, Bruce Yu, Kenneth Y T Lim (2023). Exploring The Implementation of AI in a Cost-effective Device for Predicting Sleep Quality. In: Cognitive Computing and Internet of Things. AHFE Open Access, vol. 73, pp. 124–132. https://doi.org/10.54941/ahfe1003981
This report presents the development and effectiveness of an Arduino-based sleep tracking device that can accurately measure various parameters of sleep, including movement, temperature, sound, light intensity, and humidity. The device was designed to be low-cost and easy to use, while not compromising on its ability to accurately measure sleep activity. The effectiveness of the device was evaluated by collecting data from test subjects and comparing it to the data collected by other sleep tracking devices. The collected data was then processed and used to train Artificial Intelligence (AI) models such as Backward Propagation Neural Network, Linear Regression Model, and Grey Relation Analysis, to predict the sleep quality rating from 0% to 100% and to identify the main cause of poor sleep. The results of the study demonstrated that the Arduino-based sleep tracking device is an effective and cost-efficient tool for measuring various parameters of sleep. However, the pressure sensor may sometimes result in inaccurate readings, which can be addressed through data cleaning and filtering. Furthermore, the use of AI models was able to predict the sleep quality rating and identify the main causes of poor sleep with high accuracy. Further research is needed to evaluate the device's performance over a longer period of time and in a larger sample of participants.
This paper describes a study that was carried out by students as an indi- vidual research project under the mentorship of a research scientist at the Nanyang Technological University in Singapore. In this research, the authors were exploring the implementation of AI and deep learning models - Grey Relational Analysis, Logistic Regression Model, BP Neural Network, and a classification model - on a cost-effective device containing environmental sen- sors (such as temperature, humidity, air pressure, light intensity, and ambient noise level) and body movement detectors (under a specially designed pillow).
METHODS AND MATERIALS Sleep Tracking Device
The authors investigated the associative relationship between body move- ment frequency, temperature, sound, light intensity, humidity and sleep
Exploring the Implementation of AI in a Cost-Effective Device 125
quality by collecting 63 sets of data from 5 high school students from October to December 2022. We designed and developed a sleep tracking device using an Arduino microcontroller as the main component. The device was designed with user-friendliness in mind, by ensuring that it is easy to install and com- fortable to use, thus making it feasible to be used on a day-to-day basis. The device was connected to various sensors that were used to collect data during sleep.
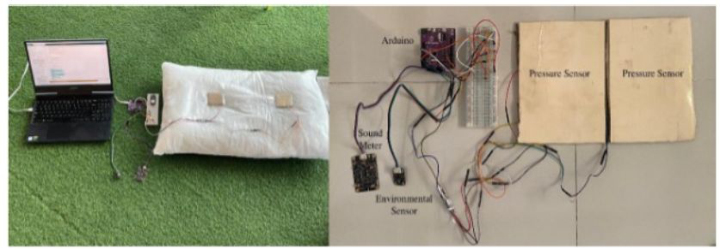
Figure 1 depicts a schematic of the sensors and the following is a detailed description of the components and their implementation in the device:
1. Pressure Sensor: To detect movement during sleep, pressure sensors were implemented using foam sheets. We chose foam sheets as the material is inex- pensive, and also flexible and soft, thus bringing down the cost of the device and ensuring maximum comfort in using it. The foam was placed under the pillow and connected to the Arduino using wires. The foam was able to detect the pressure exerted by the user’s head and send this information to the Arduino.
2. Environmental sensor: To measure temperature and humidity during sleep, an environmental sensor was connected to the Arduino. The sensor was placed outside of the pillow in an opened box to measure the environ- mental conditions of the room that the user sleeps in. The sensor was able to accurately measure the ambient temperature and humidity and send this information to the Arduino.
3. Sound meter: To measure sound levels during sleep, a sound meter was connected to the Arduino. The sound meter was placed in the opened box and was able to measure the ambient sound levels and send this information to the Arduino.
4. Light dependent resistor: To measure light intensity during sleep, a light dependent resistor was connected to the Arduino. The resistor was placed in the opened box and was able to measure the ambient light level and send this information to the Arduino.
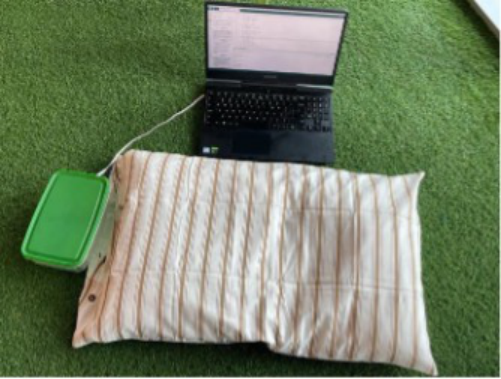
Figure 2 depicts the assembled device. Participants were asked to sleep with the device under their pillow for several nights. As participants used our device, the Arduino collected data from its various sensors, and sent the live data to a server, built using the Python programming language. The data was then saved into an Excel sheet for subsequent processing and training.
Figure 1: Schematic of sensors for the data collection.Figure 2: Assembled sleep quality monitoring device.
DATA PROCESSING Raw Data
Having successfully saved and stored the data, it was then processed to pre- pare for machine learning training. Below are the steps that were involved in the processing of the raw data:
1. Data Cleaning: The raw data was cleaned to remove any erroneous, inaccurate, or missing data points, through a Python program. This reduces the amount of data that would negatively impact the model during training, and thus ensuring the maximum effectiveness of our model.
2. Data Preprocessing: After the data was cleaned, it was preprocessed to ensure that it was in a format that could be used for AI training. This inclu- ded the crucial step of data standardization, to ensure a fair and consistent comparison of data during training, which would be explained in the subse- quent subchapter. Each row of data was also assigned a sleep quality rating of either “Good”, or “Poor”, along with the suspected reason if it was a “Poor” sleep. The sleep quality rating would serve as the parameter that would be predicted by the model during and after training.
3. Data splitting: The next step was to split the data into training and test sets. The training set was used to train the AI models, while the test set was used to evaluate the performance of the models. We split our data such that 80% of it was used for training, while 20% was used for evaluation.
Data Standardisation Standardization is essential for this research because it allows for fair and consistent comparison of data. Different types of data require slightly different ways to standardize due to their natures:
Background noise level – standardization
Exploring the Implementation of AI in a Cost-Effective Device 127
Body movement – found by variation of pressure magnitude, followed by standardization
Light condition – negative min-max normalization
Temperature – found by deviation from the ideal level (18
C or 291K), followed by standardization
Humidity – found by difference between the two interval boundaries (40% - 60%), followed by standardization AI or Deep Learning Models
Finding the Highest Impact Factor Grey relational analysis (GRA) is a method used to compare multiple factors or elements that have different levels of importance and are subject to vari- ations or uncertainties. GRA is based on the concept of grey systems theory, which deals with systems or phenomena that have both known and unknown or uncertain components. In GRA, the goal is to find the most similar or related elements among a set of alternatives, based on a set of criteria or indi- cators. The similarity or relatedness is represented by a grey relational grade (GRG), which is a value between 0 and 1, where 1 represents the highest similarity or relatedness and 0 represents the lowest. The following equation shows the math behind the algorithm. It’s essentially assessing the similarity of the various independent factors in the data set and the dependent varia- ble. The calculated value is called grey relational rating, which stands for the co-relation degree of various factors to a dependent variable in a system.
Sleep Quality Prediction A backpropagation neural network (BPNN) is a type of feedforward artificial neural network that is trained using supervised learning and the backpropa- gation algorithm. The network is composed of layers of interconnected nodes or “neurons,” each of which performs a simple mathematical operation on its inputs. The input layer receives the input data, and the output layer produces the network’s predictions. The layers in between, called hidden layers, pro- cess the input data and pass it on to the next layer. The neurons in each layer are connected to the neurons in the next layer via connections, each of which has a weight that represents the strength of that connection. The weights are initially set to random values, and their values are adjusted during training to optimize the network’s performance. The training process starts by providing the network with the training data. The network uses these pairs to adjust its weights so that it can produce the correct output for a given input. The network uses the backpropagation algorithm to calculate the error between its predicted output and the actual output for each input-output pair.
This error is then propagated back through the network to adjust the wei- ghts of the connections between the neurons. This process is repeated multiple times, with different input-output pairs, until the error reaches an acceptable level. The backpropagation step is where the error is calculated, and the wei- ghts are updated. The error is calculated by comparing the predicted output with the actual output and then the error is backpropagated from the out- put layer to the hidden layer and then back to the input layer. The weights
are updated using a technique such as gradient descent to minimize the error. In the context of this research, a linear regression model was used to clas- sify rows of data into either “Good” or “Poor” sleep. To do this, the model was trained using a labeled dataset, where each row of data was labeled as “Good” or “Poor” based on the sleep quality of the participant. The model was then used to predict the labels for new, unseen data. Mathematically, the linear regression model is represented by the equation:
Equation reproduced from the original PDF.
where y is the dependent variable (sleep quality), x1, x2,..., xn are the inde- pendent variables (parameters collected by the sleep tracking device), and b0, b1, b2,..., bn are the coefficients that are determined by the model during training.
RESULTS
Relative Effectiveness of Sleep Tracking Device The results of this study demonstrate that the Arduino-based sleep tracking device is an effective tool for measuring various parameters of sleep. The device was able to accurately and precisely measure movement, tempera- ture, sound, light intensity, and humidity during sleep. This is in line with previous research that has shown that these parameters are important indi- cators of sleep quality (Sadeh, 2011). When compared to traditional sleep tracking devices, such as polysomnography (PSG), the Arduino device has several advantages. PSG is a complex and costly procedure that requires sleep lab and trained personnel to perform. It is often used in research settings and not in a home environment. The Arduino-based device, on the other hand, is a low-cost, easy to use device that can be implemented in a home setting, allowing for a more natural sleep environment. This makes it more user- friendly and accessible to a larger population. (Kushida, 2011) However, it is important to note that the device’s pressure sensor may sometimes result in inaccurate readings due to insensitivity or other factors. Such data can be filtered and cleaned out using codes, but it is important to be aware of this potential limitation of the device. Furthermore, a larger sample size of participants is needed in future studies to verify the device’s performance in different populations and over a longer period of time.
AI Results A total of 441 data entries, or 63 complete sets of data were collected from October 2022 to December 2022 by monitoring the sleep environment and the sleep quality of 5 high school volunteers. The environmental factors and body movement data are collected by our self-designed equipment. The sleep quality data were obtained by using the judgement matrix method – which involves pair- wise comparisons of sleep quality in different nights. After the collection of all the comparison data is complete, a consistency check of the matrix is conducted. The final consistency ratio of the sleep quality data is 0.057, which is within an acceptable inconsistency range. Hence, the
Exploring the Implementation of AI in a Cost-Effective Device 129
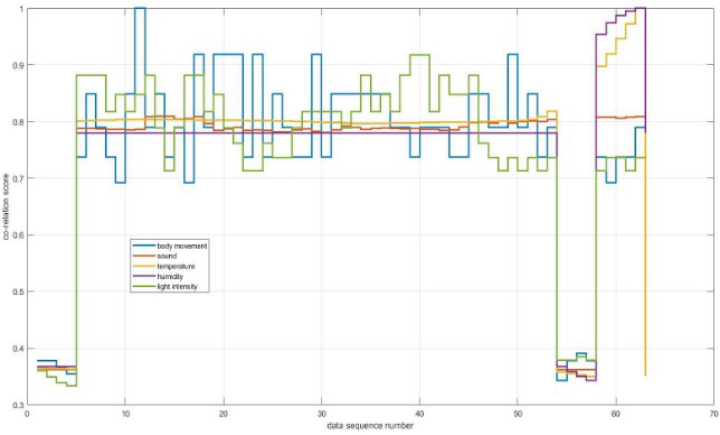
Figure 3: GRA co-relation scores of each factor to sleep quality during each night.
sleep quality data is calculated from the pair-wise sleep quality comparisons. Figure 3 shows the GRA co-relation scores of each factor to sleep quality during each night.
Associative Relationships of Nocturnal Surroundings and Sleep Quality By utilizing the GRA algorithm, the co-relations of the sleep quality and the five factors – body movement, background noise level, temperature, humidity, and light intensity – are studied. The figure below represents the co-relation score of each factor to the sleep quality at each night.
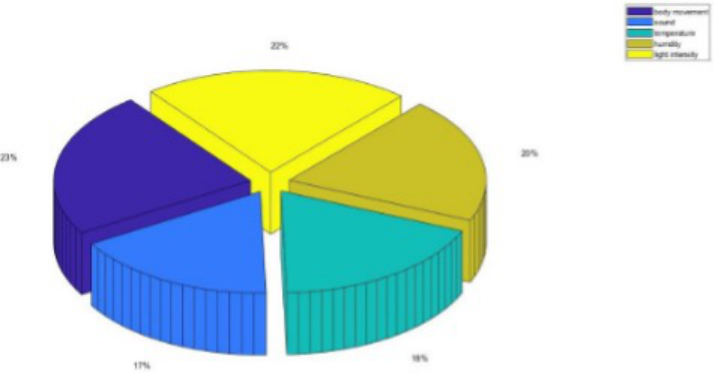
Figures 4 and 5 summarize further the findings. By studying the co-relation scores, we can indicate from the results that the highest co-related factor of sleep quality is the body movement frequency (0.2304 grey relational rating). Due to previously normalized body movement data, this result suggests that there is an inverse relationship between body movement frequency at night and sleep quality. The more frequently a person moves at night, the lower the sleep quality will be. The second highest influencing factor is the light intensity (0.2196 grey relational rating). This result indicates that high light intensity results in poor sleep quality. The co-relation scores of humidity (0.1991 grey relational rating), temperature (0.1808 grey relational rating), and background noise level (0.1687 grey relational rating) suggest that the five factors investigated in the experiment are all significant in impacting the sleep quality.
It is mentioned earlier that the Backward Propagation neural network model (BPNN) is used to make short-term predictions of the sleep quality by studying the trends of all the factors mentioned above. The potential advantage of BPNN is its flexibility due to it requiring less amount of data comparing to the amount tradional machine learning models require.
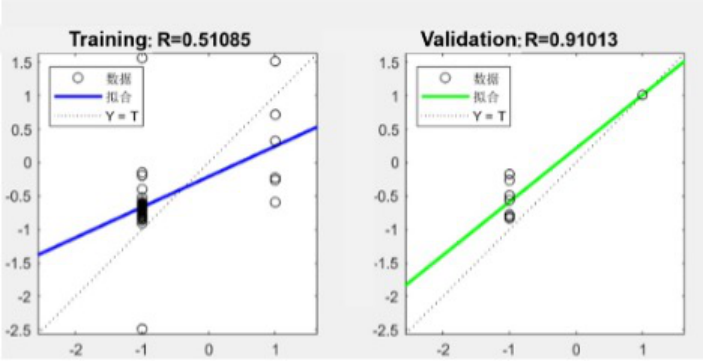
Figure 4: Pie chart for the overall contributions of each factor.Figure 5: R-score of the BPNN model.
Therefore, BPNN is said to be capable of creating personalized sleep quality predictions. The sleep quality of the next night predicted by the BPNN from the data we collected is 5.621 (with 10 being the highest, 1 being the lowest). The R-score of the training set is 0.511 and the validation set is 0.91, which is considered to be within an acceptable range.
CONCLUDING REMARKS The results have shown that the most impactful environmental factor is light intensity with a grey relational rating of 0.2196. The most co-related feature to sleep quality is body movement frequency at night with a grey relational rating of 0.2304. This research has also proved the viability of implementing BPNN on predicting future sleep quality.
Exploring the Implementation of AI in a Cost-Effective Device 131
By using the data set this research has collected to train the BPNN model, this model has obtained a R-score of 0.9101 in the validation step. The study highlights the importance of implementing AI in the understanding of sleep environment and sleep quality. Theoretically, the co-relation ratings of the factors to sleep quality this research have yielded can serve as the judgement matrix or judgement coefficients in future development of sleep tracking AI. In practice, the results from the analysis can be used to set boundaries of envi- ronmental conditions and be coded into the hardware sleep quality tracker to serve as an alarm. The trained linear regression models, BPNN, and GRA models can be used to make short-term sleep quality prediction and iden- tify the most co-related factor, or the cause of poor sleep quality, when they are coded as the backend algorithms of the hardware sleep quality tracker. We view the potential contributions of our work from two aspects: a self- designed, low-cost device in tracking multiple nocturnal background data, including sleep movements, and the implementation of AI and deep learning in utilizing the data collected to classify reasons for poor sleep quality and make improvements of sleep quality based on future sleep quality predictions. We hope to contribute to the body of literature on the relationships between environmental, physical features and sleep quality.
REFERENCES
Czempik, P. F., Jarosi´nska, A., Machlowska, K., & Pluta, M. (2020). Impact of Light Intensity on Sleep of Patients in the Intensive Care Unit: A Prospective Observational Study. Indian journal of critical care medicine : peer-reviewed, official publication of Indian Society of Critical Care Medicine, 24(1), 33–37. https://doi.org/10.5005/ jp-journals-10071-23323 Dafna, E., Tarasiuk, A., & Zigel, Y. (2018, September 7). Sleep staging using
nocturnal sound analysis. Nature News. Retrieved January 15, 2023, from https://www.nature.com/articles/s41598-018-31748-0 Della Monica, C., Johnsen, S., Atzori, G., Groeger, J. A., & Dijk, D.-J.
(2018, May.) Rapid eye movement sleep, sleep continuity and slow wave sleep aspredictors of cognition, mood, and subjective sleep quality in healthy- men and women, aged 20–84 years. Frontiers. Retrieved January 15, 2023, fromhttps://www.frontiersin.org/articles/10.3389/fpsyt.2018.00255/full Hastie, T., Tibshirani, R., & Friedman, J. (2009). The elements of statistical learning: data mining, inference, and prediction (2nd ed.). New York: Springer. Kutner, M. H., Nachtsheim, C. J., Neter, J., & Li, W. (2005). Applied linear regression
models (4th ed.). Boston: McGraw-Hill/Irwin. McCullagh, P., & Nelder, J. A. (1989). Generalized linear models (2nded.). London: Chapman and Hall. Mesas, A. E., López-García, E., León-Muñoz, L. M., Graciani, A., Guallar-Castillón,
P., Rodríguez-Artalejo, F. (n.d.). The association between habitual sleepduration and sleep quality in older adults according to health status. Age and ageing. Retrieved January 15, 2023. Sadeh, A. (2011). The role of actigraphy in the study of sleep and circadian rhythms.
Sleep Medicine Reviews, 15(3), 179–187. Suparti, S., & Suroso, J. (2020) The correlation between humidity, temperature, and noise with sleep... (n.d.). Retrieved January 15, 2023, from https://www.researchgate.net/publication/345366332_The_Correlation_
Between_Humidity_Temperature_and_Noise_With_Sleep_Quality_at_Intensive_ Care_Unit_ICU Vitiello, M. V., Larsen, L. H., & Moe, K. E. (2004). Age-related sleep change: Gender and estrogen effects on the subjective-objective sleep quality relationships of heal- thy, non complaining older men and women. Journal of psychosomatic research, 56(5), 503–510.https://doi.org/10.1016/S0022-3999(04)00023-6 Xiong, J., Lan, L., Lian, Z. & De dear, R. (2020) Associations of bedroom tem-
perature and ventilation with sleep quality, Science and Technology for the Built Environment, 26:9, 1274–1284, DOI: 10.1080/23744731.2020.1756664Booher, Harold, ed. (2003). Handbook of human systems integration. New Jersey: Wiley.
LISTED IN THE AHFE DIGITAL BOOKSTORE CATALOGUE
Explore the complete digital volume
Cognitive Computing and Internet of Things
Read this individual research paper free through the original publisher, or explore the full digital proceedings book.
ISBN 978-1-958651-49-0
Explore this ISBN in the AHFE Bookstore ↗Listed in the July 2026 bookstore catalogue; search by ISBN to confirm current availability · Digital book purchase optional