Peter Schmid, Thomas Maier (2023). Tactile information coding for touchless interaction with medical devices by means of hand gestures in the air. In: Healthcare and Medical Devices. AHFE Open Access, vol. 79, pp. 151–161. https://doi.org/10.54941/ahfe1003483
Non-contact control of medical devices in the operating room offers essential advantages. However, touchless forms of interaction such as gaze, hand and voice gesture control are poorly accepted in practical use in medicine due to insufficient feedback. Current gesture control systems usually output audiovisual feedback about a performed selection of a function. Consequently, audiovisual feedback does not relieve the already heavily loaded audiovisual perception channel of the surgeon. Therefore, the frequent request of surgeons results in a haptic feedback similar to the manipulation via a physical control element, where a direct feedback about the selection of a function is given. In this research project, the advantage of contamination-free manipulation of hand gesture control is combined with tactile feedback based on ultrasonic waves to transfer information by the tactile perception channel.For the study, various 10-point tactile scales were generated, which were examined with regard to their suitability for the transmission of information. The focus of the investigation was the subject‘s recognition of the information contents "increase", "decrease" and the marking of a "middle" or a "preferred scale value". Therefore, a virtual slider with a tactile feedback based on ultrasound waves was implemented. This slider was provided with a discrete tactile feedback in the form of a 10-point tactile scale, which could be perceived by the hand during a sliding movement. For the coding of information, the recognition of differences in the tactile scale was relevant. To identify the differences, the tactile feedback could be modified in terms of feedback intensity and scale spacing. A total of 16 different coding features were tested. 4 coding features for coding an “increase”, 4 coding features for coding a “decrease” and 8 coding features for coding a “middle” or “preferred value”. The tactile feedback was tested on 30 test persons (15 f / 15 m, Ø = 24.33 years, SD = 3.74 years). The experiment consisted of a main and a secondary task. The main task was to perform a precision task on a medical phantom. As a secondary task, the test persons had to perceive the change in the scale and adjust the scale position directly afterwards. The secondary task was performed blindly, without visual or acoustic feedback.The evaluation of the objective data such as task completion or operating time as well as the subjective data such as recognition of the tactile coding feature or mental load show differences between the characteristics of the coding features. With an interference statistical analysis of the results, significant differences between the different characteristics of the coding features concerning the effectiveness, efficiency and user satisfaction are identified. It’s also shown that the most appropriate coding features for marking an “increase”, a “decrease” and a “middle” or a “preferred scale value” based on this study need to be investigated in more detail in further studies. A particular focus of further investigations will be on the difference threshold with respect to feedback intensity and scale spacing of tactile feedback.
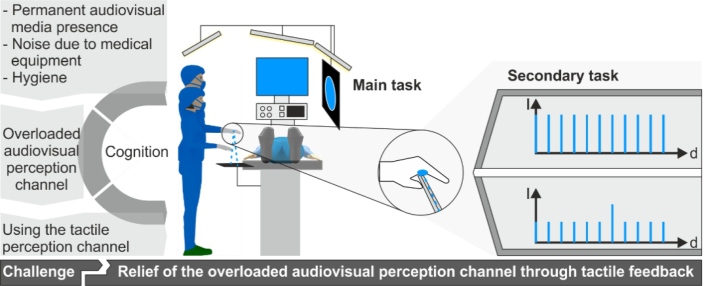
Interaction with medical equipment during a medical procedure in the opera- ting room poses great challenges for the surgeon. During a medical procedure, the interaction and control of medical equipment are carried out under con- stant compliance with strict hygiene regulations. Therefore, non-contact control of medical devices in the operating room offers essential advanta- ges (Hurstel & Bechmann, 2019). However, touchless forms of interaction such as gaze, hand, and voice gesture control are poorly accepted for pra- ctical use in medicine due to insufficient feedback. Current gesture control systems usually only output audiovisual feedback about a function’s sele- ction. The permanent audiovisual media presence leads to an overload of human perception and information processing capability. Figure 1 gives an overview of the current heavy load on the audiovisual perception channel of surgeons. Studies by Stevenson et al. (2013) verify a very high perma- nent noise level in current operating rooms, which makes concentrated work very difficult. Audiovisual feedback, as provided by current gesture control systems, consequently contributes to an increase in noise levels and does not relieve the surgeon’s already heavily loaded audiovisual perception channel (see Figure 1). Therefore, the frequent request of surgeons results in haptic feedback similar to the interaction via a physical control element, where direct feedback about the selection of a function is given. The aim of this work is to develop a human-machine interface that ensures safe, intuitive, and efficient interaction without interfering with the surgeon’s work. For this purpose, the advantage of contamination-free interaction of gesture control is combined with tactile feedback based on ultrasonic waves (see Figure 1). Furthermore, another advantage of tactile information transfer is that this perception channel is often underutilised.
The recognition of simple information content such as an “increase” or “decrease” or an indication of a “middle” or a “preferred scale position” is the subject of this study. According to the study of Winterholler (2019), Schmid et al. (2020) or Schmid and Maier (2021), this series of experiments investigate whether information is recognized by subjects while performing an adjustment task with tactile feedback in the air.
METHOD
In the following chapter, various tactile scales are generated, which are examined concerning their suitability for the transmission of information. Information is transmitted via the tactile perception channel based on dif- ferences in the tactile scale of the ultrasound-based feedback. The focus of the investigation is the recognition of the information contents “increase”, “decrease” and the indication of the “middle of a scale” or a “preferred scale value”. For the characterization of an “increase”and a “decrease”, four scale characteristics each are available (cf. Table 1). With regard to the tactile coding of an “increase”, three further start intensities (60%, 77%, and 96%) are selected based on a feedback intensity of 48% according to the R10 series of standards (DIN 323-1, 1974). The feedback characteristic of an “incre- ase” starts at one of these start intensities and ends at a feedback intensity
Tactile Information Coding for Touchless Interaction With Medical Devices 153
Figure 1: Visualization of the investigation target for the use of tactile feedback in the operating room.Table 1. Scale characteristics for coding an “increase” or “decrease”.
Table available in the original PDF paper.
Scale characteristic Start Intensity I0
Final Intensity I0
Scale Spacing x0 V1.1 48 % 100 % 30 mm
V1.2 60 % 100 % 30 mm
V1.3 77 % 100 % 30 mm
V1.4 96 % 100 % 30 mm
V1.5 100 % 48 % 30 mm
V1.6 100 % 60 % 30 mm
V1.7 100 % 77 % 30 mm
V1.8 100 % 96 % 30 mm
of 100%. The test subject feels a linear increase in feedback intensity when moving the hand from left to right. The gradient of the increase scale differs. A “decrease” is built up inversely. When moving the hand from left to right, the intensity decreases linearly from 100% to 48%, 60%, 77%, or 96% at the final position. Thus, four further scale characteristics are available for the feedback course of a “decrease”. The “increase”as well as the “decrease”run linearly, distributed over 10 scale points.
154 Schmid and Maier
The indication of a “middle”or a “preferred value”is done by the recogni- tion of a difference in the scale characteristic. For this purpose, eight different feedback characteristics are implemented (cf. Table 2). The first four tactile features (V2.1 – V2.4) are composed of a sharp increase in intensity, a sharp decrease in intensity, as well as a symmetrical and asymmetrical increase in scale spacing. The second group of tactile features (V2.5 – V2.8) represents a combination of a symmetrical increase in the scale spacing with a sharp increase in intensity and a sharp decrease in intensity, as well as the combi- nation of an asymmetrical increase in the scale spacing with a sharp increase in intensity or a sharp decrease in intensity.
Test Person Thirty subjects participated in the study (15 males and 15 females). The ave- rage age of the subjects is 24.33 years (SD = 3.74 years, range: 19–35 years). The body height average is 174.03 cm (SD = 11.17 cm) and the corpulence average is 67.53 kg (SD = 13.48 kg). The majority of subjects have a college degree (53.30%) and are right-handed (86.70%). 56.70% do not practice a
Table 2. Tactile feature for coding a “middle” or a “preferred value”.
Table available in the original PDF paper.
Tactile Feature Intensity I0 Scale Spacing x0 Scale Spacing x1 Scale Spacing x2 Intensity I1 V2.1 60 % 30 mm 30 mm 30 mm 96 % V2.2 100 % 30 mm 30 mm 30 mm 63 % V2.3 100 % 30 mm 75 mm 75 mm 100 % V2.4 100 % 30 mm 75 mm 30 mm 100 % V2.5 60 % 30 mm 75 mm 75 mm 96 % V2.6 100 % 30 mm 75 mm 75 mm 63 % V2.7 100 % 30 mm 75 mm 30 mm 96 % V2.8 100 % 30 mm 75 mm 30 mm 63 %
Tactile Information Coding for Touchless Interaction With Medical Devices 155
fine motor hobby and do not play a musical instrument (60%). None of the subjects has circulatory disorders or arm, hand, or finger limitations, and the majority are non-smokers (96.70%).
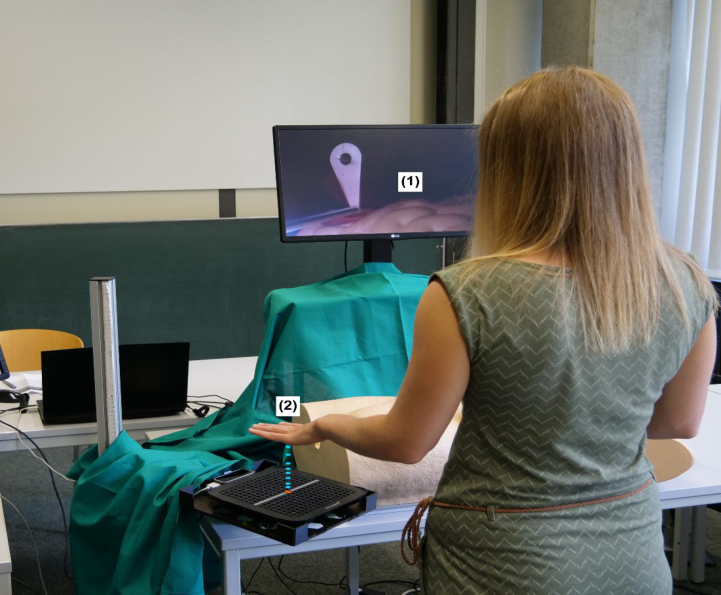
Test Person Study In the test-person study, the participants have to perform two parallel tasks, so the experimental setup consists of two components (see Figure 2). Similar to a surgery, the subject has to hold a surgical instrument in the form of a wire eyelet over a rod as still as possible in the minimally invasive laparo- scopic operating field with their dominant hand. Any contact with the edge of the eyelet (1) is recorded and is judged an error. The experimental setup is adjusted to the dominant hand of the participant. At the same time, as a secondary task, the subject has to perform various adjustment tasks with a virtual slider in the air (2).
The information transfer of the tactile perception channel is examined with regard to differences in the tactile scale characteristics. For this purpose, dif- ferent scale characteristics representing an “increase” or a “decrease” over the feedback intensity are played back to the subject as part of the secondary task. The subject’s task in the first part of the study is to distinguish between an “increase” or “decrease” in feedback intensity (see Table 1). The scale can be run several times. If the subject is sure about the scale characteristic, he is
Figure 2: Experimental setup with the main task (1) and the secondary task (2).
156 Schmid and Maier
asked to set the scale to position 6. Subsequently, the questions regarding the recognition of the scale characteristics as well as the classification regarding the indication of an “increase” or “decrease” are answered on the basis of a 7-step Likert scale. The scale ranges from 0 (completely unsuitable) to 6 (very well suited). The mental load of the adjustment task according to Borg (DIN EN ISO 9241-420, 2011) is also queried. In the second part of the study, the subjects are asked to evaluate the tactile features with regard to their suita- bility for the coding of a “middle of a scale” or a “preferred scale value”. Analogous to part 1, this subtest is also performed under the parallel exe- cution of the main and secondary task. Therefore, the tactile features from Table 2 are tested. For this purpose, the subject is asked to evaluate the tactile features with respect to its character to assign it to the coding of a “middle” or a “preferred value”. The subject can move over the scale several times. If the subject is sure about an assignment, he is asked to adjust the scale posi- tion directly to the right of the tactile feature and then rate the suitability for the representation of a “preferred value” or a “middle” using a 7-point Likert scale. The scale is evaluated using a 7-step Likert scale by means of pairs of opposites (0 ”completely unsuitable” and 6 “very well suited”). In addition, the mental load according to Borg (DIN EN ISO 9241-420, 2011) of the adjustment task is also queried.
RESULTS
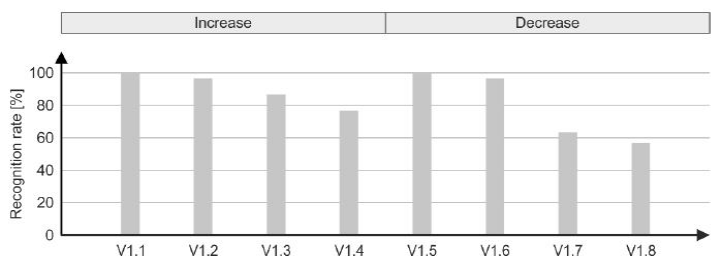
Figure 3 shows the recognition rate of the scale characteristics for the “incre- ase” and “decrease”. Figure 3 reveals that the correct recognition of the scale characteristics becomes more difficult as the difference between the start and end values of the intensity decreases. The best recognition rate of 100% achieve the scale characteristics V1.1 and V1.5. The lowest recognition rate achieves scale characteristic V1.8.
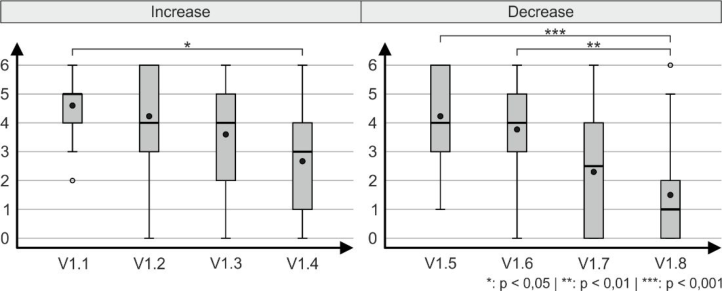
The same is reflected in the subjects’ evaluation of the suitability of the scale for the indication of an “increase” or “decrease” in Figure 4. With a decreasing difference between the start and end values, the evaluation of the suitability decreases. The best rating is given to scale characteristic V1.1 with Ø = 4.60. The worst rating in terms of suitability for indicating an
Figure 3: Recognition rate of the tactile scale characteristics increase or decrease.
Tactile Information Coding for Touchless Interaction With Medical Devices 157
“increase” is given to scale characteristic V1.4 (Ø = 2.67). For the indication of a “decrease”according to Figure 4, the scale characteristic V1.5 (Ø = 4.23) is best. The scale characteristic V1.8 (Ø = 1.50) is rated worst. This is also confirmed by the inference statistical investigation. Since a normal distri- bution can be negated, a Friedman test with subsequent Dunn-Bonferroni correction is performed for the evaluation of the scale characteristics with respect to an “increase” (X2(7) = 149.690, p < 0.001, n = 30) and a “decrease” (X2(7) = 145.845, p < 0.001, n = 30). Regarding the evalua- tion of an “increase”, a significant difference is evident between the scale characteristics V1.1-V1.4 (z = −3.320, p = 0.025, n = 30). Regarding the “decrease”, the evaluation differs highly significantly for the scale characte- ristics V1.5-V1.8 (z = −4.269, p < 0.001, n = 30) and very significantly for the scale characteristics V1.6-V1.8 (z = −3.584, p = 0.009, n = 30).
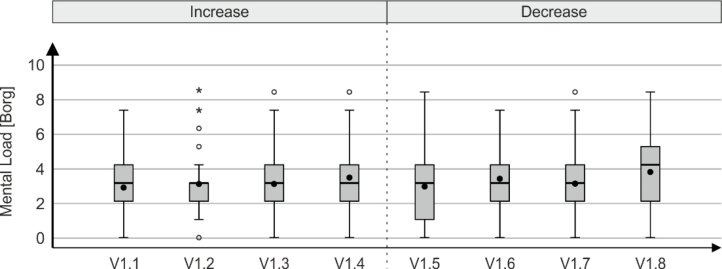
Figure 5 shows the mental load ratings of the scale characteristics. Scale characteristic V1.1 experiences the lowest mental load when indicating an “increase” (Ø = 2.90). The worst evaluation reaches V.1.4 with an average
Figure 4: Evaluation of the suitability (0 “completely unsuitable” to 6 “very well sui- ted”) of the scale characteristics for coding an “increase” or “decrease” along a tactile scale.Figure 5: Evaluation of mental load according to DIN EN ISO 9241–420 (2011) in terms of coding an increase or decrease.
158 Schmid and Maier
evaluation of Ø = 3.50. For the purposes of indicating a “decrease”, the smal- lest mental load for scale characteristic V1.5 (Ø = 2.98) is omitted, whereas the mental load for scale characteristic V1.8 (Ø = 3.82) is evaluated as the strongest.
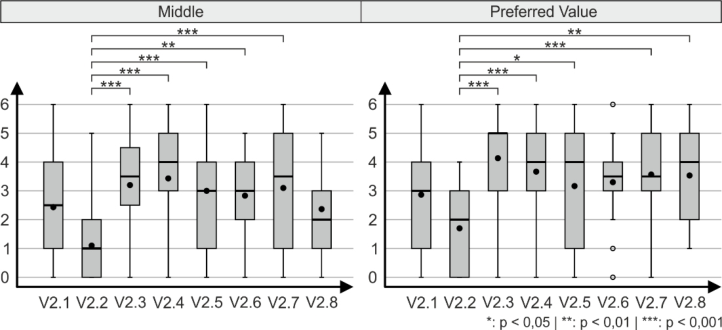
The evaluation of the tactile scale characteristics for coding a “middle” or a “preferred value” is shown in Figure 6. Based on the boxplot diagrams, it can be seen that scale characteristics with a change in the scale spacing (cf. V2.3 or V2.4) are on average better evaluated than a sole change in the feedback intensity in a positive or negative direction (cf. V2.1 or V2.2). For the coding of a “middle” on a tactile scale, tactile feature V2.4 (Ø = 3.43) is the most suitable, followed by V2.3 (Ø = 3.20) and V2.7 (Ø = 3.10). In terms of coding a “preferred scale value”, tactile feature V2.3 is the most suitable, with an average rating of Ø = 4.13. The least suitable is tactile feature V2.2 (Ø = 1.70). It can be seen that the tactile features are generally rated somewhat better for coding a “preferred value” than for coding the “middle of a scale”.
There is no normal distribution in the test data. Therefore, for the evalua- tion, a Friedman test for the “middle” (X2(7) = 44.046, p < 0.001, n = 30) and a Friedman test for the “preferred value” (X2(7) = 43.395, p < 0.001, n = 30) with a subsequent Dunn-Bonferroni post-hoc test are performed for the inferential statistical examination of the data in each case. Statisti- cally significant differences in the evaluation of the scale characteristics for the coding of a “middle” are mainly present with regard to tactile feature V2.2. Thereby, tactile feature V2.2 becomes very significant (cf. V2.2-V2.6 (z = 3.768, p = 0.005, n = 30)) and highly significant (cf. V2.2-V2.3 (z = −0.796, p < 0.001, n = 30), V2.2-V2.4 (z = −4.928, p < 0.001, n = 30), V2.2-V2.5 (z = −4.322, p < 0.001, n = 30), and V2.2-V2.7 (z = 4.954, p < 0.001, n = 30)) scored worse. To point out a “preferred value” on a scale, statistically significant differences are also present with respect to tactile
Figure 6: Evaluation of the suitability (0 “completely unsuitable” to 6 “very well suited”) for indicating a middle or a preferred value.
Tactile Information Coding for Touchless Interaction With Medical Devices 159
feature V2.2. The rating of coding feature V2.2, is compared to V2.5 signi- ficantly (z = −0.268, p = 0.030, n = 30), compared to V2.8 (z = −3.926, p = 0.002, n = 30) very significantly, and compared to V2.3 (z = −5.850, p < 0.001, n = 30), V2.4 (z = −4.348, p < 0.001, n = 30), and V2.7 (z = −0.322, p < 0.001, n = 30) highly significantly worse.
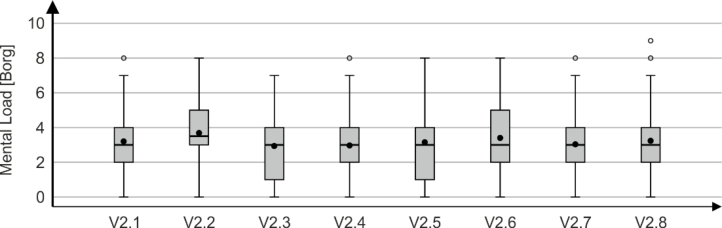
The evaluation regarding the mental load for the coding of a “middle” or “preferred value” is shown in Figure 7. In the context of this study, coding with tactile feature V2.3 (Ø = 2.93) exerts the lowest mental load. The stron- gest mental load for coding a “middle” or a “preferred value” is exerted by tactile feature V2.2 (Ø = 3.68). The mental load caused by coding an incre- ase in intensity (V2.1) or a decrease in intensity (V2.2) is perceived as more stressful than that caused by changing the scale spacing (cf. V2.3 or V2.4).
Figure 7: Evaluation of mental load according to DIN EN ISO 9241–420 (2011) in terms of coding a middle or a preferred scale value.
DISCUSSION
The results of the investigation show that the coding of an “increase” or “decrease” is possible with a linearly changing feedback intensity in the scale characteristic of a discrete tactile scale (cf. Figure 4 V1.1 and V1.5). Based on the changing intensity, it is possible to differentiate between an “increase” and a “decrease”. Focusing on the perception threshold, both “increases”and “decreases” are detected by more than 50% of the subjects. It is also evident from the tests (cf. Figure 3) that an “increase” or “decrease” with a smal- ler difference between the start and end values is perceived worse. A smaller difference in feedback intensity between the scale points is also classified by the subjects as less suitable. Whether an even steeper increase or decrease in feedback intensity would have led to better results needs to be investigated in more detail in future studies. For further studies, other scale characteri- stics such as a quadratic or exponential increase or decrease of the feedback intensity would be of interest. Furthermore, another coding possibility could be the scale distance. The coding of an “increase” or “decrease” via a con- densing or widening scale spacing could be investigated in further studies. The coding of a “middle” should be done by means of a sharp change in the scale spacing. According to this study, an asymmetric change of the scale spacing is best (see Figure 6 V2.4). The coding of a middle via a sole increase
160 Schmid and Maier
or decrease of the feedback intensity unsettles the subjects, which is why the suitability of this is considered worse than a single increase of the scale spa- cing. The combination of a change in scale spacing and a change in feedback intensity also does not lead to a better result. The worst rating is given to the sharp decrease of the feedback intensity (cf. Figure 6 V2.2). Due to the sharp decrease in feedback intensity, the scale position is hardly perceptible by the subjects, which results in an uncertainty regarding the recognition of the tactile feature. For the coding of a “preferred value” of a discrete tactile scale, the coding via a symmetric change of the scale spacing is most suitable (cf. Figure 6 V.2.3). A sole sharp decrease of the feedback intensity is poorly perceived by the subjects, analogous to the coding of a “middle”, and leads to an uncertainty about whether they have recognized the tactile coding feature. Also, combining the sharp change in intensity with the sharp change in scale spacing results in a worse result compared to the sole change in scale spa- cing. The mental load of the tactile coding features with a change in the scale spacing is rated lowest by the subjects and is stronger when combined with a sharp change in intensity or a sole change in intensity. Accordingly, coding via a sharp change in feedback intensity requires greater attention from subjects. Nevertheless, there is a need for further research on the finer differentiation of the change of the scale spacing.
CONCLUSION
It could be shown that it is possible to transfer information such as an “incre- ase” or “decrease”, the coding of a “middle”, as well as the coding of a “preferred value” via the tactile feedback of a discrete scale in the air. Regar- ding the coding of an “increase” or “decrease”, further research should be conducted regarding the shape of the scale in addition to a linear increase or decrease. The change in the scale spacing for the coding of a “middle” as well as for the coding of a “preferred value” is better perceived and the suitability is better evaluated by means of this coding possibility than by a sole inten- sity change. For tactile coding of a “middle” or a “preferred value”, further studies with more differentiated subdivisions of the scale spacing change as well as feedback intensity changes in a positive direction should be condu- cted. Lowering the feedback intensity to indicate a “middle” or a “preferred value” should be discarded according to this study.
ACKNOWLEDGMENT
This work is founded by the German Research Foundation (DFG) within the scope of the research project “Ultrasonic based tactile feedback design of a non-contact human-machine interface considering the user age” (DFG: 500499494).
REFERENCES
DIN 323 (1974). Normzahlen und Normzahlreihen - Blatt 1: Hauptwerte, Genauwerte, Rundwerte. Deutsches Institut für Normung e. V., Berlin.
Tactile Information Coding for Touchless Interaction With Medical Devices 161
DIN EN ISO 9241 (2011). Ergonomie der Mensch-System-Interaktion - Teil 420: Auswahlverfahren für physikalische Eingabegeräte. Deutsches Institut für Nor- mung e. V., Berlin. Hurstel, A., Bechmann, D. (2019). Approach for Intuitive and Touchless Interaction
in the Operating Room. J, 2(1), pp. 50–64. Schmid, P., Bader, M., Maier, T. (2020). Tactile Information Coding by Electrotactile Feedback. In: Proceedings of the 4th International Conference on Computer-Human Interaction Research and Applications. Schmid, P., Maier, T. (2021). Electro-Tactile Feedback to Provide Assistance to Tou-
chscreen Interaction of the Elderly. In: Proceedings of the AHFE 2021 Virtual Conference on Human Factors and Ergonomics in Healthcare and Medical Devi- ces, Advances in Human Factors and Ergonomics in Healthcare and Medical Devices, pp. 271–278. Stevenson, R. A., Schlesinger, J. J., Wallace, M. T. (2013). Effects of divided attention and operating room noise on perception of pulse oximeter pitch changes: a laboratory study. Anesthesiology 118, pp. 376–381. Winterholler, J. (2019). Haptische Informationsübertragung von Drehmomentver-
läufen im Kontext einer Haupt- und Nebenaufgabe. Universität Stuttgart, Institut für Konstruktionstechnik und Technisches Design, Dissertation.
LISTED IN THE AHFE DIGITAL BOOKSTORE CATALOGUE
Explore the complete digital volume
Healthcare and Medical Devices
Read this individual research paper free through the original publisher, or explore the full digital proceedings book.
ISBN 978-1-958651-55-1
Explore this ISBN in the AHFE Bookstore ↗Listed in the July 2026 bookstore catalogue; search by ISBN to confirm current availability · Digital book purchase optional