Heart rate variability (HRV) has been a useful tool for understanding human behavior. HRV features, derived from the inter-beat interval (RR) time series, reflect the autonomic nervous system processes of the body and have shown correlates with various mental processes. These processes include mental fatigue, workload, and anxiety, to name a few. Developing an understanding of these constructs in machines is key to improving human-computer interaction. However, HRV based emotion recognition is often limited to detection of negative (stress or anxiety) versus neutral emotional responses. Such systems when tested with subjects showing wider emotional responses may lead to errors. In addition to this, it is desirable for such emotion recognition systems to have high temporal resolution, thus allowing for almost real-time feedback and adaptive decision making. In this article, we explore the use of novel complexity-based feature set computed from so called ultra-short-term segments of 60 seconds. More specifically, we evaluate the potential of HRV features to distinguish stress vs. amusement vs. neutral vs. relaxation classes. Experiments using the WESAD database show that the proposed features extracted on ultra-short-term window of 60s and combined with benchmark features provide an overall improvement of 12.92 % balanced accuracy and 20 % F1-score over using only the benchmark features.
Most human functions, such as perception, rational decision-making, and learning, involve the regulation of emotions. The field of affective computing is therefore focused on developing machines that sense, recognize, respond to, and influence emotions (Picard, 2000). Development of such emotio- nal intelligence in machine systems can have applications in several domains including education, security, and healthcare (Daily et al., 2017). Emotions modulate various physiological processes by influencing the autonomic and central nervous systems and their correlates to various physiological signals have been reported (e.g., Clerico et al., 2018, Parent et al., 2019). This fact, paired with the recent development in wearable sensing technologies (Perez
and Zeadally, 2021) makes monitoring heart rate variability (HRV) a viable method for long-term, continuous, and unobtrusive emotion recognition.
HRV is an indicator of the changes in the autonomic nervous system and has traditionally been analyzed using time- and/or frequency-domain features. These features evaluate the contribution of the sympathetic and parasympathetic nervous systems (Camm et al., 1996) to the overall heart rate response. In order to compute these features, the inter-beat interval (RR) time series is extracted from the peaks of the QRS complex of an electrocardiogram (ECG) signal, or from peaks of pulses measured in a photoplethysmogram (PPG). Conventional clinical assessment of HRV has typically relied on long-duration time windows, around 24∼h. Short-term HRV analysis, in turn, has explored time durations as little as 5∼minutes and shown to achieve useful results (Camm et al., 1996).
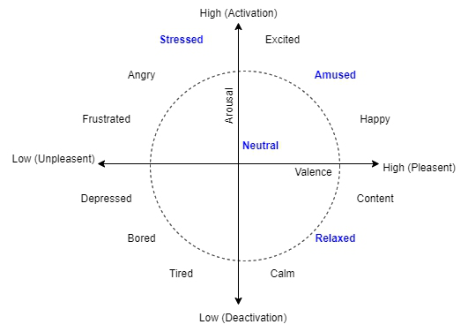
Though short-term analysis of cardiac processes has shown great utility for offline behavioural analyses, several applications exist in which faster time responses are needed (Castaldo et al., 2019), especially in life-saving situations such as first responders or healthcare workers. To this end, so- called ultra-short-term HRV analyses have been explored in which window durations smaller than 5∼minutes are used. While some applications have been reported in the literature (e.g., Castaldo et al., 2019, Tiwari et al., 2020, Zubair and Yoon 2020), these have been limited to detection of negative (such as stress or anxiety) vs neutral emotional states. These conditions are limited to the high-arousal low-valence quadrant of the valence-arousal representa- tion of affective states (see Fig. 1). As such, the transferability of these models to other quadrants and affective states has not yet been fully explored.
It is known that the RR time series exhibits complex non-linear behavior (Ashkenazy et al., 2001). This behavior changes based on different physical and psychological demands put on the body. Features quantifying this com- plexity have been recommended in the literature (Tiwari et al., 2019, Tiwari and Falk 2021). These include multi-scale entropy (Tiwari et al., 2019), as well as HRV high- and low-frequency subband complexity (Tiwari and Falk
Figure 1: Valence-arousal representation of affective states.
2021) features. As mentioned above, while these new features have shown improvements in prediction of negative affect (stress and anxiety), their use for a wider range of affective states has yet to be explored. This paper aims to fill this gap.
More specifically, in this paper we explore a 4-class classification task where relaxed, neutral, amused and stress states are monitored, thus cove- ring three of the four quadrants in the valence-arousal space (see Fig. 1). The multi-scale entropy and HRV subband features are extracted over ultra- short-term window sizes of 60s and experiments are conducted on the publicly available WESAD (wearable stress and affect detection) database. Experiments show that the proposed feature set provides important and com- plementary information for subject-independent affective state monitoring, thus opening doors for faster and more reliable assessments based on HRV analysis.
WESAD DATABASE The Wearable Stress and Affect Detection (WESAD) Database (Schmidt et al., 2018) is a multi-modal dataset aiming for human affective detection. The data collection protocol consisted of a 20 minute baseline (neutral) period, where the participants were reading magazines while waiting for the expe- riment to start. For amusement, the subjects were shown 11 funny video clips lasting a total of 392 seconds. Stress was elicited using the well-studied Trier Social Stress Test (TSST). This test lasted about 10 minutes. Finally, participants were relaxed using a 7-minute guided meditation exercise that includes controlled breathing. Clean data were collected from 17 subjects; each took part in a 2-hour section. The electro-cardiogram (ECG), sam- pled at 700∼Hz, used for this analysis was recorded using the RespiBAN chest-band (Biosignalsplux). Other signals recorded in this database include accelerometer, respiration, and blood volume pulse. Here, only the ECG data is used.
Typically, discrete emotional states can be mapped on the valence- arousal (VA) representation, as depicted by Fig. 1. Valence represents the unpleasant-pleasantness levels, whereas arousal corresponds to the deactivation-activation. Figure 1 highlights typical emotions seen in each of the four VA quadrants, with the ones highlighted in blue indicating the sta- tes available with the WESAD dataset and used herein. The state conditions elicited from the protocol correspond to as the ground truth labels. For more information on the database, the interested reader is referred to (Schmidt et al., 2018).
SIGNAL PROCESSING PIPELINE The ECG data for each emotional state was first epoched in 60s windows with 30s overlap. For the neutral state, the first 5 epochs (3 minutes) of data was rejected to account for transitional changes to ECG after the beginning of the experiment. Next, for each epoch, a simple pre-processing step using a bandpass filter (5-25∼Hz) was performed on the ECG signal
Improved Affect Prediction 15
to enhance the R-peaks. Following this, the RR time series was extracted using an energy-based QRS detection algorithm, which is an adaption of the popular Pan-Tompkins algorithm. The RR series was further filtered to remove outliers using range-based detection (>= 280 ms and <= 1500 ms), moving average outlier detection, and a filter based on percentage change in consecutive RR values (<= 20 %).
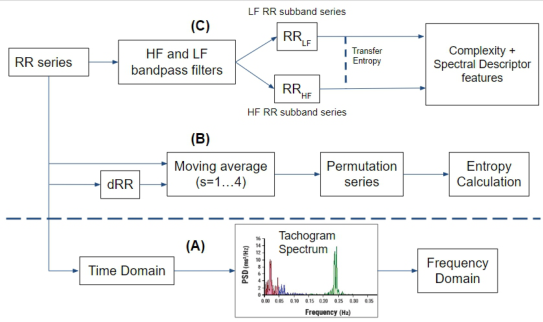
FEATURE EXTRACTION From the enhanced RR time series, standard time- and frequency-domain HRV features were extracted, as listed in Table 1. These features were also computed for each epoch of data (ultra-short-term duration of 60s, 30s overlap). These have been shown in the literature to correlate with mental workload (Tiwari et al., 2019) and stress (Castaldo et al., 2019). Complete details about these measures can be found in (Camm et al., 1996).
Multi-scale permutation entropy (MSE) features were calculated using a moving average scaling (scales, s = 1-4). These features were calculated both on the RR and absolute first difference of the RR (dRR) time series, as per (Tiwari et al., 2019). A moving average filter with a window size s first scales the time series, followed by permutation entropy calculation. Moving average scaling adds stability to entropy prediction for a short-time series (Wu et al., 2013) while permutation entropy provides added robustness to noise (Bandt and Pompe 2002).
Additionally, spectral descriptor and complexity features were extracted from the subband HRV series. The HRV subbands impact different phy- siological processing (Wu et al., 2009) as well as have useful non-linear coupling (Luo et al., 2018) behaviour. First, the RR series tachogram was band-passed in the LF (0.04-0.15 Hz) and HF (0.15-0.4 Hz) regions to result in the RRLF and RRHF subband series, respectively. Next, complexity features including correlation dimension, detrend fluctuation analysis (DFA), sample entropy (SampEn) and permutation entropy (PE) are extracted each subband series. Additionally, spectral descriptors including, centroid, spectral entropy, spread, skewness, kurtosis, and crest are extracted from the two frequency regions. In order to quantify the interaction between the two bands, LF-to-HF and HF-to-LF transfer entropy was also calculated.
Overall, a total of 13 benchmark and 30 proposed (8 multi-scale and 22 HRV-subband) features were extracted for the four different emotional states. The pipeline for extracting the benchmark and proposed features is shown in Fig. 2. For more information regarding the features, the interested reader is referred to (Tiwari et al., 2019, Tiwari et al., 2021).
Table 1. Benchmark HRV features extracted.
Table available in the original PDF paper.
Time domain features Frequency domain features Mean, standard deviation, RMSSD, pNN50, coefficient of variation, pNN20.
High- (HF), low- (LF), and very low- (VLF) frequency power, normalized LF and HF, HF/LF ratio
Figure 2: Processing pipelines for extraction of (A) Benchmark (B) Multi-scale entropy and (C) subband-HRV Features.
MACHINE LEARNING PIPELINE Three feature sets were explored for emotion prediction: benchmark alone, proposed alone, and fusion of both. For each of these feature sets, a subject-wise min-max normalization approach was used to account for inter- individual differences and help the model generalize to new subjects. Dataset imbalance during training can make minority class classification harder. Oversampling methods help by data augmentation of the minority class. As such, we make use of the Adaptive Synthetic Sampling Approach (ADASYN) for oversampling. This method generates more “harder-to-learn” examples for the classifier by accounting for majority class dominance near a mino- rity class sample (Lemaitre et al., 2017). For classification purposes, linear models can be more easily interpreted and provide information about fea- ture importance, thus are used in our study. Additionally, logistic regression has the advantage of being tolerant to high-dimensional datasets. As such, the classification results reported herein can be considered as a lower bound on possible achievable performance and higher accuracy could be achieved with more complex models (this is left for future study). The classifier was used for performing 4-way classification between stress (S) vs. amusement (A) vs. neutral (N) vs. relaxed (R). To ensure generalizability of the model over new subjects, the evaluation was done using a leave-one-subject-out cross-validation setup.
For performance evaluation, balanced accuracy (BACC) and weighted F1-score (F1) were used as figures-of-merit along with class-wise accuracy. Moreover, to assess feature importance the minimum redundancy maximum relevance (mRMR) (Peng et al., 2005) feature selection approach was used. The machine learning pipeline was built and evaluated using the python scikit learn (Pedregosa et al., 2011) and imbalanced learn (Lemaitre et al., 2017) packages. Overall, classifiers were trained with the top-10 features for all feature sets, as selected by mRMR. In order to assess the importa- nce and generalizability of features, we analyze the list of most frequently
Improved Affect Prediction 17
selected top features (features appearing at-least 80 % of the time across all subject-independent models).
RESULTS
Classification results for the three tested feature sets are shown in Table 2. As can be seen, the proposed feature set by itself is not able to outperform the benchmark features. However, the proposed set provides complemen- tary information that can further boost performance once fused together. In fact, gains of 12.9 % BACC and 20 % F1 were achieved with the fused set relative to the benchmark set alone and of 24.7 % BACC and 23.2 % F1 relative to the proposed set. Looking at the class-wise accuracy, it can be observed that the benchmark features are able to distinguish stress vs. no stress cases with high accuracy (S-ACC = 0.916) compared to the proposed features (S-ACC = 0.764). However, for the other classes, the proposed fea- ture set either gives a comparable (for amusement) or higher performance (8.1 % for relaxed and 7.4 % for neutral) compared to benchmark feature set. With the fused set, a slight drop in accuracy is seen for stress class perfor- mance (−1.52 %), while further improving performance on the other three classes. Overall, improvements of 7.67 % for neutral, 3.81% for amusement, and 17.2 % for relaxed states, respectively, could be seen relative to baseline alone. Overall, the combined feature set is better able to distinguish between the high valence emotional states compared to benchmark features. This is specially true for neutral and relaxed state, given the larger improvement seen in performance.
Lastly, Table 3 lists the top consistent features. Of the 6 feature which consistently appear in the top feature set, only 2 are from the benchmark feature set. These include the RMSSD and LF power. RMSSD is an indica- tor of parasympathetic activity while sympathetic activity is marked by an
Table 2. Performance for different feature sets (S = Stress, A = Amusement, N = Neutral, R = Relaxed).
Table 3. Features appearing in the top feature set for most subjects.
Table available in the original PDF paper.
Equation reproduced from the original PDF.
increase in LF power. Stress is usually associated with a decreased parasym- pathetic and an increased sympathetic response (Kim et al., 2018). These features have previously been correlated with emotional changes in the lite- rature (Kim et al., 2018, Mccraty et al., 1995, Shi et al., 2017). The remaining four features (including the top 3) are all from the proposed feature set. More specifically, 3 of the features are from the subband HRV features while one is a multi-scale entropy feature. The top feature which was in the selected fea- ture set for all subjects is the multi-scale entropy calculated on the dRR series for a scale of 4. The non-linear behavior of the dRR series and its relevance for heart rate disease detection was previously explored in (Ashkenazy et al., 2001). More recently, the complexity of the dRR series was important for mental workload prediction in the presence of physical activity (Tiwari et al., 2019). Fifty percent of the top features being from the HRV subband feature set further underscores the importance of separately characterizing the non- linear and spectral characteristics of LF and HF band behaviors of the RR time series (Tiwari et al., 2021). Sample Entropy of the RRHF series is the 3rd most commonly occurring feature across subjects. Previously, non-linear beh- avior of the HF band has been associated with circadian (sleep/wake) effects which were independent of HRV change due to age (Wu et al., 2009). More- over, a higher scale value corresponds to the importance of low frequency components (sympathetic activity) of RR series. This is further evident by two-thirds of the top features related of LF component of HRV.
CONCLUSION
In this work, we explored the use of ultra-short-term HRV complexity fea- tures for a multi-class emotion classification task. Experimental results show the importance of the proposed features, as well as their complementarity to benchmark HRV features. With the fused set, an improvement of 20 % in F1-score could be seen relative to using the benchmark set alone. Analysis of class-wise accuracy further validates the use of the combined feature set for affective state detection across the valence-arousal space, thus improving on previous work that focused on just one such quadrant. Analysis of the top features shows the importance of the proposed features, as well as separately characterizing LF and HF behaviours of the RR series, and the importance of the LF band in overall emotion recognition.
ACKNOWLEDGEMENT
The authors would like to thank MITACS and Myant Inc.
REFERENCES
Ashkenazy, Yosef, et al. “Magnitude and sign correlations in heartbeat fluctuations.
“Physical Review Letters 86.9 (2001): 1900. Bandt, Christoph, and Bernd Pompe. “Permutation entropy: a natural complexity measure for time series.” Physical review letters 88.17 (2002): 174102.
Improved Affect Prediction 19
Camm, A. John, et al. “Heart rate variability: standards of measurement, physiological interpretation and clinical use. Task Force of the European Society of Cardiology and the North American Society of Pacing and Electrophysiology.” (1996): 1043–1065. Castaldo, Rossana, et al. “Ultra-short term HRV features as surrogates of short
term HRV: A case study on mental stress detection in real life.” BMC medical informatics and decision making 19.1 (2019): 1–13. Clerico, Andrea, et al. “Electroencephalography amplitude modulation analysis for automated affective tagging of music video clips.” Frontiers in computational neuroscience 11 (2018): 115. Daily, Shaundra B., et al. “Affective computing: historical foundations, current appli-
cations, and future trends.” Emotions and affect in human factors and human computer interaction (2017): 213–231. Kim, Hye-Geum, et al. “Stress and heart rate variability: A meta-analysis and review of the literature.” Psychiatry investigation 15.3 (2018): 235. Lemaître, Guillaume, Fernando Nogueira, and Christos K. Aridas. “Imbalanced-
learn: A python toolbox to tackle the curse of imbalanced datasets in machine learning.” The Journal of Machine Learning Research 18.1 (2017): 559–563. Luo, Daiyi, et al. “The interaction analysis between the sympathetic and parasympathetic systems in CHF by using transfer entropy method.” Entropy 20.10 (2018): 795. McCraty, Rollin, et al. “The effects of emotions on short-term power spectrum analy-
sis of heart rate variability.” The American journal of cardiology 76.14 (1995): 1089–1093. Parent, Mark, et al. “A multimodal approach to improve the robustness of physiological stress prediction during physical activity.” 2019 IEEE International Conference on Systems, Man and Cybernetics (SMC). IEEE, 2019. Pedregosa, Fabian, et al. “Scikit-learn: Machine learning in Python.” the Journal of
machine Learning research 12 (2011): 2825–2830. Peng, Hanchuan, Fuhui Long, and Chris Ding. “Feature selection based on mutual information criteria of max-dependency, max-relevance, and min-redundancy.” IEEE Transactions on pattern analysis and machine intelligence 27.8 (2005): 1226–1238. Perez, Alfredo J., and Sherali Zeadally. “Recent advances in wearable sensing
technologies.” Sensors 21.20 (2021): 6828. Picard, Rosalind W. Affective computing. MIT press, 2000. Schmidt, Philip, et al. “Introducing wesad, a multimodal dataset for wearable stress and affect detection.” Proceedings of the 20th ACM international conference on multimodal interaction. 2018. Shi, Hongyu, et al. “Differences of heart rate variability between happiness and
sadness emotion states: a pilot study.” Journal of Medical and Biological Engi- neering 37.4 (2017): 527–539. Tiwari, Abhishek, and Tiago H. Falk. “New measures of heart rate variability based on subband tachogram complexity and spectral characteristics for impro- ved stress and anxiety monitoring in highly ecological settings.” Frontiers in Signal Processing 1 (2021): 737881. Tiwari, Abhishek, et al. “Multi-scale heart beat entropy measures for mental
workload assessment of ambulant users.” Entropy 21.8 (2019): 783. Tiwari, Abhishek, et al. “Prediction of stress and mental workload during police academy training using ultra-short-term heart rate variability and breathing analysis.” 2020 42nd Annual International Conference of the IEEE Engineering in Medicine & Biology Society (EMBC). IEEE, 2020.
Wu, Guo-Qiang, et al. “Chaotic signatures of heart rate variability and its power spectrum in health, aging and heart failure.” PloS one 4.2 (2009): e4323. Wu, Shuen-De, et al. “Modified multiscale entropy for short-term time series
analysis.” Physica A: Statistical Mechanics and its Applications 392.23 (2013): 5865–5873. Zubair, Muhammad, and Changwoo Yoon. “Multilevel mental stress detection using ultra short pulse rate variability series.” Biomedical Signal Processing and Control 57 (2020): 101736.
LISTED IN THE AHFE DIGITAL BOOKSTORE CATALOGUE
Explore the complete digital volume
Human Factors and Wearable Technologies
Read this individual research paper free through the original publisher, or explore the full digital proceedings book.
ISBN 978-1-958651-61-2
Explore this ISBN in the AHFE Bookstore ↗Listed in the July 2026 bookstore catalogue; search by ISBN to confirm current availability · Digital book purchase optional