Xiao Zhang, Qiang Li, Jianwei Niu, Xiao Chen, Yuanyuan Zu (2023). A Novel Method for Evaluating the Comfort of Helmets. In: Human Factors and Wearable Technologies. AHFE Open Access, vol. 85, pp. 121–127. https://doi.org/10.54941/ahfe1003633
With the integration of helmets and functional accessories, wearers' fatigue would be accelerated. Therefore, the suitability and comfort of helmets become the most critical factors for the final promotion and application. In this work, the effects of average pressure distribution(APD) for five different types of helmets on five areas (front, rear, left, right, and top) of the head surface under static and multi-coupled degrees of freedom rotation conditions (30mm vertical vibration, 15 ° pitching movement, 15 ° flip movement, 15 ° azimuth movement) were analyzed. The results show that #B helmet has a uniform distribution of APD on the head, making it the most comfortable, while the #E helmet has the most uneven APD on the head, with greater pressure on the top of the head compared to the other four helmets, indicating that the comfort of the E helmet is poor, It may be that the pad system of #E helmet does not restrain and support the circumference of the head, the entire mass of the helmet acts on the top area of the head. Combined with many wearers ’ feedback suggestions, the dispersity of helmet pressure (DHP) under static conditions and helmet-following(HF) under dynamic conditions are considered as two extremely critical indicators for assessing helmet comfort. The results indicated that the DHP was positively correlated with HF performance, The smaller the DHP of the helmet in static state, the better the HF stability of the helmet in dynamic state. Therefore, this present work proposes indicators that affect helmet wearing comfort from the perspective of ergonomics, which can objectively and quantitatively evaluate helmet wearing comfort in the market.
As an important equipment for personal protection, wearing a uncomfortable helmet may cause local fatigue, pain, and reduced ergonomics in the head and neck of the wearer. Therefore, the comfort of helmets, as an important consideration standard for the humanized design, is crucial in the field of helmet ergonomics.
The main focus for helmets are on the helmet shell, ensuring its stif- fness and strength, and avoiding head damage from collisions. The research
methods used include center of gravity measurement (Bastnik, 1982), head feature description (Robinette 1992), and dynamic response of the head- helmet biomechanical system to impact force (Randall 1981). A commonly used method is to establish a finite element model of the head-helmet system to study the degree of helmet damage and energy absorption under different impacts (bullet impact helmet (Guo and Xing 1998), helmet object collision (Mills et al. 2009; Ghajari et al. 2010; Pinnoji et al. 2010)).
At present, studies on pressure comfort has been conducted by Jia Xiaoh- ong et al. (Jia et al. 2012) on the impact of helmet mass and center of mass on the neck muscle strength of military aircraft pilots. The main use of Any- body’s muscle-bone model was to study the impact of helmet mass and center of mass position on the sternocleidomastoid and hemispina ceps muscles. The experimental results can provide qualitative or quantitative references in the design and use of helmets. Secondly, researches on comfort also explores the material of helmet liners, which mainly studies the softness and hardness of the helmet liner material itself, storage conditions, as well as the strength and deformation in impact deformation experiments to infer its comfort. Rueda et al. (Rueda et al. 2009) obtained the most suitable helmet-lining structure in different situations by simulating several standard certification experiments related to helmets. Shuaib et al. (Shuaeib et al. 2007) studied and confirmed the feasibility of using foamed polypropylene as a motorcycle helmet liner material. Response surface methodology was used to optimize the design of the helmet, and the effects of different material properties on the helmet were studied. However, the current research has the following problems: only infer- ring the comfort level of helmets through simulation technology and model experiments, and there is relatively little research on evaluating the comfort level of helmet head pressure from an ergonomic cognitive perspective.
This paper mainly proposes an novel evaluation method of helmet com- fort performance from the perspective of ergonomics, focusing on the two key indicators of the Dispersity of helmet pressure (DHP) under static con- ditions and helmet-following (HF) stability under dynamic conditions. Five different types of helmets under static and muti-coupling degrees conditions were tested and the impact of different helmet-linings including pad type, net-bag type and top-net type on the wearing performance were explored.
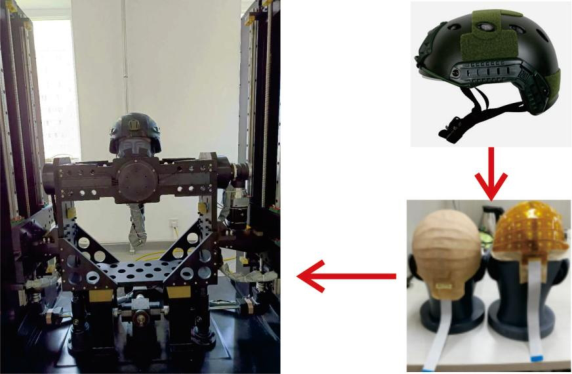
Introduction to the Original Helmet Comfort Evaluation Platform (HCEP) This work is mainly based on the Helmet Comfort Evaluation Platform (HCEP), which made by our own laboratory (as shown in Figure 1), which mainly consists of a standard head mold series, a pressure acquisition head cover (PAHC) distributed by a flexible sensor array, and a multi degree of freedom servo turntable.
The standard head mold series includes seven types of head molds that combine the characteristics of Chinese men’s head shapes, with the high- est coverage of “round-height” head mold (accounting for approximately 48.06%) being used for helmet comfort performance testing. The PAHC is uniformly distributed with 116 flexible sensor arrays, which can accurately
A Novel Method for Evaluating the Comfort of Helmets 123
measure the head pressure distribution when wearing protective headgear such as helmets and safety helmets. The servo turntable can simulate multi degree of freedom motion conditions such as vertical vibration, pitch, flip, azimuthal at different frequencies and amplitudes, achieving simulation of the motion environment of the human wearing a helmet in the reality, such as walking, running, jumping, and other movements. In this work, the wor- king condition of multi-coupling degree motions refer to the coupled motion of four working conditions: pitch along y axis, flip along x axis, azimuthal along z axis ( 1Hz, 15
), and vertical vibration (20cm, 1Hz).
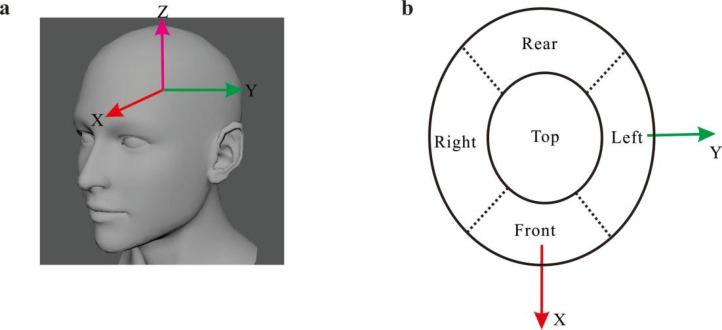
Helmet Comfort Evaluation Indicators and Data Analysis Before analyzing the comfort of helmets, we divided them into five parts based on the contact area between the helmet and the head: the anterior region (forehead), the posterior region (occipital region), the left and right regions (temporal bone region), and the central region (parietal bone region), as shown in figure 2. Five tests were conducted on each five different types of helmets (#A, #B, #C, #D and #E) and average AHP were calculated.
Dispersity of helmet pressure (DHP): the absolute value of the vector sum of the product of the pressure value of each point and its three dimensio- nal coordinate values, corresponding to the wearability problem: evaluate the Dispersity of the pressure distribution around the helmet. The larger the value, the more uniform the pressure distribution around the helmet.:
2
[Equation or mathematical symbol available in the original paper PDF]
[Equation or mathematical symbol available in the original paper PDF] q
q
n X
n X
DHP =
(1)
xi2 + yi2 + zi2 −1
Fj
xj2 + yj2 + zj2 [Equation or mathematical symbol available in the original paper PDF]
[Equation or mathematical symbol available in the original paper PDF]Fi
v u u u t1 n
n
Equation reproduced from the original PDF.
Fi , Fj are the pressure exerted on the i th and j th measuring points, xi, yi, zi are the x, y, and z coordinates of the i th measuring point, xj, yj, zj are the x, y, and z coordinates of the j th measuring point.
Figure 2: (a)Position of the coordinate axis of the head mold and (b) division of the head surface area contacted with the helmet.
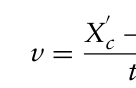
Helmet-following (HP): the instantaneous movement speed of the pressure center is calculated as follows:
′ c −Xc
Equation reproduced from the original PDF.
t . (2) Average Pressure Distributions (APD) Effects on Five Regions of Head Surface
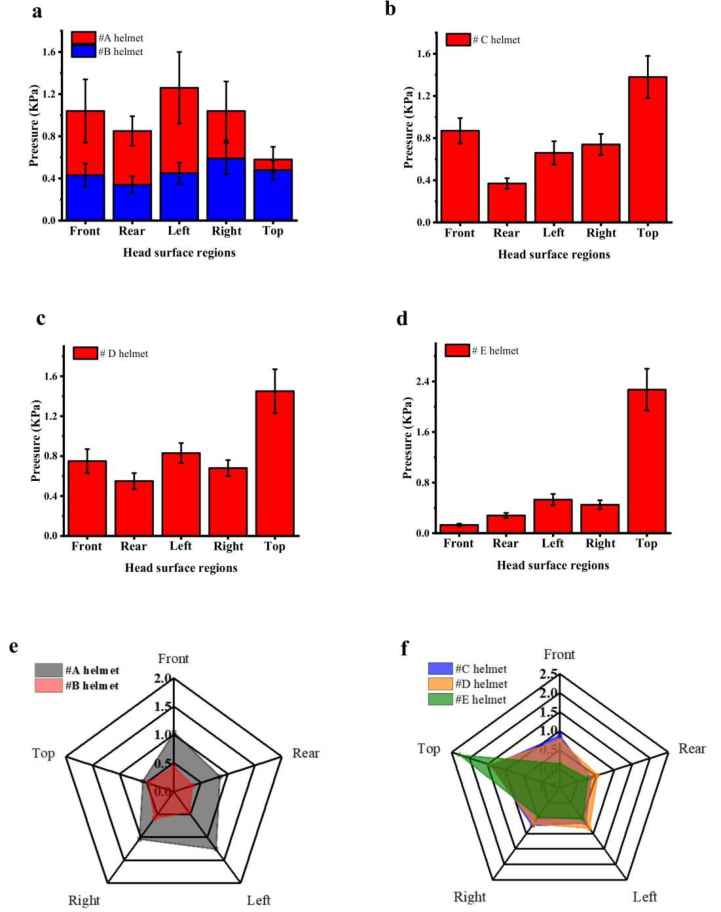
Figure 3 shows the APD for five types of helmets. Compared to #A helmet, # B helmet experiences less average pressure in all five areas of the head, indicating that wearing # B helmet is more comfortable than # A helmet. This result is consistent with the subjective wearing feeling of these helmet. The red area in radar chart (Figure 3e) represents the average pressure of #B helmet in each area above the head. the dispersity of helmet pressure (DHP) is smaller than #A helmet, indicating that #B helmet is better than Fast helmet in wearing performance. We infer that the helmet suspension system plays an important role in restraining and supporting the head, thereby sharing the direct pressure of helmet mass on the head.
Figures 3b-d show the APD of #C, #D and #E helmet, respectively. The results show that the average pressure of these three helmets in the top area of the head is higher than that of the other four regions, and the pressure of
Table 1. Characteristic attributes of five helmets.
Table available in the original PDF paper.
Helmet No. Mass of helmet(kg) APD(KPa) DHP HP Front Rear Left Right Top
A Novel Method for Evaluating the Comfort of Helmets 125
Figure 3: APD for five helmet. (a) Pressure distribution diagram of #A and #B helmets acting on the surface of the head mold; (b) #C, (c) #D and (d) #E helmet APD on the surface of the head mold; Radar chart of APD for #A and #B helmet (e) and #C, #D and #E helmet (f).
#E helmet in the top area is the highest among these three helmets, as shown in the bar chart. According to the radar chart of the average pressure of these three helmets, the APD of #C and #D helmet in each five area of the head is similar, and the DHP values of the two helmets are also similar. The DHP value of #E helmet is large than the other helmets, which is mainly reflected the APD in the top region is far greater than the other four areas of the head. It may be that the pad system of #E helmet does not restrain and support the
circumference of the head, the entire mass of the helmet acts on the top area of the head.
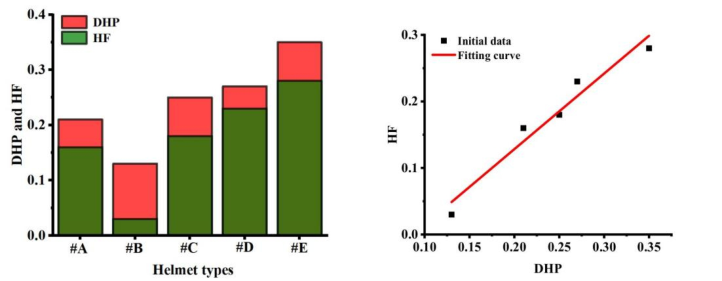
Analysis of DHP and HF Relationships Combining subjective feedback from wearers, obtaining the helmet’s DHP under static conditions and HP under dynamic conditions are two crucial indicators for evaluating the helmet’s comfort performance. Therefore, this work analyzed the DHP and HF relationships.
As shown in Figure 4a, the relationship between static DHP and dynamic HF of five helmets shows that the DHP of #B helmets is the smallest under static conditions, while the #E helmet is the largest, indicating that the APD of #B helmets is the most uniform under static conditions and the wearing comfort is the best. However, pressure distribution of #E helmet is uneven, which may lead to excessive pressure in local area and small force in other areas,. This result is consistent with the average pressure trend in the five regions; The DHP of #B, #C and #D are very similar under static conditi- ons, which indicates that the pressure distribution of these three helmets is relatively uniform and the wearing comfort is good.
Figure 4: Cyclic voltammetry (CV) curves of (a) GF and (b) PANI/GF at different scan rates from the inner to outside (10, 20, 50, and 100 mV·s–1). (c) CV curves of GF and PANI/GF at a scan rate of 100 mV·s–1. (d) EIS analysis of wearable/flexible supercapacitors.
Further, we studied the relationship between static DHP and dynamic HF, in which the dynamic situation is mainly coupling of multiple working condi- tions (30mm vertical vibration, 15
pitching movement, 15
flip movement, 15
azimuth movement). Fitting of the original data of DHP and HF perfor- mance shows that there is a strong linear relationship, as shown in Figure 4b. the equation corresponding to the fitting curve is as follows: yHF = 1.14xDHP −0.1. (3)
CONCLUSION
This work mainly carries out ergonomic research related to the wearing per- formance of five different types of helmets. In the evaluation method, the
A Novel Method for Evaluating the Comfort of Helmets 127
head surface contacted to helmets was divided into five regions (front, rear, left, right and top) to analyze the average pressure distribution applied by the helmet. Dispersity of helmet pressure (DHP) under static state and helmet following (HP) under multi-coupling freedom motions (30mm vertical vibra- tion, 15
pitching movement, 15
flip movement, 15
azimuth movement) were explored and suggested that DHP and HP have positive linear cor- relations. Furthermore, the relationships between helmet-lining and helmet comfort performance will also need to explore, such as pad type, mesh-pocket type and so on. This research will provide strong scientific support for the design and development of helmets in the early stage, iterative updates in the intermediate stage, and objective evaluation of the comfort of finalized products.
REFERENCES
A. B. Bastnik. (1982). “A method for determining the center of mass of helmets”, USA Army Natick R&D center, pp. 432–443. F. M. Shuaeib, A. M. S. Hamouda and S. V. Wong, et al. (2007). “A new motor-
cycle helmet liner material: The finite element simulation and design of experiment optimization”, Materials & Design, Volume 28, pp. 182–185. F. Rueda, L. Cui and M. D. Gilchrist. (2009). “Optimization of energyabsorbing liner for equestrian helmets. Part I: Layered foam liner”, Materials & Design, Volume 30, pp. 3405–3413. J. J. Guo and H. Y. Xing. (1998) “Calculation and test of the hitting force of firing bul-
lets proof helmets”, Systemic Engineering and Electronical Technology, Volume 6, pp. 6–8. K. M. Robinette and J. J. Whitestone. (1992). “Methods for characterizing the human for the design of helmets” Wright-patterson Air Force Base, Volume 3, pp. 397–409. M. Ghajari, S. Peldschus and U. Galvanetto, et al. (2010). “Influence of the body
on head rotational acceleration in motorcycle helmet oblique impact tests”, Pro- ceedings of the International Research Council on the Biomechanics of Injury conference, Volume 38, pp. 95–106. N. J. Mills, S. Wilkes and S. Derler, et al. (2009). “FEA of oblique impact tests on a motorcycle helmet”, International Journal of Impact Engineering, Volume 36, pp. 913–925. P. K. Pinnoji and P. Mahajan. (2010). “Analysis of impact-induced damage and dela-
mination in the composite shell of a helmet”, Material & Design, Volume 31, pp. 3716–3723. R. B. Randall. (1981). “An investigation of the effects of the DH-132 helmet7 suspension system upon perceived helmet weight under static conditions”, U. S Army Human Engineering Laboratory, Maryland, pp. 251–259. X. H. Jia, J. B. Mao and R. C. Wang, et al. (2012). “Effect of helmet mass and
mass center on neck muscle strength in military pilots”, Journal of Medical Biomechanics, Volume 27, pp. 416–420.
LISTED IN THE AHFE DIGITAL BOOKSTORE CATALOGUE
Explore the complete digital volume
Human Factors and Wearable Technologies
Read this individual research paper free through the original publisher, or explore the full digital proceedings book.
ISBN 978-1-958651-61-2
Explore this ISBN in the AHFE Bookstore ↗Listed in the July 2026 bookstore catalogue; search by ISBN to confirm current availability · Digital book purchase optional