Hüseyin Şahan, Sultan Ceren Öner, Ahmet Tugrul Bayrak, İlker Baştürk, Olcay Taner Yıldız (2023). Evaluating Performance of Restaurant POS Processes in Fast-Food Restaurants. In: Application of Emerging Technologies. AHFE Open Access, vol. 115, pp. 28–34. https://doi.org/10.54941/ahfe1004299
There are billions of operations happening in a wide range of sectors on a daily basis. When it comes to the hospitality sector, it appears essential to handle POS operations in a more efficient way in restaurants. To fill the gap in the studies about event log data in the fast food restaurant POS context, an approach needs to be developed. Regarding these, in this study, restaurant event log data for taking orders are comprehensively analyzed using process mining principles and machine learning applications to increase productivity. After the discovery of processes, the bottlenecks of the existing system were extracted in fast food restaurant point of sale (POS). The main focus was determined as order-taking process times, which can be the most troubled part of the fast food delivery process. Regression analysis was conducted to identify possible reasons for increasing time for order taking in a restaurant pos. This analysis can extract the main drawbacks of the system and provide insights to solve problematic points in order to increase productivity. Process discovery techniques, such as heuristics miner, directly follows graph (DFG) are used under process mining methodologies to discover event logs in a visual manner in the background. To be able to understand the logic of event logs deeply, exploratory data analysis techniques were performed to identify the effect of log activity types by also focusing on their respective attributes. Afterwards, it needed to adopt performance analysis, comparative, and action-oriented process mining techniques to evaluate, identify, and operationally support the business. In addition to process mining approaches, feature engineering, descriptive statistics techniques and outlier elimination are used along with various regression methods such as XgBoost, Random Forest to identify the relationship between variables of the system. The detailed descriptions of the feature relations are also explained to understand how variables affect the order taking time directly or indirectly. After that, the study found possible reasons, such as how many products are sold or how many different operators are working on that POS, affecting ordering time and how much they are specific to its context. By identifying these reasons, it is shown that order-taking processing times in a restaurant POS can be dramatically decreased with specific recommended actions in particular contexts. By applying research findings, order-taking process times are expected to improve by around 21% in a territorial business, which implies productivity growth in POS environments. Consequently, the study first showed how different techniques can be used to identify outliers in relationship metrics in restaurant POS event log data. Secondly, it is a direct, crucial example of what factors affect a restaurant's POS processes and how much. Meanwhile, it significantly suggests machine learning integrated process mining approaches by combining the mentioned techniques. Lastly, the paper can reveal how efficient this process structure is for operator usage, which is a question of further study.
Evaluating Performance of Restaurant POS Processes in Fast-Food Restaurants 29
INTRODUCTION
There are billions of transactions occurring in fast-food restaurants that are involved in the Food and Beverage Industry. According to the National Restaurant Association in the U.S., $997 billion in sales are expected during 2023 in the F&B sector, proving the previous statement (National Restau- rant Association, 2023). Thus, it becomes essential to enhance processes conducted in fast-food restaurants. In the study of Sherly E. Kimes, the impor- tance of case studies about technological adaptations of restaurants affecting revenue is put forward by considering the effect of reduced order-taking time (Kimes, 2008). Consequently, it becomes crucial to gain more control over processes and provide continuous improvement on Point of Sale (POS) pro- cesses to increase sales, thus revenue (Ojeda and Ramos, 2017). Moreover, the term Service Level Agreement (SLA) needs to be fulfilled in the business field as another concern of improvement.
In the process mining field, the prediction of the duration of processes is highly studied by using various machine learning techniques such as Naïve Bayes Classifiers, Support Vector Machines (SVM) and different methods such as non-Markovian Stochastic Petri-Nets, evolutionary decision rules (Polato et al., 2014; Rogge-Solti and Weske, 2015; Márquez-Chamorro et al., 2017). Also, there are various papers dealing with correlations root cause analysis from process-related characteristics perspective in addition to event logs only (de Leoni et al., 2016; Suriadi et al., 2013; Ferreira and Vasilyev, 2015). The methods in those studies are especially used for clustering event logs and identifying causal relationships. However, they focus more on the process mining side of the duration prediction problem instead of consid- ering other respective attributes (Aalst et al., 2011). Moreover, many case studies are conducted belonging to various sectors within those works to prove the suggested techniques. However, the point of sale context, espe- cially in fast-food restaurants, is not studied with the combination of process mining and regression techniques. Thus, this study suggests an industrial application of suggested methods in a restaurant environment differing from existing studies in the field. More on this, different regression methods and their performances are evaluated to understand the causal relationships. Most importantly, the performed methodology can be studied and generalized into any process mining-related business with specific adjustments for further study.
PROCESS MINING Event logs can be held as one of the control mechanisms in the taking pro- cess in restaurant management systems. Early founders of Will Van Der Aalst defined that a very simple event log consists of three components: case, activ- ity, and timestamp. The case refers to the single process instance related to the processes happening in specific contexts, such as POS in this case. Mean- while, activity is the action occurring in these single instances, and they have their respective timestamp indicating when these activities are performed. An event log, on the other hand, can have various attributes answering different questions, such as who conducts that operation. With various adaptations,
30 ¸Sahan et al.
event logs can light on many questions: what happened in the past, how the process is executed, what may happen in the future, etc. Event log data are often saved into a data warehouse in raw format (Van der Aalst, 2016). The extraction and correction are needed to reach the demanded analysis as post-processing. After the manipulation of data to specific formats, process discovery, conformance checking, performance analysis, comparative, pre- dictive and action-oriented process mining are encountered as six frequently used process mining types. Upon these steps, one can gradually reach process models, conformance diagnostics and predictions or improvements (Van der Aalst, 2022). Considering their outcomes, performance analysis, compara- tive and action-oriented process mining are studied in this paper to shed on questions of the objective. In the background, process discovery techniques such as Directly Follows Graph, Heuristics Miner and comparative process mining approaches are used to visualize event logs and to identify bottleneck activities, respectively.
DATA SUMMARY AND TRANSFORMATION Event log data of fast food restaurants is extracted from a database in a raw format, including its respective features such as operator, manager, and order type, in addition to standard event log components: case, activity and times- tamp. In this setting, each row represents an activity occurring, and there are around 12 different activities at most executed in each case, or it can be referred to as a sale. These activities represent the operations held by the operator during the sales operation. These activities can be starting a POS order, selling an item, applying payment, etc.
The data consists of 423 fast-food restaurants continuing their operation in Turkey during March 2023. There are 1369 Points of Sale in these restau- rants in total. To be able to understand the duration of sales operations, an aggregation among POS enables the creation of specific features that can affect duration instead of analysis of individual sales operations. However, it can be studied as a further study after discovering the dynamics of each POS. Consequently, the following features are extracted among sales grouped by POS after the analysis of event logs;
Amount of sales operations in total conducted by POS monthly
Total number of days POS working in a month
Number of distinct operators working in that POS
Number of distinct activities occurring in that POS
Mean amount of products sold in operations
Total number of returns from payment
Total number of order cancellations In addition to those factors extracted, the mean duration of sales oper- ations are defined as a dependent variable that is subject to analysis. As a final remark in this section, operator experiences, manager experiences, peak hours operations, product types, and their amounts can also be integrated into this setup as further analysis.
The standardized POS operation duration is defined as 60 seconds by domain experts. However, comparably, the 12.5% of 1369 Points of Sale
Evaluating Performance of Restaurant POS Processes in Fast-Food Restaurants 31
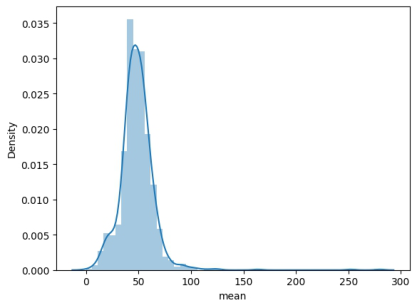
remained above 60 seconds during March. When it is aggregated among restaurants, 4.2% of 423 restaurants performed worse than the standard. Most of the durations are accumulated around 30 to 50 seconds. Last but not least, if the reasons are identified in next section and resolved, a 21% improvement gap in sales durations can be achieved on those points of sales in those restaurants.
MODELING THE PREDICTION OF MEAN DURATIONS OF POS OPERATIONS The modelling phase of the explainability of a dependent variable and the effect and contribution of each variable to mean durations in POS operation is also evaluated in detail. First of all, exploratory data analysis is conducted for the detection of skewness and other issues. For instance, many POS are used only for delivery instead of orders in restaurants. These POS are dis- covered by their durations and are not included in the analysis. To predict the mean durations, we have taken seven independent variables. We have examined the correlation between variables as realized in Table 1.
Table 1. Correlations between mean duration and extracted features.
The mean duration of sales operations is most positively correlated with mean product amounts. This is totally acceptable when the entry amount and conversations between the operator and customer are taken into account. The most negative correlation between days working and mean duration implies that the more operation is conducted in the POS, the fewer durations are expected to be achieved. To predict the mean duration in sales operation, regression models are utilized to define the contribution of each indepen- dent variable to the dependent variable and the explainability power of each variable.
In this respect, assumptions of the multiple regression model are evaluated: i) Linearity: The relationship between dependent and independent vari- ables should be linear. ii) Homoscedasticity: Constant variance of the errors should be main- tained. In this case, input samples are from populations with equal variances. iii) Multivariate normality: Multiple Regression assumes that the residuals are normally distributed. It also implies that variables are normally dis- tributed. We have approximately normally distributed data as faced in mean durations of POS operations, as given in Figure 1. iv) Lack of Multicollinearity: It is assumed that there is little or no multi- collinearity in the data. Multicollinearity exists when there is a corre- lation between multiple independent variables in a multiple regression model. In actual cases, multicollinearity is detected from variance infla- tion factor (VIF), which is a measure to detect the collinearity among independent variables.
32 ¸Sahan et al.
Figure 1: Distribution of mean durations of POS operation.
Multicollinearity must be eliminated to express the statistical importance of the independent variables more reliably, and a large number of VIF indi- cates a highly collinear relationship to the other variable (Poole and O’Farrell, 1971). For this purpose, we have selected the four most important variables to examine multicollinearity, and we observe that the returned amount has the multicollinearity issue and we have removed this variable for multiple linear regression. Lasso regression (Shafiee et al., 2021) has a similar assumption as faced in multiple linear regression, and the model does some automatic feature selection to decide which features should and should not be included on its own. SVR (Support vector regression) (Smola and Schölkopf, 2004) is a non-parametric algorithm that does not make any assumptions about the underlying data distribution. Instead, SVR handles finding the best fit for the data by minimizing the error between the predicted values and the actual values. XgBoost (Shehadeh et al., 2021) regressor can handle missing data, and the normalization is not required. On the other hand, it can overfit the data if variables are not tuned. Random forest regressor (Segal, 2004) uses an ensemble learning method for regression that combines predictions from multiple machine learning algorithms to make a more accurate prediction than a single model, and it is robust to outliers, as we faced in our case. The overfitting risk is lower than the other models, and it has bias, especially for categorical variables.
From that point of view, we have predicted the mean number of sold prod- ucts according to these five models and evaluated the importance level for each variable. The dataset is separated as test and train datasets 30 and 70 percent, respectively. In addition, MSE is selected as the performance mea- surement of each model. For this respect, Table 2 presents the variables’ importance.
Table 2 includes the feature importance levels of variables. The random Forestb regressor has the lowest MSE in the test set, and the number of sales and number of distinct products are determined as the most important vari- ables that affect mean durations. In general, the number of sales, number of distinct products, number of days working and returned amount, and cancelled amount are specific for the prediction of mean durations.
Evaluating Performance of Restaurant POS Processes in Fast-Food Restaurants 33
Table 2. Variable importance of different regressor types.
Table available in the original PDF paper.
SVR
Lasso regressor
XGBoost regressor
Variables Multiple linear regression
Random Forest regressor
0.3284 0.609357 0.149395 0.058181 0.0785
Number of sales -0.0017 7.959636 0.428114 0.469898 0.45687 Number of days working
MSE (test set) 499.708 483.5526 348.33* (overfit on train data)
To summarize, the number of distinct products, number of days working returned amount and cancel amount are the most crucial variables to control the mean durations, and these variables can be used as KPIs to monitor POS- based bottlenecks.
CONCLUSION
In this work, the factors affecting the duration of sales operation in the Point of Sale context of fast-food restaurants are evaluated. This evaluation took benefit from process mining principles to extract and discover the event logs and regression applications to identify affecting factors, thus presenting a combined framework of both areas. Eventually, this study concluded that the number of products sold, return amounts and cancelled amounts should be the focus of improvement in the POS environment in fast-food restaurants. With this result, the paper proposes the comparison of regression models in this environment. Finally, the resulting factors imply that actions can be taken to reduce the durations of POS operations from an action-oriented process mining perspective to operationally support the business. With this regard, the efficiency of process structure of POS systems for operators can be studied as a further study.
REFERENCES
Aalst, Wil & Schonenberg, Helen & Song, Minseok. Time prediction based on process mining. Inf. Syst. 2011, 36, 450–475. Alfonso E. Márquez-Chamorro, Manuel Resinas, Antonio Ruiz-Cortés, Miguel Toro.
Run-time prediction of business process indicators using evolutionary decision rules, Expert Systems with Applications, Volume 87, 2017, Pages 1–14. Andreas Rogge-Solti, Mathias Weske. Prediction of business process durations using non-Markovian stochastic Petri nets, Information Systems, 2015, Volume 54, Pages 1–14.
34 ¸Sahan et al.
Diogo R. Ferreira, Evgeniy Vasilyev. Using logical decision trees to discover the cause of process delays from event logs, Computers in Industry, 2015, Volume 70, Pages 194–207. Kimes, S. E. The Role of Technology in Restaurant Revenue Management. Cornell
Hospitality Quarterly 2008, 49(3), 297–309. M. Polato, A. Sperduti, A. Burattin and M. de Leoni, “Data-aware remaining time prediction of business process instances,” 2014 International Joint Conference on Neural Networks (IJCNN), Beijing, China, 2014, pp. 816–823. Massimiliano de Leoni, Wil M. P. van der Aalst, Marcus Dees. A general process
mining framework for correlating, predicting and clustering dynamic behavior based on event logs, Information Systems, 2016, Volume 56, Pages 235–257. National Restaurant Association. https://restaurant.org/research-and-media/resear ch/industry-statistics/national-statistics/ (12.08.23) Ojeda, Angel & Ramos, Yomayra. Point-Of-Sales Systems in Food and Beverage
Industry: Efficient Technology and Its User Acceptance. Journal of Information Sciences and Computing Technologies (JISCT) 2017, 6(1), 582–591. Poole, M. A., & O’Farrell, P. N. The assumptions of the linear regression model. Transactions of the Institute of British Geographers, 1971, 145–158. Segal, M. R. Machine Learning Benchmarks and Random Forest Regression. UCSF:
Center for Bioinformatics and Molecular Biostatistics. 2004. Shafiee, S., Lied, L. M., Burud, I., Dieseth, J. A., Alsheikh, M., & Lillemo, M.. Sequential forward selection and support vector regression in comparison to LASSO regression for spring wheat yield prediction based on UAV imagery. Computers and Electronics in Agriculture, 2021, 183. Shehadeh A., Alshboul O., Emhamed Al Mamlook, R., Hamedat, O. Machine learn-
ing models for predicting the residual value of heavy construction equipment: An evaluation of modified decision tree, LightGBM, and XGBoost regression, Automation in Construction, 2021, 129. Smola, A. J., Schölkopf B. A tutorial on support vector regression. Statistics and Computing, 2004, 14, 199–222. Suriadi, S., Ouyang, C., van der Aalst, W. M. P., ter Hofstede, A. H. M. (2013).
Root Cause Analysis with Enriched Process Logs. In: La Rosa, M., Soffer, P. (eds) Business Process Management Workshops. BPM 2012. Lecture Notes in Business Information Processing, vol. 132. Springer, Berlin, Heidelberg. Van der Aalst, Wil, Carmona, Josep. Different Types of Process Mining. Process Mining Handbook; Springer Cham; 2022, pp. 23–29. Van der Aalst, Wil. Getting the Data. Process Mining Data Science in Action, 2nd ed;
Springer Berlin: Heidelberg, Germany, 2016, pp. 125–162.
LISTED IN THE AHFE DIGITAL BOOKSTORE CATALOGUE
Explore the complete digital volume
Application of Emerging Technologies
Read this individual research paper free through the original publisher, or explore the full digital proceedings book.
ISBN 978-1-958651-91-9
Explore this ISBN in the AHFE Bookstore ↗Listed in the July 2026 bookstore catalogue; search by ISBN to confirm current availability · Digital book purchase optional