Eduarda Soares, Ines Soares, Quina Coelho, Ricardo Almeida, Rita Fernandes, Ana Teixeira, Sonia Brito-costa, Silvia Espada, Maria Antunes (2024). User's Visual Behaviour: relationships between readability, typography and background color - An Eye-tracking View. In: Human Dynamics, Product Evaluation and Quality. AHFE Open Access, vol. 131, pp. 101–110. https://doi.org/10.54941/ahfe1004868
The purpose of this study is to understand the impact of black typography on coloured backgrounds, on the user’s visual behaviour to analyse which colour and opacity are the most appropriate to read black text. We recruited 20 participants (9 identify themselves as male and 11 as female) aged from 18 to 21 years old with a mean age of 19.50 (SD=1.50). All participants were tested with the same criteria and in the same environment. Data were acquired through the Gazepoint GP3 system and the incorporated Gazepoint Application Program Interface software, capable of calculating the individual’s pupillary reaction when exposed to specific colours and individuals were subject to observation of an experimental protocol, with just 2 minutes. We used the colour setting CMY (cyan, magenta and yellow) to analyse two variables: 1) colour used as background; 2) background opacity. The first consists in the changing of the background colour over black text between the colours, yellow, magenta and cyan. The second variable consists in analysing how the change in the opacity of the background affects the reading and the user’s perception, varying the opacity percentage between 100, 50 and 25. All possible combinations (9) of coloured backgrounds were tested, to avoid inaccuracies in data analysis and processing. The typography used was Arial, the font size was 20pt and the colour was black.Through analysing and processing the data provided by the eyetracker, we were able to conclude that 100 percent opaque colours make it more difficult to read black typography. The light intensity of these colours stimulates the participant’s pupil to contract. This discomfort allows us to conclude that choosing yellow, magenta and cyan, with 100 percent opacity, is not the best combination for reading black text.We concluded also that the pupil dilates with reduced light intensities, such as 25 percent opacity. The pupil is in a state of rest when it is not subjected to extreme light stimuli (excessive and reduced), reaching an intermediate size. This happens with backgrounds at 50 percent opacity, which makes reading easier and more fluent.The pupil reaches a state of rest when not subjected to extreme light stimuli, whether excessive (too much light) or reduced (lack of light). Therefore, we can conclude that, regardless of the preferred colour, reading typography in black is more pleasant on backgrounds with opacity between 25 percent and 50 percent.Finally, it is important to highlight that the pupil is constantly adjusting to the environment exposed. The pupillary reaction can be influenced by other external factors, such as the surrounding lighting conditions and everyone’s sensitivity.
Human vision is unique. Being the only rational animal on planet Earth, it possesses a singular ability to interpret and perceive the world around it. When light reaches the retina, it is absorbed by photosensitive cells, which are responsible for sending nerve impulses to the visual cortex. These electrical signals are interpreted and processed by the brain to create the final percep- tion of the colours we see. Several studies have demonstrated that excessive use of colour can evoke varied psychological responses, ultimately affecting performance (Bhattacharyya et al., 2014; Han & Tao, 2024; Marcus, 1997; Murch, 1985).
With this experimental project, we intend to analyse how the user per- ceives and behaves when faced with black text on coloured backgrounds, more precisely the colours: yellow, magenta and cyan, using equipment capa- ble of visual tracking to obtain the results that will be discussed and analysed in this article. With this equipment, we intend to analyse the changes in of the user’s pupil when exposed to different colours and evaluate their pos- ture (Cuve et al., 2022; Evripides Zantides, 2012). Mydriasis, also known as pupillary response, is a natural physiological response of the eye in which the muscles of the iris contract or relax, translating into a change in pupil size. The pupil’s reaction to colours is a phenomenon known as the pupil- lary light reflex, where the pupil can vary in size when exposed to light, due to how different wavelengths of light are processed by the visual system (Wang et al., 2014). It should be noted that the pupillary response to colours varies from individual to individual (Mathôt, 2018; Partala & Surakka, 2003). The pupillary response is a complex and variable process, depending on several external factors (Partala & Surakka, 2003). Therefore, through this experimental project, we aim to understand how different individuals, with different backgrounds, react to black text on coloured backgrounds, taking into consideration their pupillary response as an indicator of the visual experience. The results obtained will contribute to a better understanding of the visual perception of the human being, aiming to have practical applica- tions in areas such as design, usability, and user experience. According to (Bier, 2009), “the designation readability will refer to the level of strain a reader experiences when the eye moves along the line of text; the designa- tion legibility will describe the clarity of letters while influenced by typeface familiarity”.
Bier’s distinction between readability and legibility provides a useful frame- work for understanding the reading experience and emphasizes the signif- icance of colour contrast in the reading process. In the context of screen reading, it is essential to optimize the legibility and readability parameters to enhance the reading experience (Bier, 2009). It is important to note that the rules for legibility and readability may not apply equally to reading on paper and on screen. Careful colour selection in visual design plays a crucial role in achieving optimal performance. Employing appropriate colour combinations enhances display effectiveness, potentially leading to improved performance rates (Wang et al., 2002). Conversely, poorly chosen colours can result in
User’s Visual Behaviour: Relationships Between Readability, Typography 103
decreased performance and may elevate the risk of visual fatigue (Han & Tao, 2024).
We designated colour as a physically measurable stimulus, such as the distance of a dominant light wave from the visible part of the spectrum that causes colour perception, which can also be referred to as a sensory experience generated by stimulating the visual system with a specific elec- tromagnetic radiation, and, wavelengths control not only how colour is perceived but also older, evolved circadian brain functions that determine when it is safe to be active versus inactive (Hu et al., 2020; Nadler et al., 2023). To analyse how the user perceives and behaves when faced with colour on the digital screen, we must recognise that the colours displayed are the result of intricate mixtures within the Red, Green, Blue (RGB) colour system. In the RGB colour system, the colour is defined by red, green, and blue elements, each of which can be set in the range of 0 to 255, which means 256 different values (Fay & Wu, 2024; Wang et al., 2014).
Colour can also be defined in a hexadecimal system. The first two digits create the value of red, the next two values of green, and the last two create the element of the colour blue (Fay & Wu, 2024; Wang et al., 2021). In this system, the colour of each pixel is obtained by combining different intensities of red, green, and blue light, allowing for the representation of a wide range of colours. When we consider the role of the colour contrast between the type and background, we enhance both readability and legibility. Adequate colour contrast ensures that the text stands out prominently against its background, reducing eye strain and facilitating smooth eye movement along text lines. Incorporating thoughtful colour contrast in design is similar to optimising the legibility of letters, thus making them clear and easily distinguishable. It contributes to the overall readability of the text by enhancing the visual sepa- ration between the characters and the background, creating a more accessible and comfortable reading experience for users.
This paper follows a structured organization, introducing the problem, outlining experimental protocol and participants, presenting results and discussions, and addressing some conclusions and further work.
EXPERIMENTAL PROTOCOL AND PARTICIPANTS This study aims to explore how black typography interacts with coloured backgrounds, specifically cyan, magenta, and yellow, and its impact on user visual behaviour. The primary objective is to determine the most suitable colour and opacity for optimal black text readability. All participants under- went testing under identical criteria and in a standardized environment. Data collection utilized the Gazepoint GP3 system and integrated gazepoint appli- cation program interface software, capable of analysing individual pupillary reactions to specific colours (Cuve et al., 2022). During the tests, the par- ticipants were subjected to two questionnaires: 1) before the experimental protocol, to assess the psychological and emotional component of the indi- vidual; 2) after the experimental protocol, to evaluate the user’s performance and preferences and, in the future, compare with the data provided by
the computer. To effectively test and gather all the data that would allow us to conclude about the impact of black typography on cyan, magenta, and yellow, all individuals were subject to observation of an experimental protocol, with just 2 minutes. During these two minutes of protocol, we tested:
background colour: the colours presented were the magenta, yellow and cyan, in that order;
background opacity; 100 percent, 50 percent, and 25 percent, for each of the three colours.
In this way, all possible combinations (9) of coloured backgrounds were tested, to avoid inaccuracies in data analysis and processing (Table 1).
Table 1. Summary of the selected colours along with their corresponding RGB and hexadecimal values (htmlcolorcodes.com).
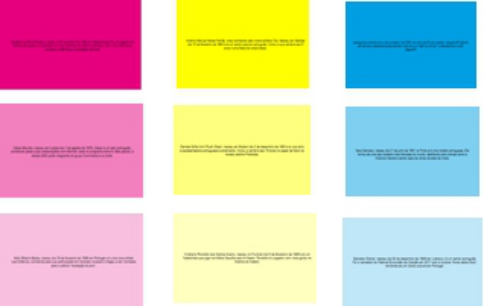
Protocol The text included in the protocol has the same theme, biography of Por- tuguese celebrities. The typography used was Arial, the font size was 20pt, and the colour was black. It is important to emphasize that all participants were informed of the anonymity of the study and no name will be men- tioned in this article or used in future studies. The experimental protocol boils down to a 2-minute video that allows us to analyse user behaviour. The study consists of 27 screens, of which 9 screens displayed black text on dif- ferent background colours, as shown in Figure 1 The users were subjected to reading small texts, all with the same typography, level of difficulty, size and colour. Regarding the background, this has two variables: 1) background colour; 2) background opacity. Therefore, the protocol includes 9 different background combinations, using the colours: 1) magenta 100 percent opac- ity; 2) magenta 50 percent opacity; 3) magenta 25 percent opacity; 4) yellow 100 percent opacity; 5) yellow 50 percent opacity; 6) yellow 25 percent opac- ity; 7) Cyan 100 percent opacity; 8) cyan 50 percent opacity; 9) Cyan 25 percent opacity. The chosen colours — cyan, magenta, yellow, and black — were originally defined in the CMYK colour space for printed materials, but
User’s Visual Behaviour: Relationships Between Readability, Typography 105
for this study we opted for precise colour tones sourced from the web-safe colour palette designed for web materials (Figure 1).
Figure 1: Experimental protocol.
The experimental tests were executed in a usability room, a place with professional equipment suitable for carrying out this type of study.
Participants The users ranged in age from 18 to 21 years old, falling within the young age group. Of the 20 participants, 9 identify themselves as male and 11 as female. All 20 young individuals attend college, but the variable that differentiates them is the field of study they are pursuing, whether the arts or non-arts. All users were required to answer two questionnaires, one before the test and the other after.
RESULTS AND DISCUSSION
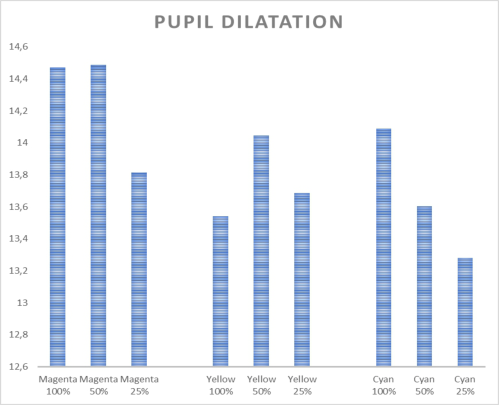
This study investigated the pupil’s response to magenta, yellow, and cyan, revealing that the reaction varies based on factors, primarily the presented colour’s intensity. The intensity of light emitted by individual pixels directly influences pupil behaviour. When a computer monitor displays a more intense and vibrant colour, the pupil contracts to reduce incoming light. Con- versely, with softer and lower-intensity colours, the pupil dilates, allowing lighter to enter the eye. The study found that colour intensity is inversely proportional to the amount of light permitted by the pupil. Additionally, background opacity influences the pixel’s intensity corresponding to the colour, aiding in adjusting brightness across the screen. Analysis of eye tracker data led to the conclusion that 100 percent opaque colours, specifically yel- low, magenta, and cyan, make it challenging to read black typography. The heightened light intensity of these colours prompts pupil contraction, causing discomfort. The observations of the Figure 1 present the variations in pupil dilation in response to different colours and intensities of light emitted by a screen. Magenta, particularly at a higher intensity (100%), is associated with the greatest pupil dilation, while cyan, especially at a lower intensity (25%), is linked to the smallest dilation. Yellow elicits an intermediate response, with the highest dilation observed at 50% intensity. These findings suggest
a colour-dependent influence on pupil size, emphasizing the significance of both colour and intensity in affecting pupillary responses. It’s noteworthy that individual differences, ambient lighting conditions, and display settings may contribute to the variability in these observations (Figure 2).
Figure 2: Pupil dilatation considering the colours magenta, yellow and cyan.
Statistically Analysis In this section the Mann-Whitney U test as applied to explore the differences in colour perception at various saturation levels. The data is presented in a triangular matrix, with p-values indicating the significance of differences between the colour-saturation combinations (Table 2, 3 and 4).
Table 2. Mann-Whitney U test considering magenta colour.
Based on Tables 2, 3, 4 is possible to note that, magenta exhibited distinct perceptual contrasts at different saturation levels. Specifically, the comparison between magenta at 100% saturation and 25% saturation yielded a significant difference (p = 0.011584387), emphasizing the influ- ence of saturation intensity on colour discrimination. The results for yel- low colour comparisons reveal noteworthy differences in colour perception based on saturation levels. Specifically, the comparison between yellow at 100% saturation and 50% saturation yielded a highly significant difference (p = 0.000173362). This suggests that variations in saturation levels sig- nificantly influence how yellow is perceived. The findings underscore the importance of considering saturation intensity in the analysis of colour dis- crimination, particularly in the context of yellow hues. The Mann-Whitney U test results for cyan colour comparisons uncover distinctive patterns in colour perception associated with different saturation levels. Notably, the comparison between cyan at 100% saturation and 25% saturation yielded a significant difference (p = 0.016430232). This indicates a perceptible shift in how cyan is perceived based on saturation intensity. On the other hand, the comparisons between cyan at 50% saturation versus 100% sat- uration (p = 0.029322187) and 50% saturation versus 25% saturation (p = 0.098433729) did not reach significance. These findings emphasize the nuanced relationship between saturation levels and colour discrimination, particularly in the context of cien colour variations. While some colour- saturation combinations exhibit significant differences, others remain per- ceptually similar. Understanding these distinctions is crucial for fields where accurate colour representation is vital, such as design, marketing, and visual communication.
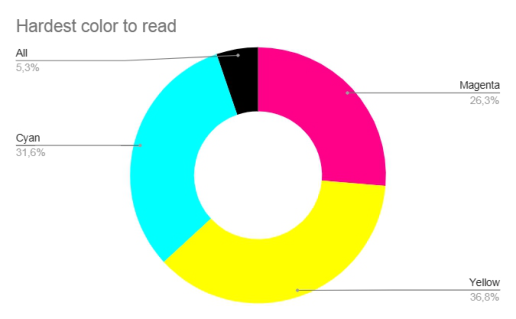
Questionnaire Analysis Based on Figure 3, from the participant’s response to the questionnaire at the end of the experimental protocol, we can conclude that the colour that makes reading black typography more difficult is yellow, with 36.8 percent, 7 out of 20. The second background colour that makes reading more dif- ficult is cyan, followed by magenta. 1 participant (5.3 percent) responded that all colours make reading difficult. The decrease in the opacity of a colour reduces its intensity. From the analysis of the data, we con- cluded that the pupil dilates with reduced light intensities, such as 25 percent opacity. The pupil is in a state of rest when it is not subjected to extreme light stimuli (excessive and reduced), reaching an intermediate size.
Figure 3: Pie chart (hardest colour to read).
This happens with backgrounds at 50 percent opacity, which makes read- ing easier and more fluent. The pupil reacts to colour and its intensity, and although some users may have greater sensitivity to colours due to their field of study (such as arts), we were not able to find a pattern that allows us to differentiate the participants based on this factor. Based on the data provided, we can conclude that cyan, magenta, and yellow are effective and efficient for reading black typography, however the choice of opacity should be between 50 percent and 25 percent. All participants considered the experimental tests easy and relevant.
CONCLUSION AND FURTHER WORK The application of virtual reality, augmented reality, and eye tracking to improve understanding of language processing, attention, perception, mem- ory, learning, and decision-making has been investigated in several engineer- ing and cognitive science studies (Abreu et al., 2020; De Almeida et al., 2022; Joseph & Murugesh, 2020; Liu et al., 2021; Martins et al., 2020, 2022; Saint-Aubin & Klein, 2015). The use of eye-tracking technology opens up important areas in the field of human-computer interaction that offer fresh perspectives and knowledge (Albanesi et al., 2011; Guo & Cheng, 2019; KE et al., 2018; Lamb et al., 2022; Rappa et al., 2022; Schall, 2014). Usabil- ity testing, user experience research, accessibility, neuroadaptive interfaces, virtual and augmented reality, and user interface design are among these domains, all of which require careful examination (Liu et al., 2021; Martins et al., 2022; Saint-Aubin & Klein, 2015).
In this study, and related to the context of coloured backgrounds, specif- ically cyan, magenta, and yellow, a series of experimental tests were con- ducted, leveraging the Gazepoint GP3 system and integrated Gazepoint Application Program Interface software, and it was concluded that users exhibit greater comfort and confidence when reading black text on back- grounds with reduced opacity. The pupil tends to reach a state of rest in the
User’s Visual Behaviour: Relationships Between Readability, Typography 109
absence of extreme light stimuli, whether excessive or diminished. Conse- quently, this study suggests that, irrespective of the chosen cyan, magenta, or yellow, reading black typography is more enjoyable on backgrounds with opacity ranging from 25 percent to 50 percent. It’s noteworthy that the pupil continually adapts to the exposed environment, and pupillary reactions may be influenced by external factors like surrounding lighting conditions and individual sensitivity.
REFERENCES
Abreu, C., de Almeida, H., Lucchese, F., Donado Briegas, M. J. J., Sanchez Iglesias, A.
I., Castro, F. vicente, & Brito-Costa, S. (2020). The importance of brandy equity in natural human behavior: A study with eyetracking. Confinia Cephalalgica, 30(1). Albanesi, M. G., Gatti, R., Porta, M., & Ravarelli, A. (2011). Towards semiautomatic usability analysis through eye tracking. ACM International Conference Proceeding Series, 578. https://doi.org/10.1145/2023607.2023631 Bhattacharyya, D., Chowdhury, B., Chatterjee, T., Pal, M., & Majumdar, D. (2014).
Selection of character/background colour combinations for onscreen searching tasks: An eye movement, subjective and performance approach. Displays, 35(3). https://doi.org/10.1016/j.displa.2014.03.002 Bier, S. (2009). Typeface Legibility: Towards defining familiarity [Ph. D. Dissertation]. Royal College of Art. Cuve, H. C., Stojanov, J., Roberts-Gaal, X., Catmur, C., & Bird, G. (2022). Valida-
tion of Gazepoint low-cost eye-tracking and psychophysiology bundle. Behavior Research Methods, 54(2). https://doi.org/10.3758/s13428-021-01654-x De Almeida, H. M. R., Brito-Costa, S., Bem-Haja, P., & Briegas, J. J. M. (2022).
Colour usage in the lettering and in background manipulation on logotypes: Eyetracking evidences. Confinia Cephalalgica et Neurologica, 32. Evripides Zantides, A. P. and T. P. (2012). Typography in Publication Design: The use of eye-tracker technology to evaluate typefaces, Greek fonts and publication design for screen. Greek Fonts and Publication Design for Screen. Fay, C. D., & Wu, L. (2024). Critical importance of RGB color space specificity for
colorimetric bio/chemical sensing: A comprehensive study. Talanta, 266. https: //doi.org/10.1016/j.talanta.2023.124957 Guo, W., & Cheng, S. (2019). An approach to reading assistance with eye tracking data and text features. Adjunct of the 2019 International Conference on Multimodal Interaction, ICMI 2019. https://doi.org/10.1145/3351529.3360659 Han, J., & Tao, D. (2024). A Study of the Impact of Interface Colour Schemes and
Work Experience on Visual Search Performance (pp. 468–478). https://doi.org/ 10.2991/978-94-6463-256-9_48 Hu, K., De Rosa, E., & Anderson, A. K. (2020). Differential color tuning of the mesolimbic reward system. Scientific Reports, 10(1). https://doi.org/10.1038/ s41598-020-66574-w Joseph, A. W., & Murugesh, R. (2020). Potential Eye Tracking Metrics and Indicators
to Measure Cognitive Load in Human-Computer Interaction Research. Journal of Scientific Research, 64(01). https://doi.org/10.37398/jsr.2020.640137 KE, M., Lin, B.-G., & Yang, Y. (2018). Study on Applications of Eye Tracking in Different Fields. DEStech Transactions on Computer Science and Engineering, cimns. https://doi.org/10.12783/dtcse/cimns2017/17400 Lamb, M., Luque, E. P., & Billing, E. (2022). Understanding Eye-Tracking in Virtual
Reality. CEUR Workshop Proceedings, 3400.
Liu, H., Liu, H., Li, F., Han, B., & Wang, C. (2021). Effect of Cognitive Control on Attentional Processing of Emotional Information Among Older Adults: Evidence From an Eye-Tracking Study. Frontiers in Aging Neuroscience, 13. https://doi.or g/10.3389/fnagi.2021.644379 Marcus, A. (1997). Graphical user interfaces. In M. Helander, T. K. Landauer, & P. Prabhu (Eds.), Handbook of human-computer interaction (Oxford, pp. 423–440). Oxford. Martins, N. C., Dias, P., & Santos, B. S. (2020). Egocentric viewpoint in mixed
reality situated visualization: Challenges and opportunities. Proceedings of the International Conference on Information Visualisation, 2020-September. https: //doi.org/10.1109/IV51561.2020.00012 Martins, N. C., Marques, B., Dias, P., & Santos, B. S. (2022). Augmenting the Reality of Situated Visualization. Proceedings of the International Conference on Information Visualisation, 2022-July. https://doi.org/10.1109/IV56949.2022. 00018 Mathôt, S. (2018). Pupillometry: Psychology, physiology, and function. In Journal of
Cognition (Vol. 1, Issue 1). https://doi.org/10.5334/joc.18 Murch, G. M. (1985). Colour Graphics—Blessing or Ballyhoo? Computer Graphics Forum, 4(2). https://doi.org/10.1111/j.1467-8659.1985.tb00202.x Nadler, E. O., Darragh-Ford, E., Desikan, B. S., Conaway, C., Chu, M., Hull, T.,
& Guilbeault, D. (2023). Divergences in color perception between deep neural networks and humans. Cognition, 241. https://doi.org/10.1016/j.cognition.2023. 105621 Partala, T., & Surakka, V. (2003). Pupil size variation as an indication of affective processing. International Journal of Human Computer Studies, 59(1–2). https://doi.org/10.1016/S1071-5819(03)00017-X Rappa, N. A., Ledger, S., Teo, T., Wai Wong, K., Power, B., & Hilliard, B. (2022).
The use of eye tracking technology to explore learning and performance within virtual reality and mixed reality settings: a scoping review. In Interactive Learn- ing Environments (Vol. 30, Issue 7). https://doi.org/10.1080/10494820.2019. 1702560 Saint-Aubin, J., & Klein, R. M. (2015). Capturing reading processes in connected texts with eye movements and a letter detection task. In Attention and Vision in Language Processing. https://doi.org/10.1007/978-81-322-2443-3_6 Schall, A. (2014). Eye tracking insights into effective navigation design. Lecture
Notes in Computer Science (Including Subseries Lecture Notes in Artificial Intel- ligence and Lecture Notes in Bioinformatics), 8517 LNCS(PART 1). https://doi. org/10.1007/978-3-319-07668-3_35 Wang, A. H., Chen, C. H., & Chen, M. Te. (2002). Effect of VDT leading display design of dynamic information on users’ visual performance and visual fatigue. Journal of the Chinese Institute of Industrial Engineers, 19(2). https://doi.org/10. 1080/10170660209509193 Wang, C. A., Boehnke, S. E., Itti, L., & Munoz, D. P. (2014). Transient pupil response
is modulated by contrast-based saliency. Journal of Neuroscience, 34(2). https: //doi.org/10.1523/JNEUROSCI.3550-13.2014 Wang, Y., Wang, S., & Xu, M. (2021). The function of color and structure based on eeg features in landscape recognition. International Journal of Environmental Research and Public Health, 18(9). https://doi.org/10.3390/ijerph18094866
LISTED IN THE AHFE DIGITAL BOOKSTORE CATALOGUE
Explore the complete digital volume
Human Dynamics, Product Evaluation and Quality
Read this individual research paper free through the original publisher, or explore the full digital proceedings book.
ISBN 978-1-964867-07-6
Explore this ISBN in the AHFE Bookstore ↗Listed in the July 2026 bookstore catalogue; search by ISBN to confirm current availability · Digital book purchase optional